Vol.51, n. 1 : pp.35-41, January-February 2008
ISSN 1516-8913 Printed in Brazil BRAZILIAN ARCHIVES OF
BIOLOGY AND TECHNOLOGY
A N I N T E R N A T I O N A L J O U R N A L
Multivariable
Parameter
Optimization
for
the
Endoglucanase Production by Trichoderma reesei Rut C30
from Ocimum gratissimum seed
Mithu Das, Rintu Banerjee* and Satish Bal
Microbial Biotechnology and Downstream Processing Laboratory; Agricultural and Food Engineering Department; Indian Institute of Technology; Kharagpur-721302 - India
ABSTRACT
The aim of this study was to evaluate the interaction effects of the physico-chemical parameters on the endoglucanase (CMCase) production by Trichoderma reesei Rut C30 on a cellulosic agro-residue by the solid-state fermentation (SSF) and to determine their optimum values by the EVOP factorial design technique. The best combination of physical parameters for the maximum production of the endoglucanase (CMCase) was 28oC temperature, 79% relative humidity and 4.8 pH of the medium. The best combination of the chemical parameters was (mg/L) nicotinic acid 15, naphthalene acetic acid 7, ferric chloride 5 and Tween-80 6. With the application of this technique, the yield of the CMCase increased by ~ 2.3 fold.
Key words: Enzyme, endoglucanase, carboxymethylcellulase (CMCase), EVOP factorial design technique
*
Author for correspondence
INTRODUCTION
Cellulases have attracted much interest because of the diversity of their application. Since the cost of production is the major constraint in the cellulase production, much attention is drawn on the availability of low cost carbon source and on effective fermentation system. Fungal cellulases are produced in large amounts, which include all the components of multi enzyme system acting in a synergism for the complete hydrolysis of the cellulose. Trichoderma reesei Rut C30isknown to be one of the best cellulolytic fungal strain, which makes it an ideal test organism for the cellulase production. The organism produces CMCase in major level than the other two enzymes, exo-β -glucanase and β-glucosidase (Chahal et al., 1982; Juhász et al., 2004). Both the liquid and solid
-state fermentations have been tried for the
cellulase production by Trichoderma sp.
(Esterbauer et al., 1991; Kubicek, 1992;
Montenecourt, 1983). Wheat bran has been extensively used in SSF (Jabbar and Ilahi, 1981). Reports on the production of the cellulase by
Trichoderma sp. in SSF (Chahal, 1985; Chahal, 1986; Chahal, 1991; Kim et al., 1985; Sim et al.,
1990) are numerous because different strains and mutants, culture conditions and substrates have been used under different studies. In the present study, the fungus was grown on a novel substrate
(mixture of sawdust and seeds of Ocimum
In the traditional single variable search technique, the probable interaction among the factors gets ignored, and thus, the true optimum condition may not be determined. The EVOP factorial design technique has been reported as useful technique to study bioprocesses. (Banerjee and Bhattacharyya, 1993; Tunga et al., 1999).
In the EVOP, the tool for optimizing the multivariable parameters, the decision-making procedure is easy and comprehensive. Moreover, it predicts the changes of variables towards the objective maximum and minimum values. The aim of the present investigation was to study the impact of three physical and four chemical factors on maximizing the CMCase yield.
MATERIALS AND METHODS
Microorganism
Trichoderma reesei Rut C30 was maintained on PDA slants at 28oC and subcultured once in two weeks.
Raw Materials and Chemicals
Sawdust from Sal wood (Shorea robusta L.) and dry intact seeds of Ocimum gratissimum L. were processed locally. All chemicals used were of analytical grade and were obtained from the s.d. fine chemicals, Merk, SRL, India.
Medium and Culture Conditions
The medium used for the growth of the fungal culture of the organism contained (g/L) KH2PO4 2,
(NH4)2SO4 1.4, MgSO4.7H2O 0.3, CO(NH2)2 0.2,
peptone 0.2, yeast extract 0.2, lactose 1 and NaNO3 1. The sawdust (1g) and seed (2g) were
mixed with the liquid medium in 1:3 ratio in 250ml Erlenmeyer flasks and autoclaved at 121oC for 20 min. The mixed substrate was inoculated with 2ml spore (conidia) suspension of the fungal culture containing ~ 3.6x10⁶ spores/ml.
Fermentation was carried out for six days. Extraction of enzyme from the fermented biomass was carried out by soaking 3g of biomass with 3ml of 5% glycerol for 2h at room temperature.
CMCase assay was done using 0.5ml of 1% Na-CMC (carboxymethyl cellulose) as substrate and 0.25ml of 0.4M Glycine-HCl (pH 4) as buffer. Activity was measured by adding 0.25ml of diluted enzyme incubated for 10min at 50°C. Enzyme activities (IU) were expressed as 1µmole of glucose equivalents released per milliliter per
minute. The reducing sugar was measured with the dinitrosalicylic acid reagent (Miller, 1959). Total protein was estimated using bovine serum albumin as described by (Lowry et.al, 1951).
Optimization of variables by the EVOP based on factorial technique
The proposed methodology combines the
advantage of factorial technique for designing experiments with three and four parameters separately and that of EVOP methodology for the systematic analysis of experimental results, and facilitates the selection of optimum conditions. Apart from the control, the total number of new experiments to be conducted is 23 for the study of 3 variable systems and 24 for the study of 4 variable systems. The parameters for the above experiments are kept in both the higher level (+) and lower level (-) compared to the search level (control) region (0). The total number of
experiments in 3 variable parameters is
represented in a matrix of [n x (2n +2)] i.e., 30 and the total number of experiments in a 4 variable parameters is represented in a matrix of 72. Matrices are divided into two blocks (block I and block II). Each of them is having one set of control experiment (search level). Each new experiment in block I has an odd number of lower level (-) parameter (s), such as 1, 3, 5 and block II should have an even number of lower level (-) parameter (s), such as 2, 4. When block I exhibits lower level (-) responses, block II exhibits higher level (+)
responses compared to those of control
experiments.
All the experiments were conducted two times (cycle I and cycle II) to minimize the standard deviation and error limits.
The ‘n’ variable system can have nc1= n numbers
zero order interaction, nc2= n (n-1)/2! numbers first
order interaction, nc3= n (n-1)(n-2)/3! numbers
second order interaction, nc4= n (n-1)(n-2)(n-3)/4!
numbers third order interaction and so on.
So the total number of effects can be expressed as [nc1 + nc2 + nc3 + ………….. ncn] + the change in
mean effect. n
= ∑ nC1 + the change in mean effect
i =1
The calculation of the effect can be made based on the well-known theory of fractional factorials (Adleret al., 1975; Davis, 1954).
individual level. Hence, any effect can be estimated from the generalized form as shown in the equation-1
n´
E1= 1/n´[ ∑ (Higher interaction level effects)
i=1 n´
- ( ∑ Lower interaction level effects)] i =1
and the change in mean effects of all the experimental conditions can be expressed in generalized form as shown in equation ---2
m 2m
E2= 1/2 [1/m (∑ ai- ma1) + 1/m( ∑aj- mam+1)] i =2 j =m+2
Where, E1 --- effect
E2 --- change in mean effects
n´ --- No. of higher or lower interaction level effects
m --- No. of experiments in Block – I or Block- II
The standard deviation and error limits based on a 95% confidence level are estimated from the differences according to the relationship given in the literature (Box et.al, 1959; Pearson et.al, 1962) and are calculated as given below:
σ (standard deviation) =1/2 (σ1+ σ2), where, σ1=R1ƒ and σ2 =R2ƒ;
R1 = (largest difference – smallest difference) in
Block – I
R2 = (largest difference – smallest difference) in
Block – II
ƒ (statistical constant)= 0.3 for number of cycles (n”) = 2 and number of new experiments per cycle (k) = 32.
Error limits: For average: ±(2/
n
"
) σ,For effects: ±(0.71x2/
n
"
) σ,For change in mean: ±(0.63x2/
n
"
) σ.After the calculation of change in mean effects and error limits, it is necessary to examine whether any change in the control (search level) experimental condition will help to improve the objective function (i.e., response) and if so, which is the desired direction of change (Banerjee and
Bhattacharyya, 1993). For that the magnitudes of the effects are compared with that of the error limits. If all or any of the effects are larger than the error limits, the change in the experimental conditions may yield better results. The decision on the desired direction of change of a variable has been described in the literature (Tunga et al.,
1999).
In the present work, the control experimental conditions were selected based on the results of the effect of the individual parameters on the
cellulase production by the SSF. Then,
experimental conditions were selected with the lower and higher levels of the parameters compared to the control or search level. The fermentation was carried out at these levels of parameters and all the experiments were repeated for two cycles. CMCase yield was estimated
following the procedure described earlier.
Differences in the cellulase yield between the cycles I, and II and the average cellulase yield were calculated to estimate the effects and error limits. The magnitude of the effects, error limits and change in mean effect was examined as per the decision-making procedure to arrive at the optimum.
RESULTS AND DISCUSSION
Optimization of Physical Parameters
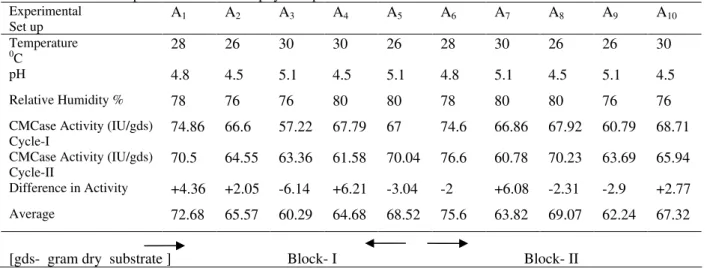
Table 1 shows the experimental conditions for the first set of optimization of three physical parameters and the corresponding cellulase yields.
Calculation of the effects resulted with
temperature (T, -4.82), pH (P, -2.94), relative humidity (R, +2.66), (TP, -1.00), (TR, +2.22) and (PR, -0.23). Analysis of the results showed that most of the effects were smaller than the error limits, for the averages (±4.45), for the effects (±3.17) and for the change in the mean (±2.80); the change in the mean effect was negative and large (-7.16), which was a confirmation of achieving optimum condition. Moreover, the effect of the temperature (T, -4.82), which was higher, was not much large in comparison to the error limits. Hence, as per the decision making rule, maximum CMCase yield was achieved with the search region A1 and A6, which was the optimum
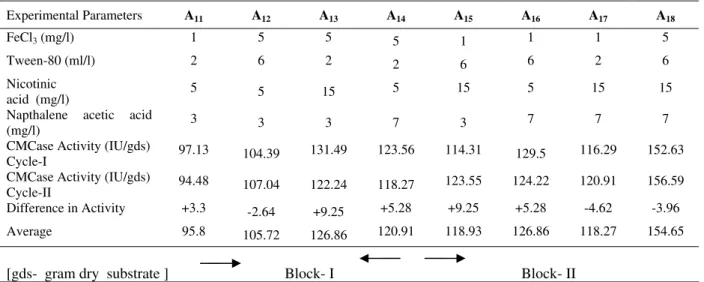
Optimization of Chemical Parameters Table 2 shows the experimental conditions for the first set of optimization and the corresponding CMCase yields. Results given in Tables 4 and 5 showed that half of the effects were smaller than the error limits and the change in the mean effect was positive and but not large in comparison to the error limits. Magnitudes of most of the effects were still higher and the change in the mean effect was positive but not large. Moreover, the CMCase yield in set A18 was highest, which contained all
the parameters at their higher level (+). Thus, it didn’t ensure that the condition at the search region A1 and A10 of set-I was the real optimum
condition and a second set of experiments was required with the higher search level of A18 as
control level.
The experimental conditions and results of set-II are presented in Table 3. The results given in Table 4 and 5, showed that the change in mean effect (- 32.37) was large and negative and most of the effects were also less than the error limits, for the averages (± 10.77), for the effects (± 7.66) and for change in the mean (± 6.80). The four variable interaction effects were very small compared to error limits.
Table 1 - Results of optimization of three physical parameters
Experimental Set up
A1 A2 A3 A4 A5 A6 A7 A8 A9 A10
Temperature 0
C
28 26 30 30 26 28 30 26 26 30
pH 4.8 4.5 5.1 4.5 5.1 4.8 5.1 4.5 5.1 4.5
Relative Humidity % 78 76 76 80 80 78 80 80 76 76
CMCase Activity (IU/gds) Cycle-I
74.86 66.6 57.22 67.79 67 74.6 66.86 67.92 60.79 68.71
CMCase Activity (IU/gds) Cycle-II
70.5 64.55 63.36 61.58 70.04 76.6 60.78 70.23 63.69 65.94
Difference in Activity +4.36 +2.05 -6.14 +6.21 -3.04 -2 +6.08 -2.31 -2.9 +2.77
Average 72.68 65.57 60.29 64.68 68.52 75.6 63.82 69.07 62.24 67.32
[gds- gram dry substrate ] Block- I Block- II
Table 2 - Results of optimization of four chemical parameters Set-I
Experimental
Parameters A1 A2 A3 A4 A5 A6 A7 A8 A9 A10
FeCl3 (mg/l) 3 5 1 1 1 5 5 1 5 3
Tween-80 (ml/l) 4 2 6 2 2 6 2 6 6 4
Nicotinic
acid (mg/l) 10 5 5 15 5 15 15 15 5 10
Napthalene acetic
acid (mg/l) 5 3 3 3 7 3 7 7 7 5
CMCase Activity
(IU/gds) Cycle-I 112.32 105.72 93.83 118.93 126.86 122.89 105.72 132.15 118.93 113.65 CMCase Activity
(IU/gds) Cycle-II 108.36 103.74 105.06 121.57 130.16 118.93 100.43 126.86 122.89 105.72 Difference in
Activity +3.96 +1.98 -11.23 -2.64 -3.3 +3.96 +5.28 +5.28 -3.96 +7.93
Con. Table 2
Experimental Parameters A11 A12 A13 A14 A15 A16 A17 A18
FeCl3 (mg/l) 1 5 5 5 1 1 1 5
Tween-80 (ml/l) 2 6 2 2 6 6 2 6
Nicotinic
acid (mg/l) 5 5 15 5 15 5 15 15
Napthalene acetic acid
(mg/l) 3 3 3 7 3 7 7 7
CMCase Activity (IU/gds)
Cycle-I 97.13 104.39 131.49 123.56 114.31 129.5 116.29 152.63
CMCase Activity (IU/gds)
Cycle-II 94.48 107.04 122.24 118.27 123.55 124.22 120.91 156.59
Difference in Activity +3.3 -2.64 +9.25 +5.28 +9.25 +5.28 -4.62 -3.96
Average 95.8 105.72 126.86 120.91 118.93 126.86 118.27 154.65
[gds- gram dry substrate ] Block- I Block- II
Table 3 - Results of optimization of four chemical parameters Set-II
Experimental
Parameters A1 A2 A3 A4 A5 A6 A7 A8 A9 A10
FeCl3 (mg/l) 5 7 3 3 3 7 7 3 7 5
Tween-80 (ml/l) 6 4 8 4 4 8 4 8 8 6
Nicotinic
acid (mg/l) 15 10 10 20 10 20 20 20 10 15
Napthalene acetic
acid (mg/l) 7 5 5 5 9 5 9 9 9 7
CMCase Activity
(IU/gds) Cycle-I 175.09 149.33 146.69 147.34 152.63 144.7 148.66 136.77 128.84 176.42 CMCase Activity
(IU/gds) Cycle-II 173.77 154.61 151.97 145.36 140.74 136.11 141.4 125.54 130.16 175.76 Difference in
Activity +1.32 -5.28 -5.28 +1.98 +11.89 +8.59 +7.26 +11.23 -1.32 -0.66
Average 174.43 151.97 149.33 146.02 146.69 140.08 144.7 130.82 129.5 175.76
Con. Table 3
Experimental Parameters A11 A12 A13 A14 A15 A16 A17 A18
FeCl3 (mg/l) 3 7 7 7 3 3 3 7
Tween-80 (ml/l) 4 8 4 4 8 8 4 8
Nicotinic
acid (mg/l) 10 10 20 10 20 10 20 20
Napthalene acetic acid
(mg/l) 5 5 5 9 5 9 9 9
CMCase Activity (IU/gds)
Cycle-I 146.68 128.19 141.89 146.68 145.36 147.35 146.02 145.36
CMCase Activity (IU/gds)
Cycle-II 155.93 132.15 130.16 134.79 146.68 153.29 139.42 135.45
Difference in Activity -9.25 -3.96 +11.23 +11.89 -1.32 -5.94 +6.60 +9.91
Average 151.31 130.16 135.45 140.74 146.02 149.99 142.72 140.08
Table 4 - Calculation of effects of four inducer system: Metal ion, FeCl3 (M); Surfactant, Tween-80 (S); Vitamin,
Nicotinic acid (V); Hormone, Napthalene acetic acid (H)
Table 5 - Calculation of standard deviation and error limits
Hence, as per the decision making rule, maximum CMCase yield was achieved with the search region A1 and A10 of set-II, was the optimum condition
for the same through SSF by Trichoderma reesei
Rut C30.
Judicious designing of the experiment and the manipulation of the levels to increase the CMCase yield with the critical analysis of the combinatorial impact of the three physical and four chemical parameters resulted ~ 2.3 folds increase in yield
with the maximum activity of 175.76 IU/gds in A10 of set-II, (Table 5).
CONCLUSION
The EVOP technique is a powerful tool for the
optimization of the multiple parameters
simultaneously of any complex system such as the solid-state-fermentation. From the laboratory
experiments, initial operating and design
Parameters Set-I Set-II
M +2.643 -6.211
S +7.268 -5.352
V +11.232 -2.709
H +13.215 -3.039
MS +3.964 -2.841
VH -3.964 -31.98
MV +1.982 +4.955
MH -3.303 -29.93
SV +16.518 +2.378
SH +7.929 -0.528
MSV +4.625 +5.814
MSH +5.946 +0.858
SVH +9.250 -4.559
VHM +3.964 +4.493
MSVH +4.625 -0.330
Set-I Set-II
Standard deviation 7.07 7.66
Change in mean effect + 8.59 - 32.37
Average ± 9.91 ± 10.77
Effects ± 7.07 ± 7.66
Error limits
conditions of a large- scale production unit can be obtained. The optimum conditions of the temperature, pH and relative humidity were 28 oC, 4.5 and 78% respectively, while the optimum levels of additives were nicotinic acid (as vitamin source) 15mg/l, napthanlene acetic acid (as hormone) 7mg/l, ferric chloride (as metal ion) 5mg/l and Tween-80 (as surfactant) 6ml/l.
With the application of this technique the cellulase yield increased by ~ 2.3 fold with maximum activity of 175.8 IU/gds and titre value of 21 IU/ml.
ACKNOWLEDGEMENTS
The financial support for this work was received from ICAR (Indian Council of Agricultural Research).
REFERENCES
Adler (1975), The Design of experiments to find Optimal Conditions. Moscow: Mir Publishers, pp 118-144.
Banerjee, R., Bhattacharyya, B.C. (1993), Evolutionary Operation (EVOP) to optimize three – dimensional biological experiments. Biotechnol Bioengg., 41, 67-71
Box, G. E. P., Hunter, J. S. (1959), Condensed calculation for evolutionary operation programs.
Technometric.,1, 77-95.
Chahal, D. S., McGuire, S., Pikor, H., Noble, G. (1982), Production of cellulase complex by Trichoderma reesei Rut C30 on lignocellulose and its hydrolytic potential. Biomass.,2, 127-137.
Chahal, D. S. (1985), Solid-state fermentation with
Trichoderma reesei for cellulase production. Appl Environ Microbiol.,449, 205-210.
Chahal, D. S. (1986), A new approach in solid-state fermentation for cellulase production. In:
Biotechnology and Renewable Energy, ed. M. Moo-Young, S. Harnain, J. Lampty, Elsevier Applied Science, London pp 57-69.
Chahal, D. S. (1991), Production of Trichoderma reesei
cellulase system with high hydrolytic potential by solid-state fermentation. In: Comstock J, ed. ACS symposium series, vol. 460. American Chemical Society, Washington, D C, pp 111-122.
Davis, O. L. (1954), Design and analysis of Industrial Experiments. New York : Hafner Publishing Co, pp 440-480.
Esterbauer, H., Steiner, J., Labudova, I., Hermann, A., Hayn, M. (1991), Production of Trichoderma
cellulase in laboratory and pilot scale. Bioresource Technol., 51– 65.
Jabbar, A., Ilahi, A. (1981), Evaluation of solid substrates for the biosynthesis of cellulase by
Trichoderma viride.Agric boil chem., 45, 1719-1720 Juhász, T., Szengyel, Z., Szijártó, N., Réczey, K.
(2004), Effect of pH on cellulase production of
Trichoderma reesei RUT C30. Applied Biochem and Biotechnol., 113, 201-212.
Kim, J. H., Hosobuchi, M., Kishimoto, M., Seki, T., Yoshida, T., Taguchi, H., Ryu, D. D. Y. (1985), Cellulase production by a solid state culture system.
Biotechnol Bioeng., 27, 1445-1450
Kubicek, C. P. (1992), The cellulase proteins of
Trichoderma reesei structure, multiplicity, mode of action and regulation of formation. Adv Biochem Eng Biotechnol., 45, 1– 27.
Lowry, O. H., Rosenbrough, N. J., Farr, A. L., Randall, R. J. (1951), Protein estimation with the Folin Phenol reagent. J Biol Chem., 193, 265.
Miller, G. L. (1959), Use of dinitrosalicylic acid reagent for determining reducing sugars. Anal Chem.,31, 426-429.
Montenecourt, B. S. (1983), Trichoderma reesei
cellulases. Trends in Biotechnol.,1, 156-161.
Pearson, E. S., Hartley, H. O. (1962), Biometrika Tables for Statisticians. vol. 1 (2nd ed.) Cambridge: University Press, pp 46.
Sim, T. S., Oh, J. C. S. (1990), Spent brewery grains as substrate for the production of cellulases by
Trichoderma reesei QM9414. J Ind Microbiol 5: 153-158.
Tunga, R. Banerjee, R. Bhattacharyya, B.C. (1999), Optimization of n-variable biological experiments by evolutionary operation factorial-design technique. J Biosci Bioengg., 87, 125-131.