(Annals of the Brazilian Academy of Sciences) ISSN 0001-3765
www.scielo.br/aabc
Pore system changes of damaged Brazilian oxisols and nitosols induced
by wet-dry cycles as seen in 2-D micromorphologic image analysis
LUIZ F. PIRES1,2, KLAUS REICHARDT2, MIGUEL COOPER3, FABIO A.M. CÁSSARO1, NIVEA M.P. DIAS4 and OSNY O.S. BACCHI2
1Laboratório de Física Aplicada a Solos e Ciências Ambientais, Departamento de Física
Universidade Estadual de Ponta Grossa, UEPG, Av. General Carlos Cavalcanti, 4.748 Campus de Uvaranas, 84030-900 Ponta Grossa, PR, Brasil
2Laboratório de Física dos Solos, Centro de Energia Nuclear na Agricultura, USP/CENA, Av. Centenário, 303
Caixa Postal 96, 13400-970 Piracicaba, SP, Brasil
3Departamento de Solos e Nutrição de Plantas, Escola Superior de Agricultura Luiz de Queiroz, USP/ESALQ
Av. Pádua Dias, 11, Caixa Postal 9, 13418-900 Piracicaba, SP, Brasil
4Departamento de Ciência do Solo, Universidade Estadual de Ponta Grossa, UEPG, Av. General Carlos Cavalcanti, 4.748
Campus de Uvaranas, 84030-900 Ponta Grossa, PR, Brasil
Manuscript received on January 13, 2008; accepted for publication on September 9, 2008; contributed byKLAUSREICHARDT*
ABSTRACT
Soil pore structure characterization using 2-D image analysis constitutes a simple method to obtain essential informa-tion related to soil porosity and pore size distribuinforma-tion (PSD). Such informainforma-tion is important to infer on soil quality, which is related to soil structure and transport processes inside the soil. Most of the time soils are submitted to wetting and drying cycles (W-D), which can cause important changes in soils with damaged structures. This report uses 2-D image analysis to evaluate possible modifications induced by W-D cycles on the structure of damaged soil samples. Samples of three tropical soils (Geric Ferralsol, GF; Eutric Nitosol, EN; and Rhodic Ferralsol, RF) were submitted to three treatments: 0WD, the control treatment in which samples were not submitted to any W-D cycle; 3WD and 9WD with samples submitted to 3 and 9 consecutive W-D cycles, respectively. It was observed that W-D cycles produced significant changes in large irregular pores of the GF and RF soils, and in rounded pores of the EN soil. Nevertheless, important changes in smaller pores (35, 75, and 150 µm) were also observed for all soils. As an overall consideration, it can be said that the use of image analysis helped to explain important changes in soil pore systems (shape, number, and size distribution) as consequence of W-D cycles.
Key words:soil bulk density, soil water content, soil porosity, micromorphology, soil structure, compaction.
INTRODUCTION
The soil pore system (SPS) is directly related to the shape, size and spatial arrangement of individual soil particles and aggregates. This arrangement of soil con-stituents originates different soil pore distributions and porosities, which is crucial, for instance, for good soil aeration, water infiltration, and root penetration (Pagliai
*Member Academia Brasileira de Ciências Correspondence to: Luiz Fernando Pires E-mail: [email protected]
1987). Modifications on soil pore size distribution (PSD), pore shape, and pore arrangement can be used to characterize possible SPS changes due to W-D cycles (Hussein and Adey 1998).
As a result, soil bulk density increases followed by soil pore volume decreases can in general be observed.
Wetting and drying (W-D) cycles can also act as a mechanism of SPS changes (Pagliai et al. 1987, Hussein and Adey 1998, Bresson and Moran 2003). During a W-D cycle the soil pore system can be modified, mainly due to changes in soil particle orientations. Some authors have shown that sequences of W-D cycles can cause, for instance, aggregate formation in non-aggregated soils. It can in some circumstances regenerate struc-turally damaged soils and can induce, by increasing soil porosity, significant changes in SPS (Pagliai 1987, Sar-tori et al. 1985, Newman and Thomasson 1979, Telfair et al. 1957).
The 2-D image analysis of resin impregnated soil blocks has been used to evaluate SPS changes at meso and microscopic scales. It allows evaluating variations of the type and size distribution of pores in damaged soil samples after W-D cycles (Pillai and McGarry 1999). It can give useful information about the number, area, perimeter, diameter, shape, arrangement, and PSD.
The image analysis technique to quantify and char-acterize the porosity of impregnated soil blocks was firstly introduced by Jongerius et al. (1972) and Murphy et al. (1977a, b). Several other contributions describing its use were presented afterwards (Cooper et al. 2005, Horgan 1998, Thompson et al. 1992, Ringrose-Voase 1990, Bouma et al. 1979, Bullock and Thomasson 1979). The objective of this study was to evaluate the ability of the 2-D micromorphologic image analysis in measuring the behavior of damaged SPS of weathered soils (Oxisols and Nitosols) with low clay activity from Brazil, through evaluations of PSD and pore shape changes, when these soils are submitted to sequences of W-D cycles.
MATERIALS AND METHODS
Soil core samples were collected from the surface layer of three soils characterized as Geric Ferralsol (GF), Eu-tric Nitosol (EN), and Rhodic Ferralsol (RF) (Table I) (FAO soil classification 1998). The experimental area is located in Piracicaba, SP, Brazil (22◦4′S; 47◦38′W; 580 m above sea level).
Twenty-seven samples, nine from each soil, were collected at the soil surface layer (3–7 cm depth) with
aluminum cylinders (h = 3.0 cm, D = 4.8 cm, V = 55 cm3). According to the classical sampling procedure,
the cylinders were introduced into the soil by the weight of a rubber mass falling from a given height. The ex-tracted cylinders were completely filled with the soil and the excessive soil was carefully trimmed off each volu-metric ring so that the volume of the ring was completely filled with the soil and the top and bottom surfaces of the sample were flat assuring that the soil volume could be taken as the cylinder volume.
To impose W-D cycles on the collected samples the capillary rise method was chosen to saturate them (Klute 1986). Twenty-four hours was found to be the neces-sary time interval to saturate the samples and to avoid entrapped air bubbles inside them. After saturated the samples were dried by submitting them to a pressure of 400 kPa in a pressure chamber (Klute 1986). These two steps consisted in a W-D cycle.
Three different treatments were investigated: 0WD, the control treatment, in which samples were not submit-ted to any W-D cycle; 3WD, samples submitsubmit-ted to 3 W-D cycles, and 9WD, samples submitted to 9 W-D cycles.
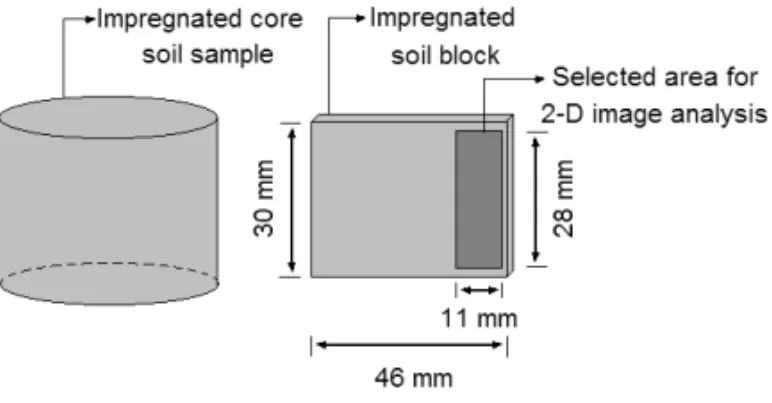
For image analysis nine samples of each soil were used and for each treatment three samples were selected for impregnation with resin. From the impregnated sam-ples two vertical slices (4.6×3.0 cm) were cut (Murphy 1986) and a small area (2.8×1.1 cm2), located next to the border of the samples, was selected for 2-D image analysis procedures (Fig. 1).
Fig. 1 – Schematic diagram of the soil block (4.6×3.0 cm2) used for 2-D micromorphologic image analysis.
TABLE I
Physical and chemical characteristics of the 0–0.10 m layer for the experimental soils.
Soil
Characteristic Geric Ferralsol Eutric Nitosol Rhodic Ferralsol
(GF) (EN) (RF)
Sand (%) 66 24 15
Clay (%) 28 43 56
Silt (%) 6 33 29
Dry Bulk density (Mg.m–3) 1.53 1.61 1.34
Particle density (Mg.m–3) 2.55 2.68 2.54
Organic matter (g.dm–3) 16.0 20.2 27.0
pH (in CaCl2) 3.9 5.3 4.9
Ca (mmolc.kg–1) 13.0 29.0 27.0
K (mmolc.kg–1) 2.6 4.3 3.4
Mg (mmolc.kg–1) 4.0 20.0 15.0
Pore area(φ)of the selected soil samples was eval-uated dividing the total void space area of the selected cross-section by the total area of the field under analy-sis, expressed as a percentage. Measured values ofφ in general underestimate the volumetric total porosity. During the analysis pores were separated according to their shape and size. Soil pores were divided into three shape classes (rounded, elongated, and irregular) char-acterized using two indexes and thresholds (Lima et al. 2006, Cooper et al. 2005). Pores of each shape group were subdivided into three different size classes (20–50; 50–500; and>500µm).
The SAS software (SAS Institute 1996) was used for data processing. Normality tests were performed on the data prior to their statistical processing. An analysis of variance (ANOVA) and the Duncan test(α =0.05) were performed to analyze statistical differences and to discriminate means.
RESULTS AND DISCUSSION
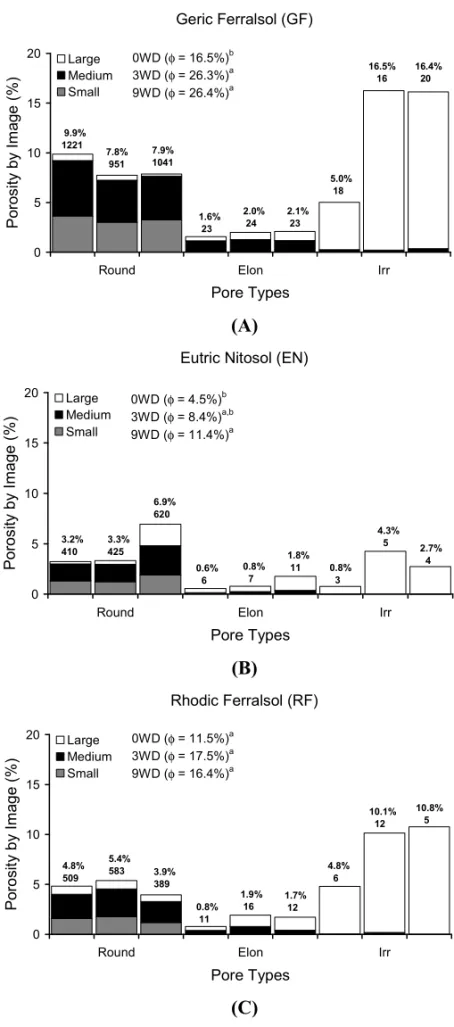
Pore shape presented important changes due to W-D cy-cles and they induced changes in SPS (Figs. 2A to 2C). For the GF soil (Fig. 2A), the W-D cycles promoted a de-crease in the number of rounded pores, a slight inde-crease in the elongated ones, and a significant increase in the irregular pores. For the control samples (0WD), theφ composition was: rounded pores 60%, irregular pores
31%, and elongated ones 9%, indicating that the 3WD and 9WD treatments, showed remarkable differences in relation to 0WD. Nevertheless, 3WD and 9WD did not presented substantial differences regarding to their pore shape. As an example of the mentioned changes, irreg-ular pores, that were initially responsible for 31% ofφ for 0WD, after 9W-D cycles represented 62% ofφ.
For the EN soil (Fig. 2B), with exception to irreg-ular pores, the 3WD presented the most significant mod-ifications, mainly in the rounded pores. A possible ex-planation for this result can be the small number of re-plicates for 3WD (only 2 rere-plicates) as compared to the other treatments (6 replicates). This small number of replicates for the 3WD treatment was due to problems during soil impregnation with resin. Comparing 0WD samples to those submitted to 9 W-D cycles, the increase factor for rounded, elongated, and irregular pores was 2.2, 3.2, and 3.6, respectively. Although representing only 15% ofφafter 9 W-D cycles, the high increase fac-tor observed for elongated pores (3.2) shows that W-D cycles improved the EN soil from the agronomic point of view, as also observed by Sartori et al. (1985).
Geric Ferralsol (GF) 0 5 10 15 20
Round Elon Irr
Pore Types P o ro s it y b y I m a g e ( % ) Large Medium Small 9.9% 1221 1.6% 23 5.0% 18 7.8% 951 2.0% 24 16.5% 16 7.9% 1041 2.1% 23 16.4% 20 0WD (φ = 16.5%)b
3WD (φ = 26.3%)a 9WD (φ = 26.4%)a
(A)
Eutric Nitosol (EN)
0 5 10 15 20
Round Elon Irr
Pore Types P o ro s it y b y I m a g e ( % ) Large Medium Small 3.2% 410 0.6% 6 0.8% 3 3.3% 425 0.8% 7 4.3% 5 6.9% 620 1.8% 11 2.7% 4 0WD (φ = 4.5%)b
3WD (φ = 8.4%)a,b 9WD (φ = 11.4%)a
(B)
Rhodic Ferralsol (RF)
0 5 10 15 20
Round Elon Irr
Pore Types P o ro s it y b y I m a g e (% ) Large Medium Small 4.8% 509 0.8% 11 4.8% 6 5.4% 583 1.9% 16 10.1% 12 3.9% 389 1.7% 12 10.8% 5 0WD (φ = 11.5%)a
3WD (φ = 17.5%)a 9WD (φ = 16.4%)a
(C)
treatments. The percentage inφdue to irregular pores changed from 42% to 66% after 9 W-D cycles. For the RF soil, both rounded and irregular pores are the main pores present in the impregnated analyzed blocks for 0WD. Nevertheless, it was observed that the number of the irregular pores increased enormously after the se-quences of W-D cycles for this soil.
The results for the GF and RF soils show that few sequences of W-D cycles can cause strong modifications on SPS of damaged (compacted) samples. On the other hand, W-D cycles did not promote any great change in any particular class of pore of EN samples. A constant increase inφdue to the W-D cycles was only observed for this soil. Pillai-McGarry and Collis George (1990) working with puddled and non-puddled soils found that a minimum of 3 W-D cycles caused significant changes in soil structure; however, in another study, Pillai-Mc-Garry (1991) showed that more than 3 W-D cycles were needed to regenerate the original structure of the topsoil layer of a Vertisol. Rajaram and Erbach (1999) indi-cated that only one cycle of W-D changed several prop-erties (cone penetration resistance, soil cohesion, aggre-gate size) of a clay loam soil. The results presented by these authors indicated that there is no detailed infor-mation about the number of cycles needed to cause any significant change in SPS.
Pillai-McGarry (1991) investigating Vertisols sug-gested that W-D cycles represent an important process in soil structuring. Sarmah et al. (1996) found an increase in water infiltration and a reduction in shear strength due to low to moderate changes in soil structure of samples after repeated W-D cycles. Pardini et al. (1996) also in-dicated possible variations of surface roughness, poros-ity, and pore size distribution during W-D cycles. They found after three W-D cycles an increase in soil porosity induced by the formation of big cracks and fissures. The presence of cracks was not observed in our soil samples, although W-D cycles could promote the formation of microfissures. However, our studied soils are not com-posed by swelling clays that present large content of smectite clay minerals (Hussein and Adey 1998). Gen-erally this kind of behavior occurs in some clayey soils in which it is common to observe soil cracks or fissures (Chertkov and Ravina 2000).
Despite numerous studies about the effect of
W-D cycles in soil structure of swelling soils like Verti-sols, there are only a few reports about the influence of these cycles on the structure of tropical not swelling soils. Viana et al. (2004) conducted an experiment to investigate the structural modifications engendered by W-D cycles in Brazilian Latosols (Oxisols) with differ-ent mineralogical properties. They observed that after W-D cycles important alterations occurred in both soil shape and structural pattern, which were attributed to a re-organization of soil particles during the plasma shrink-age after drying process. Oliveira et al. (2005) also re-ported the influence of W-D cycles on the structure of Brazilian Latosols and they reported that there is a close interdependence among mineralogical composition, ag-gregate stability, and water-dispersible clay influenced by the cycles.
Soils of reduced aggregate stability with kaolinitic mineralogy are more susceptible to the action of W-D on the water-dispersible clay. Soil mineralogy has a substantial effect on aggregate stability and dispersion, being the smectitic soils the most dispersive and kaolin-itic ones the least. The dispersivity of illkaolin-itic soils is intermediate, but may sometimes exceed that of smec-titic soils. In soils dominated by 2:1 clays (Vertisols), the aggregate stability is affected mainly by polyvalent metal-organic matter complexes that form bridges be-tween the negatively charged clay platelets. In 1:1 clay-dominated soils, the stability is attributed to the bind-ing capacity of the minerals themselves (Wakindiki and Ben-Hur 2002). Unfortunately as we did not carry out mineralogical composition analysis in our work it is impossible to compare our results with those obtained by Viana et al. (2004) and Oliveira et al. (2005) for the GF soil and the RF soil (both Latosols). In the world it is also possible to find some scientific literature about the effect of W-D cycles on the structure of not swelling soils in which the authors describe that important changes in SPS occurs after sequences of soil hydration and dehy-dration (Augeard et al. 2008, Bresson and Moran 2004, Li et al. 2004, Attou and Bruand 1998, Bresson and Moran 1995).
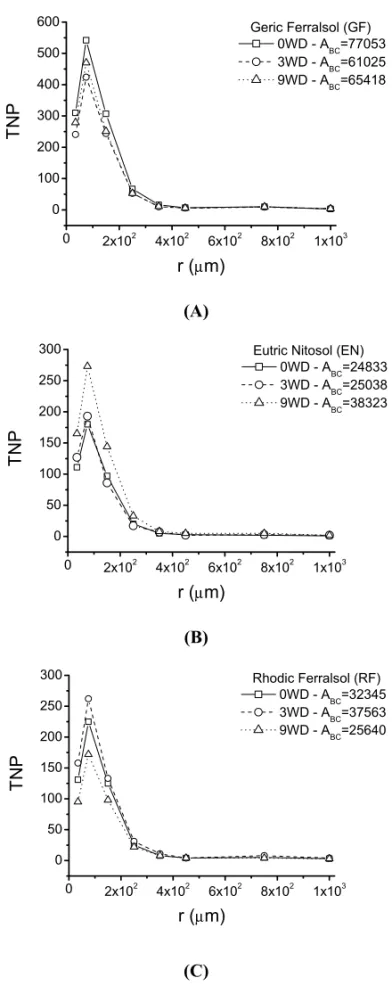
due to an increase in the area of soil macropores (Pires et al. 2005). For the 3WD treatment, only the few irreg-ular large pores contributed substantially to the observed changes inφ. W-D cycles caused changes in TNP mainly due to decreases in the number of small pores (35, 75, and 150µm) (Fig. 3A). However, TNP was not substan-tially modified in relation to large pores (from 250 to 1000µm) This confirms that the observed increase inφ among treatments probably occurred due to an increase in the area of soil macropores. Pardini et al. (1996) also reported increases in soil porosity of clayey soils due to the raising of the number of pores and also to the forma-tion of cracks and fissures in the structure. The reducforma-tion of the contribution of rounded pores to φ can be ex-plained by the reduction of TNP among treatments.
For the EN soil (Fig. 2B), the W-D cycles raised the number of rounded and elongated pores. This caused a constant growth in TNP and also increased the contri-bution of these pores toφamong treatments. In relation to small pores (35, 75, and 150µm) the EN soil presented an opposite behavior in relation to those noticed for the GF soil (Fig. 3B). Nevertheless, the application of W-D cycles did not result in substantial differences related to larger pores (250 to 1000µm). The constant mentioned increase in TNP for different treatments is confirmed by analyzing the areas below the curve (ABC) of the
plot shown in Figure 3B.
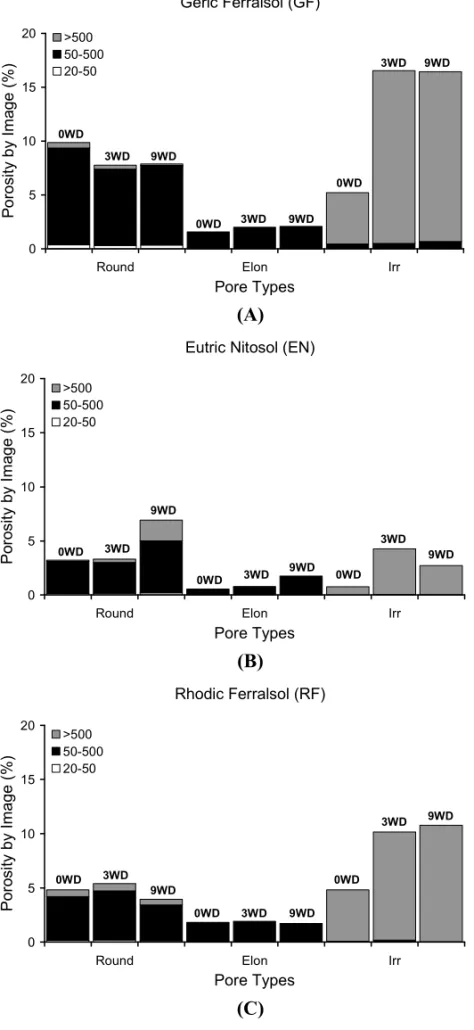
For the RF soil (Fig. 2C), a decrease in the total number of rounded pores was observed between 0WD and 9WD treatments and also the maintenance of the number of elongated and irregular pores (except for 3WD). Probably the observed changes in φ were due to the increase of the area of large macropores for 9WD (Pires et al. 2005). Figure 3C shows that this soil pre-sented an increase in TNP for smaller pores (35, 75, and 150µm) for 3WD and a decrease for 9WD in relation to 0WD. As compared to the other soils, the TNP of large pores (from 250 to 1000µm) for this soil was not subs-tantially affected by the W-D cycles. This confirms that the changes inφare related to the increase of the area of this type of pores after the application of W-D cycles. The W-D cycles produced important changes in PSD for the GF soil samples (Fig. 4A). There was a great variation in TNP of irregular pores larger than 500µm and rounded pores with radii between 50 and 500 µm.
0 2x10² 4x10² 6x10² 8x10² 1x10³ 0
100 200 300 400 500 600
T
N
P
r (µm)
Geric Ferralsol (GF) 0WD - ABC=77053 3WD - ABC=61025 9WD - ABC=65418
0 2x10² 4x10² 6x10² 8x10² 1x10³ 0
50 100 150 200 250 300
T
N
P
r (µm)
Eutric Nitosol (EN) 0WD - ABC=24833 3WD - ABC=25038 9WD - ABC=38323
0 2x10² 4x10² 6x10² 8x10² 1x10³ 0
50 100 150 200 250 300
T
N
P
r (µm)
Rhodic Ferralsol (RF) 0WD - ABC=32345
3WD - ABC=37563
9WD - ABC=25640
Fig. 3 – Changes in total number of pores (TNP) for different pore radii with repetitions of wetting and drying (W-D) cycles. ABCrepresents
the calculated area below the curve R
Geric Ferralsol (GF)
0 5 10 15 20
Round Elon Irr
Pore Types
P
o
ro
s
it
y
b
y
I
m
a
g
e
(%
)
>500 50-500 20-50
3WD
3WD
3WD
0WD
0WD
0WD 9WD
9WD
9WD
(A)
Eutric Nitosol (EN)
0 5 10 15 20
Round Elon Irr
Pore Types
P
o
ro
s
it
y
b
y
I
m
a
g
e
(
%
)
>500 50-500 20-50
3WD
3WD
3WD 0WD
0WD 9WD
9WD
9WD
0WD
(B)
Rhodic Ferralsol (RF)
0 5 10 15 20
Round Elon Irr
Pore Types
P
o
ro
s
it
y
b
y
I
m
a
g
e
(
%
)
>500 50-500 20-50
3WD
3WD
3WD
0WD
0WD
0WD 9WD
9WD
9WD
(C)
Contributions to φ due to rounded pores with radii between 20 and 1000µm decreased from 59% (0WD) to 30% (9WD), and due to irregular ones passed from 31% (0WD) to 62% (9WD). Several authors have shown ifications in SPS as a consequence of soil structure mod-ifications resulting of natural soil processes or anthro-pogenic actions (Zund et al. 1997, Pillai and McGarry 1999, Bresson and Moran 2003, Kutílek et al. 2006).
For the EN soil (Fig. 4B), the percentage ofφ re-lated to rounded pores with radii varying from 20 to 500µm was reduced from 68% (0WD) to 44% (9WD), a different behavior as compared to the GF soil. The main contribution toφfor the 3WD treatment was due to the irregular pores larger than 500 µm (51%). For 9WD, 17% of φ is related to rounded pores larger than 500 µm. Another important result for this soil was the increase factor of about 3.2 in the contribution of elongated transmission pores (50–300 µm) toφ be-tween 0WD and 9WD treatments. Changes in all classes and types of pores among treatments indicate some soil structure remediation with the sequences of W-D cycles. The results for the RF soil (Fig. 4C) indicate that contributions of irregular pores larger than 500 µm to φ varied from 41% (0WD) to 65% after 9 W-D cy-cles. A slight decrease from 16 to 10% in the contribu-tion of elongated transmission pores (50–400µm) toφ was observed. Also, after 9 W-D cycles a decrease of rounded pores (from 42% to 24%) was observed for RF soil samples. An increase in φ due to the raising of the number of pores larger than 500µm confirms that W-D cycle repetitions reduced the damaged areas for this type of soil.
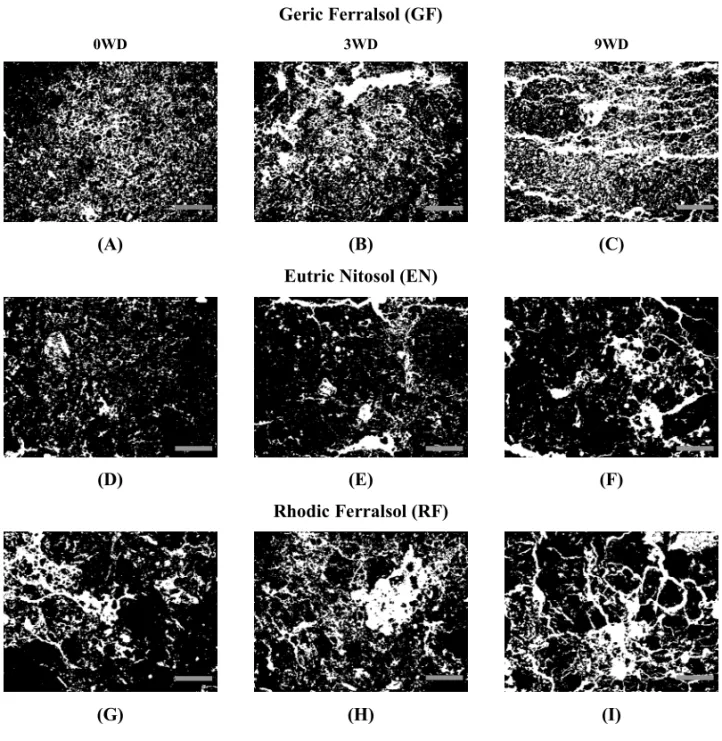
Figure 5 illustrates the changes in pore morphol-ogy for all soils submitted to W-D cycles. The objective of showing these 2-D micromorphologic images is to give an insight on the effects of W-D cycles on dam-aged SPS.
In conclusion it can be said that there were remark-able differences between compacted SPS of 0WD and those submitted to sequences of W-D cycles, for all soils. For all soil samples an evolution from massive structures (Figs. 5A, 5D and 5G) to structures with a great number of large and connected pores after W-D cycles could be noticed. A progressive increase in φ as the soil structure changed from massive, in plowed
(disturbed) soils, to complex crumb, block, and platy af-ter repeated W-D cycles was also reported by Hussein and Adey (1998). Pagliai et al. (1987) and Sartori et al. (1985), also demonstrating important modifications on the structure for different soil textures after sequences of W-D cycles. Viana et al. (2004) working with Brazilian Latosols showed similar results like those obtained by us for the GF soil and the RF soil after the application of W-D cycles. The hydration and dehydration produces cycles of contraction and retraction of the clay parti-cles and aggregates in a soil affecting its pore distribu-tions. Aggregation by contraction promoted by gravita-tional forces produces large, irregularly distributed pores which in later stages of development are separated by connected pores as observed by Li et al. (2004).
During wetting and subsequent drying some soil physical properties may change by mechanical factors affecting the total porosity, stress state and energy state (Baumgartl 1998). The wetting and drying processes, in general, result in small alterations in total volume of the core sample (Pires et al. 2005), caused by stresses due to water/air interfaces originated from capillary forces, which increase with soil drainage. As a consequence, after each re-wetting process the soil structure will un-dergo modifications achieving a new state of energy, which most of the time promotes definitive changes in soil structure like the formation of connected soil pores (Viana et al. 2004).
0WD
(A)
Geric Ferralsol (GF) 3WD
(B)
9WD
(C)
(D)
Eutric Nitosol (EN)
(E) (F)
(G)
Rhodic Ferralsol (RF)
(H) (I)
Fig. 5 – Binary images (pores appear in white and the soil matrix in black) representing the variations on the soil pore system (SPS) of damaged samples with repetitions of wetting and drying (W-D) cycles. Lines at the right corner of the images represent the scale(1000µm).
ACKNOWLEDGMENTS
To Fundação Araucária (Grants no. 10193 and 10195), Fundo Paraná/SETI, Estado do Governo do Paraná and to Conselho Nacional de Desenvolvimento Científico e Tecnológico (CNPq) for financial support.
RESUMO
A caracterização da estrutura do solo usando a análise de imagens bidimensionais (2-D) constitui um método simples na obtenção de informações essenciais relacionadas com a po-rosidade do solo e a distribuição do tamanho de poros. Tal
dife-rentes tratamentos: 0WD, amostras controle não submetidas a nenhum ciclo de W-D; 3WD e 9WD, amostras submetidas a 3 e 9 ciclos consecutivos de W-D, respectivamente. Foi observado que os ciclos de W-D produziram mudanças significativas nos poros grandes irregulares dos solos LVAd e LVd e nos poros arredondados do NVe. Importantes mudanças nos poros de 35 até 150µm foram observadas para todos os solos estudados. A partir dos resultados obtidos pode ser dito que o uso da análise de imagens auxiliou com sucesso na explicação de variações no sistema poroso (formato, número e distribuição de tamanho dos poros) devido aos ciclos de W-D para todos os solos ana-lisados.
Palavras-chave: densidade do solo, umidade do solo, poro-sidade do solo, micromorfologia, estrutura do solo, compac-tação.
REFERENCES
ATTOU F ANDBRUAND A. 1998. Experimental study of “fragipans” formation in soils. Role of both clay disper-sion and wetting-drying cycles. Earth Plan Sci 326: 545– 552.
AUGEARDB, BRESSONLM, ASSOULINES, KAOCAND
VAUCLINM. 2008. Dynamics of soil surface bulk den-sity: role of water table elevation and rainfall duration. Soil Sci Soc Am J 72: 412–423.
BAUMGARTLTH. 1998. Physical soil properties in specific fields of application especially in anthropogenic soils. Soil Till Res 47: 51–59.
BAVER LD, GARDNER WH AND GARDNER WR. 1972. Física de Suelos. México: UTHA.
BOUMAJ, JONGERIUSAANDSCHOONDERBEEKD. 1979. Calculation of saturated hydraulic conductivity of some pedal clay soils using micromorphometric data. Soil Sci Soc Am J 43: 261–264.
BRESSONLMANDMORAN CJ. 1995. Structural changes induced by wetting and drying in seedbeds of a hardset-ting soil with contrashardset-ting aggregate size distribution. Eur J Soil Sci 46: 205–214.
BRESSONLMANDMORANCJ. 2003. Role of compaction versus aggregate disruption on slumping and shrinking of repacked hardsetting seedbeds. Soil Sci 168: 585–594. BRESSONLMANDMORANCJ. 2004. Micromorphological
study of slumping in a hardsetting seedbed under various wetting conditions. Geoderma 118: 277–288.
BULLOCKPANDTHOMASSONAJ. 1979. Rothamsted stud-ies of soil structure. II. Measurement and characteriza-tion of macroporosity by image analysis and comparison
with data from water retention measurements. J Soil Sci 30: 391–413.
CHERTKOVVYANDRAVINAI. 2000. Shrinking-swelling
phenomenon of clay soils attributed to capillary-crack network. Theor Appl Fract Mech 34: 61–71.
COOPERM, VIDAL-TORRADOP ANDCHAPLOTV. 2005. Origin of microagregates in soils with Ferric horizons. Sci Agr 62: 256–263.
HORGANGW. 1998. Mathematical morphology for analyz-ing soil structure from images. Eur J Soil Sci 49: 161–173. HUSSEINJANDADEYMA. 1998. Changes in microstruc-ture, voids and b-fabric of surface samples of a Vertisol caused by wet/dry cycles. Geoderma 85: 63–82. JONGERIUSA, SCHOONDERBEEKDANDJAGERA. 1972.
The application of the Quantimet 720 in soil micromor-phometry. The Microscope 20: 243–254.
KLUTEA. 1986. Water retention: laboratory methods. In:
BLACKCA (Ed), Methods of soil analysis. I. Physical
and mineralogical methods. Soil Science Society Amer-ica Book Series: Madison, 635–662.
KUTÍLEK M, JENDELE L AND PANAYIOTOPOULOS KP. 2006. The influence of uniaxal compression upon pore size distribution in bi-modal soils. Soil Till Res 86: 27–37.
LI D, VELDE B AND ZHANG T. 2004. Observations of pores and aggregates during aggregation in some clay-rich agricultural soils as seen in 2D image analysis. Geo-derma 118: 191–207.
LIMA HV, SILVA AP, SANTOS MC, COOPER M AND
ROMERORE. 2006. Micromorphology and image
anal-ysis of a hardsetting Ultisol (Argissolo) in the state of Ceará (Brazil). Geoderma 132: 416–426.
MORAESSO, LIBARDIPLANDDOURADONETOD. 1993.
Problemas metodológicos na obtenção da curva de reten-ção da água pelo solo. Sci Agr 50: 383–392.
MURPHYCP. 1986. Thin section preparation of soils and sediments. Berkhamsted: Academic Publishers. MURPHYCP, BULLOCKP ANDTURNERRH. 1977a. The
measurement and characterization of voids in soil thin sections by image analysis: Part I. Principles and tech-niques. J Soil Sci 28: 498–508.
MURPHYCP, BULLOCKPANDBISWELLKJ. 1977b. The
measurement and characterization of voids in soil thin sections by image analysis: Part II. Aplications. J Soil Sci 28: 509–518.
OLIVEIRA TS, COSTA LM AND SCHAEFER CE. 2005. Water-dispersible clay after wetting and drying cycles in four Brazilian oxisols. Soil Till Res 83: 260–269. PAGLIAIM. 1987. Micromorphometric and
micromorpho-logical investigations on the effect of compaction by pressures and deformations resulting from tillage and wheel traffic. In: MONNIERG ANDGOSSMJ (Eds),
Soil compaction and regeneration. AA Balkema, Rotter-dam, p. 31–38.
PAGLIAI M, LAMARCA M AND LUCAMANTEG. 1987. Changes in soil porosity in remolded soils treated with poultry manure. Soil Sci 144: 128–140.
PARDINI G, VIGNA GUIDI G, PINI R, REGUÉS D AND
GALLARTF. 1996. Structure and porosity of smectitic mudrocks as affected by experimental wetting-drying cy-cles and freezing-thawing cycy-cles. Catena 27: 149–165. PILLAI-MCGARRYUPP. 1991. Regeneration of soil
struc-ture. Aust Cottongrower 11: 51–52.
PILLAI-MCGARRY UPP ANDCOLLIS-GEORGE N. 1990.
Laboratory simulation of the surface morphology self-muching and non self-mulching Vertisols. I. Materials, methods and preliminary results. Aust J Soil Res 28: 129–139.
PILLAIUPANDMCGARRYD. 1999. Structure repair of a compacted Vertisol with wet-dry cycles and crops. Soil Sci Soc Am J 63: 201–210.
PIRESLF, BACCHIOOSANDREICHARDTK. 2004. Dam-age to soil physical properties caused by soil sampler de-vices as assessed by gamma ray computed tomography. Austr J Soil Res 42: 857–863.
PIRESLF, BACCHIOOSANDREICHARDTK. 2005. Gam-ma ray computed tomography to evaluate wetting/drying soil structure changes. Nucl Instr Meth Phys Res B 42: 857–863.
RAJARAMGANDERBACHDC. 1999. Effect of wetting and drying on soil physical properties. J Terramechanics 36: 39–49.
RINGROSE-VOASEAJ. 1990. One-dimensional image
analy-sis of soil structure. I. Principles. J Soil Sci 41: 499–512. SARMAH AK, PILLAI-MCGARRY U AND MCGARRY D. 1996. Repair of the structure of a compacted Vertisol via wet/dry cycles. Soil Till Res 38: 17–33.
SARTORIG, FERRARIGAANDPAGLIAIM. 1985. Changes in soil porosity and surface shrinkage in a remolded, saline clay soil treated with compost. Soil Sci 139: 523–530. SAS INSTITUTE. 1996. System for Information. Version
6.11. Cary, SAS Institute Inc., 1996.
TELFAIR D, GARDNER MR AND MIARS D. 1957. The
restoration of a structurally degenerated soil. Soil Sci Soc Am J 21: 131–134.
THOMPSON ML, SINGH P, CORAK S ANDSTRASZHEIM
WE. 1992. Cautionary notes for the automated analysis of soil pore-space images. Geoderma 53: 399–415. VIANA JHM, FERNANDES FILHO EI AND SCHAEFER
CEGR. 2004. Efeitos de ciclos de umedecimento e seca-gem na reorganização da estrutura microgranular de latos-solos. R Bras Ci Solo 28: 11–19.
WAKINDIKI IIC AND BEN-HURM. 2002. Soil Mineral-ogy and texture effects on crust micromorpholMineral-ogy, infil-tration, and erosion. Soil Sci Soc Am J 66: 897–905. ZUNDPR, PILLAI-MCGARRYU, MCGARRYDANDBRAY
SG. 1997. Repair of a compacted Oxisol by the earthworm
pontoscolex corethrurus(Glossoscolecidae, Oligochaeta).