Methods of selecting common bean lines having high yield, early cycle
and erect growth
1Métodos de seleção de linhagens de feijão com alta produtividade, ciclo precoce e
arquitetura ereta
Evandro Jost2, Nerinéia Dalfollo Ribeiro3*, Daniele Piano Rosa2, Micheli Thaise Della Flora Possobom2 e Sandra
Maria Maziero2
ABSTRACT -Selection for grain yield, combined with phenological and morphological characteristics of agricultural interest, represents technological advances in the common bean. The objectives of this work were to estimate genetic parameters and the efficiency of both the Pedigree and Single-Seed Descent (SSD) methods for progression segregating populations in order to obtain common bean lines superior in grain yield, precocity and plant architecture. To do this, 136 inbred lines obtained using the Pedigree method, and 136 inbred lines obtained by SSD method were evaluated in a 17 x 17 simple lattice design, integrating the 272 inbred lines in the F7 generation and 17 cultivars as control. Estimates of moderate narrow sense heritability were obtained for grain yield, lodging and insertion of the first pod. The cycle and general adaptation note showed low heritability for the F7 generation. The Pedigree method allows obtaining a greater number of lines of high grain yield, early cycle and a lower general adaptation note (best adaptability). Selection using the Single-Seed Descent method allows the identification of a larger number of lines with lower notes for lodging and higher insertion of the first pod.
Key words: Common bean-genetic breeding. Plant-population. Variance analysis.
RESUMO - A seleção para a produtividade de grãos, combinada com caracteres fenológicos e morfológicos de interesse agrícola, representa avanços tecnológicos para o feijão. Os objetivos desse trabalho foram avaliar parâmetros genéticos e a eficiência dos métodos de condução de populações segregantes Genealógico e Descendência de uma Única Semente (SSD) na obtenção de linhagens de feijão superiores para a produtividade de grãos, a precocidade e a arquitetura de plantas. Para tanto, foram avaliadas 136 linhagens obtidas pelo método Genealógico e 136 linhagens obtidas pelo método SSD em delineamento látice simples 17 x 17, integrando as 272 linhagens em geração F7 e as 17 cultivares testemunhas. Estimativas de herdabilidade em sentido restrito moderada foram obtidas para a produtividade de grãos, o acamamento e a altura de inserção da primeira vagem. O ciclo e a nota geral de adaptação apresentaram herdabilidade baixa em geração F7.O método Genealógico permite a obtenção de maior número de linhagens com alta produtividade de grãos, de ciclo precoce e de menor nota geral de adaptação (melhor adaptação). A seleção pelo método Descendência de uma Única Semente possibilita a identificação de maior número de linhagens com menores notas de acamamento e com maior altura de inserção da primeira vagem.
Palavras-chave: Feijão-melhoramento genético. Planta-populações. Análise de variância.
*Autor para correspondência
1Recebido para publicação em 19/09/2011; aprovado em 04/10/2013
Parte da Tese de Doutorado do primeiro autor apresentada à Universidade Federal de Santa Maria/UFSM
2Programa de Pós-Graduação em Agronomia da UFSM, Santa Maria-RS, Brasil, [email protected], [email protected], [email protected], [email protected]
INTRODUCTION
Increasing grain yield is still a major challenge in
the genetic improvement of the common bean (Phaseolus
vulgaris L.), and has thus received greater emphasis in
recent years (CABRALet al., 2011). The result is that
average genetic gains ranging from 0.88 to 1.07% have been observed for grain yield in the common bean (CHIORATO
et al., 2010; RIBEIRO; POSSEBON; STORCK, 2003).
Genetic variability has allowed both the selection in different breeding programs of those lines with phenotypic superiority (COSTA; RAVA; ZIMMERMANN, 2002; TORGAet al., 2010) and the registration of new cultivars
in the National Register of Cultivars of the Ministry of Agriculture, Livestock and Supply.
Phenological characteristics, such as cycle, and morphological characteristics, such as lodging, insertion of the first pod and general adaptation note, are also important in the selection of common bean lines. The identification of those cultivars having an early cycle, allows the planning of harvests for periods of less rain, the reduction of water consumption by irrigated crops, and the earlier freeing of the area for crop succession (BURATTO
et al., 2007). Plants with a higher insertion of the first pod,
erect growth and less lodging, facilitate mechanical and manual harvesting and other cultural practices (MENDES; RAMALHO, ABREU, 2009). The general adaptation note has been used in indirect selection to rule out markedly inferior lines, since it presents a negative linear correlation with grain yield (RIBEIROet al., 2010).
The main methods of progression segregating populations used in the genetic improvement of the common bean are Bulk, Pedigree and Single-Seed Descent (SSD). Progression of segregating populations in the common bean using the Pedigree method has been effective in the selection of lines with higher grain yield
(MORETOet al., 2007; TORGAet al., 2010). However,
it contributed to the production of less erect plants
(MORETOet al., 2007) and was not associated with the
types of grain having a greater acceptance for consumption
(TORGAet al., 2010). The SSD method made it possible
to obtain earlier lines, but grain yield was lower when compared to those lines obtained under the Pedigree and Bulk methods (URREA; SINGH, 1994). The progression segregating populations by the SSD method, allows for the maximum genetic variance among lines, and is easily carried out. However, few evaluations are performed in the field, and this can contribute to obtainment a greater number of lines of lower grain yield.
Costa, Rava and Zimmermann (2002) observed that the methods for progression segregating populations differed in the identification of common bean lines with high grain yield and resistance to four pathotypes of
Colletotrichum lindemuthianum. According to Borém
and Vieira (2009), there is no single method of achieving specific goals, and the choice of which selection method should be used depends on genetic characteristics, ease of progression, time, labour and necessary costs. The objectives of this study therefore, were to evaluate the genetic parameters and the efficiency of the Pedigree and SSD methods of progression segregating populations in order to obtain common bean lines which are superior in grain yield, early maturation and plant architecture.
MATERIAL AND METHODS
In the study, 272 inbred lines in F7 generation were used, obtained by Jostet al. (2009a) and Jostet al. (2009b),
from crosses of the common bean cultivarsPérola withTPS Bonito andTPS Bonito withBRS Expedito (block 1), and of Minuano withDiamante Negro andDiamante Negro with IAPAR 44 (block 2). All the cultivars are from the Middle
American gene pool, with thePérola andTPS Bonito cultivars
being from the carioca-type commercial group, having
beige-coloured seeds with brown streaks and exhibiting an indeterminate growth habit with long guides (type III). The other cultivars belong to the black commercial group, having an indeterminate growth habit, with the Minuano cultivar
having long guides (type III) and theBRS Expedito,Diamante Negro andIAPAR 44, having short guides (type II).
Crossings were carried out in a greenhouse, adopting the interlacing method with prior emasculation of the flower bud (PETERNELLI; BORÉM; CARNEIRO, 2009). In the autumn and winter of 2006, the F1 and F1 reciprocal generations were obtained; in the spring and summer of 2006, the F2 and F2 reciprocal generations; and in the autumn and winter of 2007, the F3 and F3 reciprocal generations.
The segregating populations from cross-breeding block 1 (crosses of Pérola with TPS Bonito, and of TPS Bonito withBRS Expedito) were advanced using the Pedigree
and Single-Seed Descent (SSD) methods. For the Pedigree method, the test began in the normal rainy season of 2007/2008, with seeds being sown in plots of one line, two metres long, with a total of approximately 10 plants. When harvested, the plants were individually labelled in order to assess grain yield. After obtaining the grain yield per plant, the grain yield per line (family) was calculated. In the selection process, the 20 most productive lines (families) were selected (from a total of 68 lines) and, from these lines, three or four plants with the highest individual grain yield were selected, giving a total of sixty-eight F3 plants. The seeds of each plant selected were identified and individually stored in paper bags.
the same system of sowing and the same criteria for selection, with sixty-eight F4 plants being selected. In the dry season of 2009, the process was repeated and
sixty-eight F5 plants were selected. In the winter of
2009, another generation of sixty-eight F6 lines were advanced in the greenhouse (F7 seeds).
The SSD method was carried out in a greenhouse, with the F3 and F4 generations being obtained in 2008, and the F5 and F6 generations in 2009. For each generation, one seed was harvested per plant to be seeded for the next generation. A total of one hundred F3 plants were advanced, with the aim of getting sixty-eight F6 plants (F6 lines). A larger number of plants were used in the beginning in order to circumvent any potential losses due to a lack of germination, or to death by disease or insect attack, which could occur as the progression of the generations. In the summer of 2009, seeds from each F6 plant were individually harvested at maturity, and the seeds for sixty-eight F7lines were thus obtained. Cultivation was carried out in plastic pots each holding 5 L of a mixture of soil, the Plantmax® commercial substrate and carbonized rice husks, in a 2:1:1 ratio according to volume. The soil used was a typical alitic Argisol Hapludalf, having the following chemical composition: pH (H20): 5.5; organic matter 2.2%; phosphorus: 6.8 mg dm-3; potassium: 68 mg dm-3; calcium: 5.5 cmolc dm-3; magnesium: 2.7 cmol
c dm-3. Correction for soil fertility was carried out for those minerals in the soil considered as limiting. Daily irrigation, and disease and insect control were performed whenever necessary to ensure the normal development of the common bean plants.
The populations obtained with cross-breeding
block 2 (crosses ofMinuano withDiamante Negro, and
ofDiamante Negro withIAPAR 44 ), were also advanced
using both the Pedigree and Single-Seed Descent (SSD) methods, in a similar way to the procedure described for the populations obtained with cross-breeding block 1. In this case, seeds were also selected for sixty-eight F7 lines by the Pedigree method and for sixty-eight F7 lines by the SSD method, giving a total of 136 lines.
The 272 F7lines obtained (136 from cross-breeding block 1 and 136 from cross-breeding block 2) together with 17 control cultivars were evaluated in the normal rainy season of 2009/2010, using a 17 x 17 simple lattice design. As control were the six parent cultivars (Pérola, TPS Bonito,BRS Expedito,Minuano,Diamante Negro and IAPAR 44) and eleven cultivars registered for cultivation
in the Rio Grande do Sul state, Brazil (TPS Nobre,BRS Campeiro, FEPAGRO 26, Carioca, Macotaço, Iraí, Macanudo, Guapo Brilhante, Rio Tibagi, BRS Supremo
andBRS Valente) (MINISTÉRIO DA AGRICULTURA,
PECUÁRIA E ABASTECIMENTO, 2010). Each plot consisted of two rows of 15 seeds, 1 m in length.
All the field experiments were carried out at the experimental area of the Bean Breeding Program of the
Department of Plant Science at the Federal University of Santa Maria. Santa Maria is located in the region of the central depression of Rio Grande do Sul state, at latitude 29°42’S and longitude 53°43’W and an altitude of 95 m. The climate in the region is of the Cfa type, rainy temperate, thermally subtropical, with rainfall being well distributed over the years. The soil is classified as a typical alitic Argisol, Hapludalf belonging to the Santa Maria mapping unit. The soil was prepared in a conventional manner, and fertilization was based on the interpretation of a chemical analysis of the soil. Control of insects and weeds was performed whenever necessary in order not to compromise development of the culture. Disease control was not carried out.
Plants were harvested when mature, threshed manually and the seeds dried in the sun and in a greenhouse (65-70 ºC) until reaching an average moisture content of 13%, when the grain yield in kg ha-1 was determined. The cycle was evaluated when a half plus one of the plants of a plot reached the R9 stage (maturity). Lodging was quantified at maturity by visual observation and by assigning notes ranging from 1 to 9, where note 1 corresponds to all the plants being upright, note 2 to a few fallen plants or all the plants slightly inclined to the side, note 3 to 25% fallen plants or all the plants inclined at around 25o, note 5 to 50% fallen plants or all the plants inclined at around 45o, note 7 to 75% fallen plants or all the plants inclined at around 65o, note 8 to few unfallen plants or nearly all touching the ground, and note 9 to all the plants fallen and touching the ground. The percentage of fallen plants, the degree of inclination and the percentage of plants in contact with the soil were estimated visually without the use of rulers or other equipment. The insertion of the first pod was measured in ten randomly collected plants per plot. The general adaptation note was determined at maturity based on a note scale ranging from 1 (excellent) to 9 (extremely bad) as described by Ribeiroet al. (2010).
The data obtained were subjected to hierarchical-model variance analysis in order to test the effects of the lines under each progression method of segregating populations. The efficiency of the simple lattice design (Ef), compared to randomised blocks was determined by equation 1.
(1) where: QMR is the mean square of the residual from the lattice analysis as randomised blocks and Vr is the effective mean variance of the lattice analysis.
The averages of the 5, 10 and 20 superior lines, under both the Pedigree and SSD methods, were based on absolute values, with a ranking of the lines by method being initially carried out for each characteristic, with the mean of the best 5, 10 and 20 lines, classified as to characteristic, then being obtained. The Student t-test was run at 5% probability in order to compare the difference between the averages obtained for the different methods for each selection group. To identify the number of lines which were superior to each control, the number of lines that presented a mean absolute value superior to each of the controls was considered for each evaluated characteristic. The statistical analyses were run using the Office Excel and Genes computer software (CRUZ, 2006).
RESULTS AND DISCUSSION
The relative efficiency of the simple lattice design ranged from 103.92% (insertion of first pod) to 117.44% (general adaptation note) (Table 1). It was therefore decided to perform analysis following a randomised block design.
With variance analysis, a significant effect from line was found for each method of progression of the segregating populations in relation to grain yield, cycle, lodging, insertion of the first pod and the general adaptation note, indicating different responses of the common bean lines obtained under each method (Table 1). The existence of genetic variability among lines, regardless of the method, allows the selection of superior lines for both the Pedigree and SSD methods. In this case, presentation of the variance analysis for each selection method is appropriate (Table 2).
Variance between lines was significant for grain yield under each method of progression of segregating populations
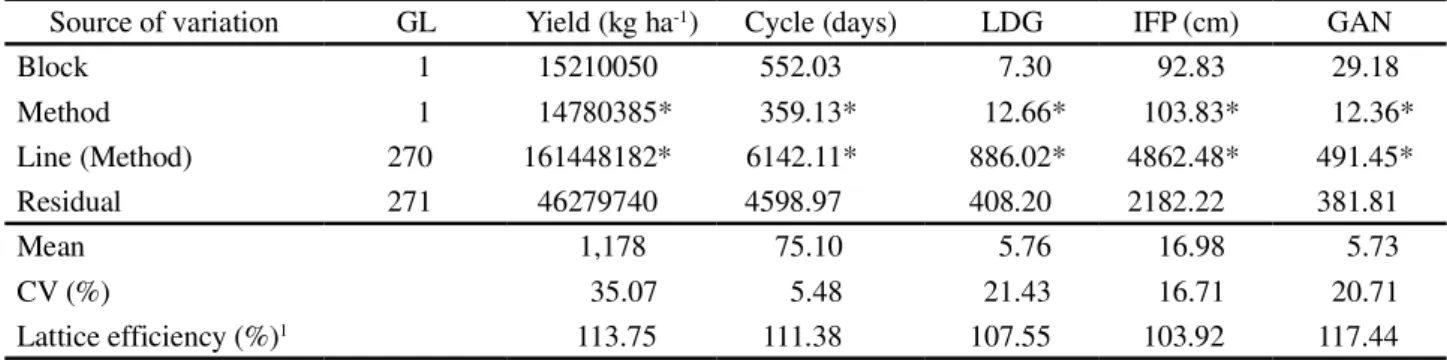
Table 1 - Variance analysis as a hierarchical model, considering a randomized block design, for grain yield (yield, kg ha-1), cycle (days),
lodging (LDG), insertion of first pod (IFP, cm) and general adaptation note (GAN) in the experimental evaluation of common bean lines obtained under the Pedigree and Single-Seed Descent methods
1Efficiency of the lattice design compared to the randomized block design. * Significant at 5% probability
Source of variation GL Yield (kg ha-1) Cycle (days) LDG IFP (cm) GAN
Block 1 15210050 552.03 7.30 92.83 29.18
Method 1 14780385* 359.13* 12.66* 103.83* 12.36*
Line (Method) 270 161448182* 6142.11* 886.02* 4862.48* 491.45*
Residual 271 46279740 4598.97 408.20 2182.22 381.81
Mean 1,178 75.10 5.76 16.98 5.73
CV (%) 35.07 5.48 21.43 16.71 20.71
Lattice efficiency (%)1 113.75 111.38 107.55 103.92 117.44
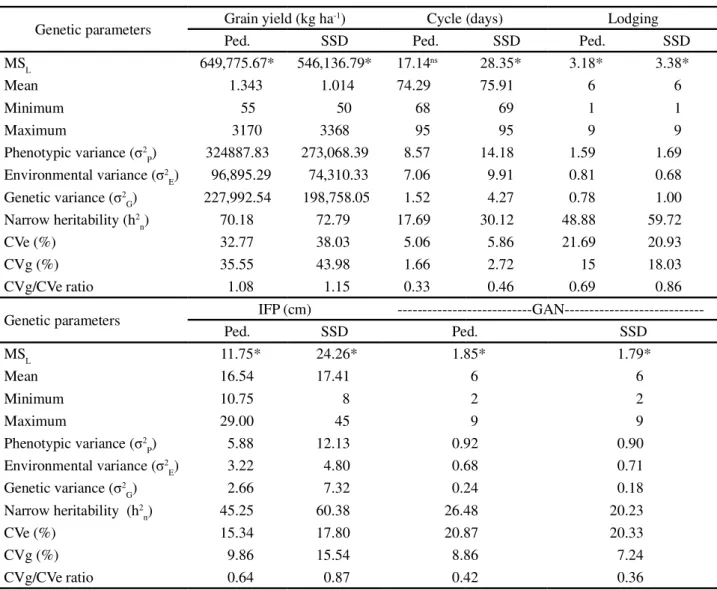
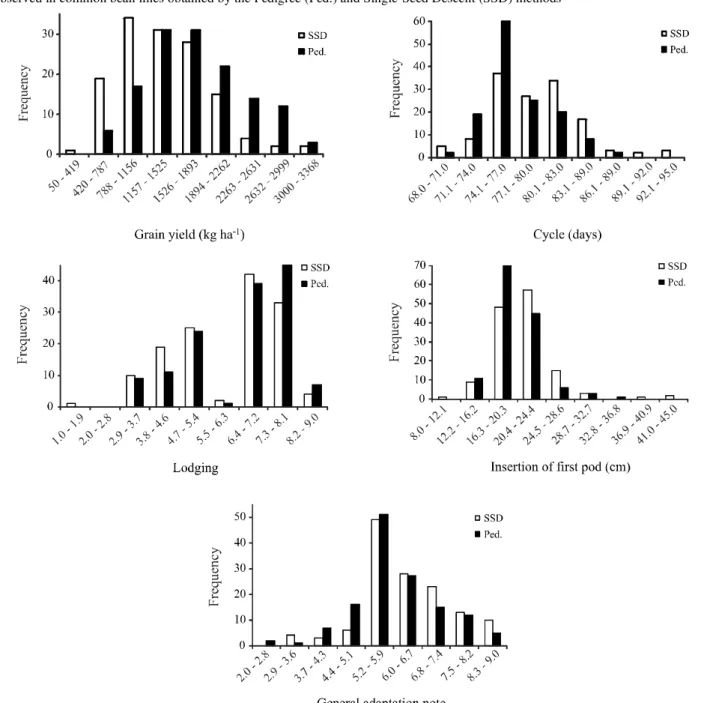
used (Table 2). The average grain yield of the lines obtained under the Pedigree method (1,343 kg ha-1) was higher than that obtained under the SSD method (1,014 kg ha-1) (Table 2). In addition, a greater frequency of those lines having a higher grain yield was recorded under the Pedigree method (Figure 1). Costa, Rava and Zimmermann (2002), evaluating F6 lines obtained from different crosses, also found that it was possible to select a larger number of lines with high yield under the Pedigree method. Therefore, the selection which began in the F2 generation, and was continued in each generation, was effective for selecting plants which were more adapted to the growing conditions.
Lines which were advanced under the SSD method showed a greater range of variation for grain yield of from 50 to 3,368 kg ha-1 (Table 2). Similar results were observed in common bean lines with a high level of endogamy, obtained under the SSD method (RAPOSO; RAMALHO; ABREU, 2000). Under this method, selection in the greenhouse was not carried out, therefore preserving the greater genetic variability obtained in F2 for advanced generations. A greater number of lines having low grain yield was thus maintained under the SSD method (Figure 1). In Colombia, the lowest values for grain yield were observed
in F9 common bean lines advanced under the SSD method
(URREA; SINGH, 1994).
Estimates for heritability were equal to 70.18% (Pedigree) and 72.79% (SSD) (Table 2), indicating that grain yield presented little non-controllable influence, thus providing favourable conditions to carry out selection. These estimates can be considered as high when compared to those usually reported for the
common bean (MORETO et al., 2007; RAMALHO,
SANTOS; ZIMMERMANN, 1993). When 100 F3:7
Table 2 - Estimates of the mean square of the lines (MSL), of the average, of the minimum and maximum value, of the phenotypic variance ( 2
P), of the environmental variance ( 2E), of the genetic variance ( 2G), of the narrow sense heritability (h2n), of the environmental
coefficient of variation (CVe%), of the genetic coefficient of variation (CVg) and of the CVg/CVe ratio, obtained for grain yield, cycle, lodging, insertion of first pod (IFP, cm) and general adaptation note (GAN) in the experimental evaluation of common bean lines obtained by the Pedigree (Ped) and Single-Seed Descent (SSD) methods
*Significant by the F-test at 5% probability. ns: not significant
Genetic parameters Grain yield (kg ha-1) Cycle (days) Lodging
Ped. SSD Ped. SSD Ped. SSD
MSL 649,775.67* 546,136.79* 17.14ns 28.35* 3.18* 3.38*
Mean 1.343 1.014 74.29 75.91 6 6
Minimum 55 50 68 69 1 1
Maximum 3170 3368 95 95 9 9
Phenotypic variance ( 2
P) 324887.83 273,068.39 8.57 14.18 1.59 1.69
Environmental variance ( 2
E) 96,895.29 74,310.33 7.06 9.91 0.81 0.68
Genetic variance ( 2
G) 227,992.54 198,758.05 1.52 4.27 0.78 1.00
Narrow heritability (h2
n) 70.18 72.79 17.69 30.12 48.88 59.72
CVe (%) 32.77 38.03 5.06 5.86 21.69 20.93
CVg (%) 35.55 43.98 1.66 2.72 15 18.03
CVg/CVe ratio 1.08 1.15 0.33 0.46 0.69 0.86
Genetic parameters IFP (cm)
---GAN---Ped. SSD Ped. SSD
MSL 11.75* 24.26* 1.85* 1.79*
Mean 16.54 17.41 6 6
Minimum 10.75 8 2 2
Maximum 29.00 45 9 9
Phenotypic variance ( 2
P) 5.88 12.13 0.92 0.90
Environmental variance ( 2
E) 3.22 4.80 0.68 0.71
Genetic variance ( 2
G) 2.66 7.32 0.24 0.18
Narrow heritability (h2
n) 45.25 60.38 26.48 20.23
CVe (%) 15.34 17.80 20.87 20.33
CVg (%) 9.86 15.54 8.86 7.24
CVg/CVe ratio 0.64 0.87 0.42 0.36
from 27.0 to 79.7% (TORGAet al., 2010). The greater
range observed for variation was justified by the authors as the effect of the family x environment interaction.
The environmental (CVe%) and genetic coefficients of variation (CVg%) for grain yield were high under the two methods of progression of segregating populations (Table 2). A similar value for the coefficient of experimental variation was observed in an experiment carried out in a 10 x 10 triple lattice design (TORGAet al., 2010). Despite low experimental
precision being obtained, both in the present work and in the work of Torgaet al. (2010 ), the greater number of lines being
evaluated allowed better exploitation of the genetic variance
released with the cross-breeding. A greater selection intensity could thus be applied, which is interesting in the preliminary assessment of a large number of lines as it contributes to increasing the genetic gain.
Many of the common bean cultivars being grown in Brazil have an intermediate cycle, i.e. the period from emergence to maturity lasts approximately 90 days
(ZIMMERMANNet al., 1996). Early maturing cultivars
Figure 1 - Frequency distribution of grain yield (kg ha-1), cycle (days), lodging, insertion of first pod (cm) and general adaptation note
observed in common bean lines obtained by the Pedigree (Ped.) and Single-Seed Descent (SSD) methods
E ABASTECIMENTO, 2010). In the present study, the cycle ranged from 68 to 95 days (Table 2). Therefore, from crosses between Middle American cultivars of common bean with an intermediate cycle, it was possible to obtain lines having both early and intermediate cycles from both methods of progression of segregating populations.
A larger number of lines with an early cycle were identified under the Pedigree method (Figure 1). Under the SSD method, a greater frequency of lines with an intermediate cycle was seen. However, Urrea and Singh
(1994) found that on average, families obtained under the SSD method were earlier than families derived both from F2 plants and those obtained in Colombia by the Bulk method. Genetic differences and differences in climate and soil may have contributed to the variations reported.
Environmental variance was more significant for cycle than genetic variance under the two methods of progression of segregating populations, and low values were thus obtained for heritability estimates under the
(h2n = 30.12%) (Table 2). In this case, difficulties in carrying out selection are expected, as the cycle presented a lot of non-controllable influence.
For lodging, the notes ranged from 1 (all plants erect) to 9 (all plants fallen and touching the ground), making possible the selection of plants having less lodging from those lines obtained under both the Pedigree and the SSD methods (Table 2). Erect plants, i.e. with less lodging, are of great commercial demand, due to the possibility of carrying out both mechanized and manual harvesting (MENDES; RAMALHO; ABREU, 2009) and because they have a better quality of grain, due to contact of the pods with the soil being avoided. To this end, selecting lines obtained under the SSD method is promising for the selection of plants with erect architecture due to the greater frequency of lines with less lodging being verified under this method (Figure 1).
Moderate estimates for heritability were noted for lodging of 48.88% (Pedigree) to 59.72% (SSD) (Table 2). These values are within the lower and upper limits of heritability for the architecture notes obtained in a joint analysis of F4:5 and F4:6 families, which were
obtained under the Pedigree method by Moreto et al.
(2007). As the estimates of heritability for lodging were higher than those for cycle, it can be asserted that the environment had less influence on the expression of this characteristic, and a greater success in selection of the plants for lodging may be found.
For the insertion of the first pod, the mean values observed in lines obtained under the Pedigree and SSD methods were 16.54 and 17.41 cm respectively (Table 2). These values were higher than those observed by Bertoldo
et al. (2010), who obtained an average of 16.30 cm when
evaluating 22 common bean accessions in the Santa Catarina state in Brazil. The highest mean for the insertion of the first pod (17.41 cm), and the largest number of lines which were superior in this characteristic, were observed when the lines were advanced under the SSD method (Table 2, Figure 1). Moderate estimates for heritability were obtained for the insertion of the first pod of 45.25%
(Pedigree) and 60.38% (SSD). The ease of selection of those lines having a higher insertion for first pod will therefore be similar to that expected for the identification of common bean plants with less lodging.
The general adaptation note showed promise in the selection of F7lines, as a range in variation of from 2 to 9 was observed in lines obtained under both the Pedigree and SSD methods (Table 2). Lines having the lowest general adaptation note are desirable, as they characterise more erect plants, with fewer stalks, a higher number of pods per plant and a lower incidence of the symptoms of disease in the pods, demonstrating better adaptability. A higher frequency of plants of this standard was identified in those lines obtained under the Pedigree method (Figure 1). Indirect selection using the general adaptation note was efficient in increasing the grain yield of common bean inbred lines, as a negative linear correlation (r = -0.6134) was found between these two characteristics (RIBEIROet al., 2010).
Low estimates for heritability were observed for the general adaptation note of 26.48% (Pedigree) and 20.23% (SSD) (Table 2). This occurred because environmental variance was more significant than genetic variance for the general adaptation note under the two methods of progression of segregating populations. This may result in difficulties in selection due to the higher non-controllable influence of the environment.
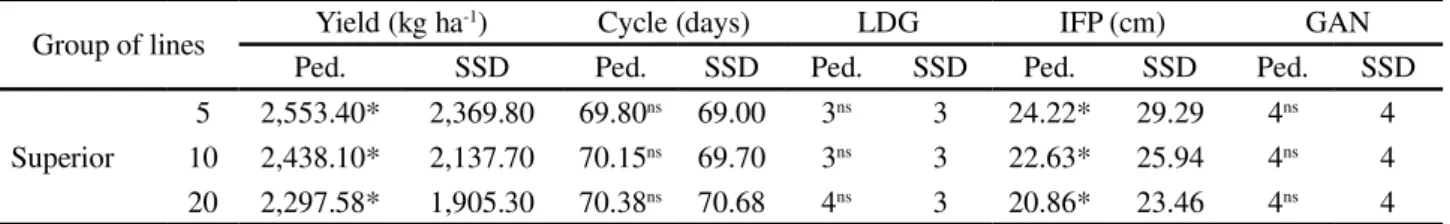
A method of progression of a segregating population will be that much more efficient higher the genetic gain for the same selection differential (RAPOSO; RAMALHO; ABREU, 2000). Aside from the average performance of the lines therefore, the probability of higher gain from selection must be considered when choosing the method of selection. Accordingly, averages were obtained for the best 5, 10 and 20lines from the total evaluated (Table 3).
The mean grain yield from the 5, 10 and 20 superior lines was higher under the Pedigree method (Table 3). The higher insertion of the first pod, in turn, was observed in the 5, 10 and 20 superior lines obtained under the SSD method. No significant differences
Table 3 - Grain yield (yield, kg ha-1), cycle (days), lodging (LDG), insertion of first pod (IFP, cm) and general adaptation note (GAN)
of the 5, 10 and 20 superior lines obtained under the Pedigree (Ped.) and Single-Seed Descent (SSD) methods
*Significant by the t-test at 5% probability. ns: not significant
Group of lines Yield (kg ha
-1) Cycle (days) LDG IFP (cm) GAN
Ped. SSD Ped. SSD Ped. SSD Ped. SSD Ped. SSD
Superior
5 2,553.40* 2,369.80 69.80ns 69.00 3ns 3 24.22* 29.29 4ns 4
10 2,438.10* 2,137.70 70.15ns 69.70 3ns 3 22.63* 25.94 4ns 4
were observed for the best 5, 10 and 20 lines for cycle, lodging and general adaptation note.
The number of lines where the mean performance exceeds, in absolute values, the mean of a cultivar previously selected as control (standard), can also be used to compare the efficiency of different methods of progression of segregating populations. The Pedigree method was therefore efficient in selecting a higher number of lines with a high potential grain yield, since 29 lines outperformed the best control (Minuano, 1,811 kg ha-1) (Table 4).
The grain yield of a large number of lines obtained by the Bean Breeding Program at the Federal University of Santa Maria was higher than that observed in the control cultivars. As all the control cultivars evaluated in this study are registered in the National Register of Cultivars of the Ministry of Agriculture, Livestock and Supply for cultivation in Rio Grande do Sul state, in accordance with the Agricultural Zoning for Climate Risk (MINISTÉRIO DA AGRICULTURA, PECUÁRIA E ABASTECIMENTO, 2010), there are prospects that the selection carried out with these lines may result in the registration of new common bean cultivars for the state.
Table 4 - Average for each control (Cont.), number of lines superior to each control, obtained under the Pedigree (Ped.) and Single-Seed
Descent (SSD) methods, and overall mean of the controls for grain yield (yield, kg ha-1), cycle (days), lodging (LDG), insertion of first
pod (IFP, cm) and general adaptation note (GAN)
Selection by the Pedigree method was also more efficient in the selection of those lines with an earlier cycle,
giving 59 lines which were earlier than the Macanudo
cultivar (black-bean group control, with a cycle of 73 days) and 81 lines earlier than the Iraí cultivar (colour
group control, with a cycle of 74 days) (Table 4). The Pedigree method was also efficient in the selection of a higher number of lines with a lower general adaptation note (better adaptability). Twenty-six lines were obtained with general adaptation note lower than those seen forBRS Supremo,TPS Nobre,BRS Valente andGuapo Brilhante
cultivars (note 4). As in the crop of the normal rainy season 2009/2010, in Santa Maria, RS, a high amount of rainfall was recorded, especially in the period between flowering and harvesting, together with a high average air temperature, these factors contributing to the high general adaptation note (worst adaptability) in many of the lines and controls, due to the higher incidence of disease.
The SSD method was efficient in selecting for lodging and insertion of first pod (Table 4). Eleven lines presented lower notes for lodging than the controls,TPS Nobre and Iraí (erect architecture). Many lines have a
Control ---Yield (kg ha
-1)--- ---Cycle (days)---
---LDG---Cont. Ped. SSD Cont. Ped. SSD Cont. Ped. SSD
Minuano (B)* 1,811 29 8 75 102 67 7 129 132
BRS Supremo (B) 1,341 65 36 77 122 104 4 20 30
Macotaço (B) 1,254 73 43 79 132 125 6 83 99
TPS Nobre (B) 1,207 80 46 77 122 104 3 9 11
BRS Valente (B) 1,115 85 52 77 122 104 4 20 30
Macanudo (B) 1,035 90 55 73 59 37 6 83 99
Pérola (C) 1,035 90 55 74 81 50 6 83 99
Guapo Brilhante (B) 1,016 91 58 77 122 104 4 20 30
IAPAR 44 (B) 945 100 69 76 106 77 7 129 132
BRS Expedito (B) 902 104 76 79 132 125 5 44 55
Iraí (Cr) 884 106 78 74 81 50 3 9 11
Diamante Negro (B) 822 112 82 79 132 125 7 129 132
BRS Campeiro (B) 547 127 108 77 122 104 6 83 99
Carioca (C) 540 127 108 83 135 126 7 129 132
Fepagro 26 (B) 520 128 110 79 132 125 7 129 132
Rio Tibagi (B) 493 130 114 77 122 104 7 129 132
TPS Bonito (C) 55 136 136 81 133 127 8 136 136
*controls: B: black commercial group; C: carioca-type grains; Cr:cranberry-type grain
insertion first pod higher than the evaluated controls, with 17 lines exceeding the cultivar with the highest insertion of the first pod,TPS Bonito.
Selection for grain yield, combined with phenological and morphological characteristics of agricultural interest, represents technological advances for the common bean. In this context, the Pedigree method was promising in the selection of a higher number of common bean lines with high yield, early cycle and lower general adaptation note (best adaptability) in the southern region of Brazil.
CONCLUSIONS
1. Grain yield, lodging and insertion of the first pod exhibit moderate narrow sense heritability for the F7 generation;
2. Cycle and general adaptation note show low heritability in the F7 generation;
3. The Pedigree method allows a higher number of lines having high grain yield, early cycle and lower general adaptation note (best adaptability) to be obtained;
Continuação da Tabela 4
Control IFP (cm)
---GAN---Cont. Ped. SSD Cont. Ped. SSD
Minuano 14.10 122 121 6 119 113
BRS Supremo 14.68 110 114 4 26 13
Macotaço 18.88 15 31 6 104 90
TPS Nobre 15.53 88 100 4 26 13
BRS Valente 14.40 120 117 4 26 13
Macanudo 15.50 89 100 5 77 62
Pérola 14.88 106 113 5 77 62
Guapo Brilhante 13.85 123 124 4 26 13
IAPAR 44 13.62 125 126 7 131 126
BRS Expedito 16.49 60 82 6 104 90
Iraí 13.01 132 130 5 51 29
Diamante Negro 19.35 14 27 7 131 126
BRS Campeiro 16.19 67 85 6 104 90
Carioca 18.76 17 32 7 131 126
Fepagro 26 16.40 61 83 6 119 113
Rio Tibagi 19.54 13 24 6 119 113
TPS Bonito 20.75 8 17 9 136 136
Mean 16.23 66 85 6 77 90
4. The Single-Seed Descent method makes it possible to identify a higher number of lines having lower notes for lodging and higher insertion of the first pod.
ACKNOWLEDGEMENTS
The authors wish to thank the Research Support Foundation of the state of Rio Grande do Sul for their financial help and student grant, and the National Council for Scientific and Technological Development and the Coordination for the Improvement of Personnel in Higher Education for the student grants.
REFERENCES
BERTOLDO, J. G. et al. Genetic gain in agronomic traits of common bean in the region of Planalto Catarinense.
Euphytica, v. 171, n. 3, p. 381-388, 2010.
BORÉM, A.; VIEIRA, G. Melhoramento de plantas. 5. ed.
Viçosa: UFV, 2009. 529 p. v. 1.
CABRAL, P. D. S. et al. Análise de trilha do rendimento de grãos de feijoeiro (Phaseolus vulgarisL.) e seus componentes.
Revista Ciência Agronômica, v. 42, n. 1, p. 132-138, 2011. CHIORATO, A. F.et al. Genetic gain in the breeding program of common beans at IAC from 1989 to 2007.Crop Breeding and Applied Biotechnology, v. 10, n. 4, p. 329-336, 2010. COSTA, J. G. C.; RAVA, C. A.; ZIMMERMANN, F. J. P. comparação da eficiência de métodos de seleção em gerações segregantes de feijoeiro-comum considerando a resistência à antracnose e o rendimento.Ciência e Agrotecnologia, v. 26,
n. 2, p. 244-251, 2002.
CRUZ, C. D. Programa Genes: biometria. Viçosa: UFV, 2006. 382 p.
JOST, E.et al. Efeitos gênicos do teor de cálcio em grãos de feijão.Ciência Rural, v. 39, n. 1, p. 31-37, 2009a.
JOST, E. et al. Potencial de aumento do teor de ferro em grãos de feijão por melhoramento genético.Bragantia, v. 68,
n. 1, p. 35-42, 2009b.
MINISTÉRIO DA AGRICULTURA, PECUÁRIA E ABASTECIMENTO.Zoneamento agrícola de risco climático: cultivares de feijão - ano - safra 2009/2010. Disponível em: <http://www.agricultura.gov.br>. Acesso em: 25 nov. 2010. MENDES, F. M.; RAMALHO, M. A. P.; ABREU, A. F. B. Índice de seleção para escolha de populações segregantes em feijoeiro-comum.Pesquisa Agropecuária Brasileira, v. 10, n. 4, p. 1312-1318, 2009.
MORETO, A. L. et al. Estimação dos componentes da variância fenotípica em feijoeiro utilizando o método
genealógico.Ciência e Agrotecnologia, v. 31, n. 4, p. 1035-1042, 2007.
PETERNELLI, L. A.; BORÉM, A.; CARNEIRO, J. E. S. Hibridação em Feijão.In: BORÉM, A.Hibridação artificial de plantas. 2. ed. Viçosa: UFV, 2009. p. 320-348.
RAMALHO, M. A. P.; SANTOS, J. B.; ZIMMERMANN, M. J. O. Genética quantitativa em plantas autógamas: aplicações ao melhoramento do feijoeiro. Goiânia: UFG, 1993. 271 p. RAPOSO, F. V.; RAMALHO, M. A. P.; ABREU, A. F. B. Comparação de métodos de condução de populações segregantes do feijoeiro. Pesquisa Agropecuária Brasileira,
v. 35, n. 10, p. 1991-1997, 2000.
RIBEIRO, N. D.; POSSEBON, S. B.; STORCK, L. Progresso genético em caracteres agronômicos no melhoramento do feijoeiro.Ciência Rural, v. 33, n. 4, p. 629-633, 2003. RIBEIRO, N. D. et al. Critério de seleção indireta para a produtividade de grãos em feijão. Ciência Rural, v. 40, n. 4,
p. 986-989, 2010.
TORGA, P. P.et al. Seleção de famílias de feijoeiro baseada na produtividade, no tipo de grãos e informações de QTLs.
Ciência e Agrotecnologia, v. 34, n. 1, p. 95-100, 2010. URREA, C. A.; SINGH, S. P. Comparison of mass, F2-derived family, and single-seed-descent selection methods in an interracial population of common bean. Canadian Journal of Plant Science, v. 74, n. 3, p. 461-464, 1994.