www.ambi-agua.net E-mail: [email protected]
Rev. Ambient. Água vol. 12 n. 5 Taubaté – Sep. / Oct. 2017
Technical feasibility of reuse of effluent generated from reverse
osmosis system in a pharmaceutical plant
doi:10.4136/ambi-agua.1980
Received: 04 Aug. 2016; Accepted: 12 Jun. 2017
Bárbara de A. S. de Andrade1; Paulo S. B. de Lacerda2; Jaime L. M. Oliveira3*
Fundação Oswaldo Cruz (FIOCRUZ), Rio de Janeiro, RJ, Brasil 1Unidade Bio-Manguinhos
2Unidade Far-Manguinhos
3Departamento de Saneamento e Saúde Ambiental
*Corresponding author: e-mail:[email protected], [email protected], [email protected]
ABSTRACT
Reuse reduces the consumption of freshwater supplies and the negative environmental impact caused by the discharge of industrial effluents. Some industries have already adopted this practice; however, no studies were found in the literature regarding this subject in the pharmaceutical industry. This work investigated the potential reuse of effluent (concentrate) generated from the Reverse Osmosis/Electro-deionization System (RO/EDI) that is used for the production of purified water in a Brazilian pharmaceutical plant. This industrial complex consumed about 200,000 m3 of water per year between 2012 and 2013 to produce one million of doses of vaccines, i.e., 2 L of water per dose of vaccine produced. During this period, the RO/EDI produced 27,000 m3 of purified water annually and generated 24,000 m3 of effluent (concentrate). This amount of effluent could be used to supply the production of industry steam (boilers) and/or cold water (cooling towers) that annually consumed an average of 12,000 m3 and 40,000 m3, respectively. The reuse of this effluent would result in a gross financial savings of 96,000 USD per year, excluding the costs of installation and control. From what has been researched in the literature, this work showed for the first time the possibility of reuse of effluent from RO/EDI System in the pharmaceutical industry.
Keywords: effluent reuse; pharmaceutical industry; vaccine production.
Viabilidade técnica de reúso de efluente gerado do sistema de osmose
reversa em uma indústria farmacêutica
RESUMO
Rev. Ambient. Água vol. 12 n. 5 Taubaté – Sep. / Oct. 2017
unidade farmacêutica brasileira. Este complexo industrial consumiu, entre 2012 e 2013, cerca de 200.000 m3 de água por ano para produzir um milhão de doses de vacinas, ou seja, cerca de 2 litros de água consumida por dose de vacina produzida. Durante este período, o sistema OR/EDI produziu anualmente 27.000 m3 de água purificada e gerou 24.000 m3 de efluente (concentrado) por ano. Esta quantidade de efluente poderia ser usada para suprir a produção de vapor (caldeiras) e/ou água gelada (torres de refrigeração) que consumiram anualmente uma média de 12.000 m3 e 40.000 m3 de água potável, respectivamente. A reutilização deste efluente resultaria em uma economia bruta de R$ 384.000,00 por ano, excluindo os custos de implantação e controle. Pelo que se pesquisou na literatura, este trabalho mostrou pela primeira vez a possibilidade de reúso de efluente de um sistema OR/EDI em uma indústria farmacêutica.
Palavras-chave: indústria farmacêutica; produção de vacinas; reúso de efluente industrial.
1. INTRODUCTION
There is currently a water crisis in one of the most densely populated regions of Brazil. The changing pattern, frequency and quantity of rainfall, poor management of water resources and the local culture are the main causes of this shortage (Proença and Ghisi, 2010). Various changes are required to overcome such shortages, including water conservation practices, conscientious usage of water, environmental education, and especially water-reservoir maintenance programs (Góis et al., 2015). To address these issues, the Brazilian National Environment Council has made regulatory changes to increase restrictions on both the extraction of fresh water and the disposal of wastewater (Brasil, 1997). These regulatory proceedings have caused the population to begin adopting alternatives such as the use of rainwater and a more conscientious use of water with less wastage.
Industries are one of the largest consumers of raw and/or treated water (FAO, 2010; ANA, 2013). Due to the higher costs of acquiring freshwater and disposing of wastewater, some companies have modified their production layouts to comply with the new regulations, especially for effluent reuse. Thus, oil refineries, pulp and paper industries, car manufacturers, chemical industries and food factories have been seeking alternatives to reduce water consumption and effluent discharge (Casani et al., 2005; Vourch et al., 2008; Suárez et al., 2014; Vajnhandl and Valh, 2014). However, no studies were found in the literature about effluent reuse in the pharmaceutical industry.
Normally, effluent reuse in industries requires pretreatments, such as membrane technology or oxidative processes (Casani et al., 2005; USEPA, 2012; Klemes, 2012; Suárez et al., 2014; Zheng et al., 2015). Riera et al. (2013) adopted a nanofiltration treatment of wastewater for reuse in a dairy and Götz et al. (2014) suggested a post-treatment with membranes for a combination of different wastewaters for reuse in a brewery. However, we have found few studies that proposed the direct reuse of effluent without the need for some kind of pretreatment.
Rev. Ambient. Água vol. 12 n. 5 Taubaté – Sep. / Oct. 2017
provided that these units do not come into direct contact with the products (Casani et al., 2005). Reuse could therefore be feasible in the pharmaceutical industry, but must be carefully studied to avoid any risks.
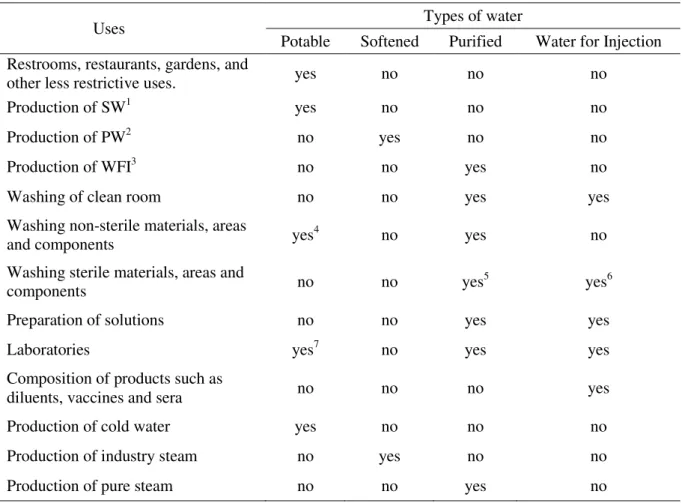
Water is one of the main inputs of the pharmaceutical industry. Basically, four types of water are used: potable, softened, purified and water for injections. Potable water is used in various areas such as cooling towers, gardens, for human consumption, sanitary installations, cleaning of internal and external areas, washing non-sterile components and others. Softened water (SW) is used for the production of industrial steam (boilers) and of purified water. Purified water (PW) is used for the generation of pure steam, washing of vials, sterilizing processes and washing of clean rooms. Water for injections (WFI) is produced from purified water and is used in the composition of products such as diluents, diagnostic kits, vaccines and sera. PW and WFI can be produced by different advanced technological processes such as distillation, demineralization, electro-deionization, reverse osmosis and ultra-filtration (Belkacem et al., 2008) (Table 1). Water quality standards for the pharmaceutical industry are well-established, and are enforced by national and international health agencies and controlled by certification and validation (USP, 2012), but nothing is known about the practice of effluent reuse in the pharmaceutical industry.
Table 1. Basic uses of different types of water at a Brazilian pharmaceutical plant (USP, 2012).
Uses Types of water
Potable Softened Purified Water for Injection
Restrooms, restaurants, gardens, and
other less restrictive uses. yes no no no
Production of SW1 yes no no no
Production of PW2 no yes no no
Production of WFI3 no no yes no
Washing of clean room no no yes yes
Washing non-sterile materials, areas
and components yes4 no yes no
Washing sterile materials, areas and
components no no yes5 yes6
Preparation of solutions no no yes yes
Laboratories yes7 no yes yes
Composition of products such as
diluents, vaccines and sera no no no yes
Production of cold water yes no no no
Production of industry steam no yes no no
Production of pure steam no no yes no
Notes: 1softened water; 2purified water; 3water for injection; 4normally used in external areas; 5pre-washing; 6post-washing; 7used in activities that require less stringent water quality requirements.
Water consumption varies for different industries and processes. Casani et al. (2005) reported that the food industry, in general, uses the greatest volume of freshwater in its processes. The brewery industry consumes between 4 and 6 liters of water per liter of beer
Rev. Ambient. Água vol. 12 n. 5 Taubaté – Sep. / Oct. 2017
liters of water per liter of treated milk produced (Vourch et al., 2008, Riera et al., 2013). However, little is known about water consumption for pharmaceutical products.
In recent years, the immunobiological area of the Brazilian pharmaceutical plant under study has made various investments to increase its manufacturing capacity to meet vaccination global demands (Feijó and Sáfadi, 2006), and has expanded its production facilities to supply immunization programs (Domingues et al., 2012). In 2013, the Technological Complex of Vaccines (TCV) in Rio de Janeiro (Brazil) produced 100 million doses of vaccines, about 5 million diagnostic kits and 9 million biopharmaceutical products. Given the growing demand, this complex is undergoing a process of modernization to improve the quality of products and to increase its production capacity (UNICEF, 2013). The rational use of water is therefore a major challenge.
In TCV, the production of PW by reverse osmosis generates an effluent (concentrate) that could be used in other processes. Some studies in hemodialysis clinics have suggested the use of this kind of effluent (concentrate generated from a reverse osmosis system) for washing external areas (Silva and Teixeira, 2011; Faria et al., 2016; Ribeiro et al., 2016). However, some authors recommended that this effluent could be better used like potable water (Faria et al., 2016). Thus, the aims of this study were: (1) to prepare the balance of water for vaccine production; (2) to propose the reuse of effluent generated from the production of purified water; and (3) to estimate the savings for this pharmaceutical company were this proposal adopted.
2. MATERIAL AND METHODS
2.1. Description of the Technological Complex of Vaccines (TCV)
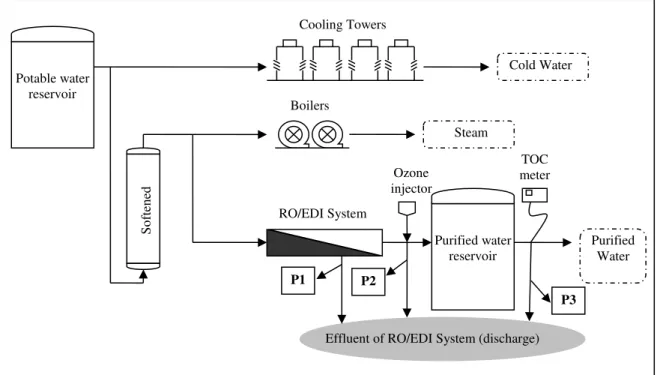
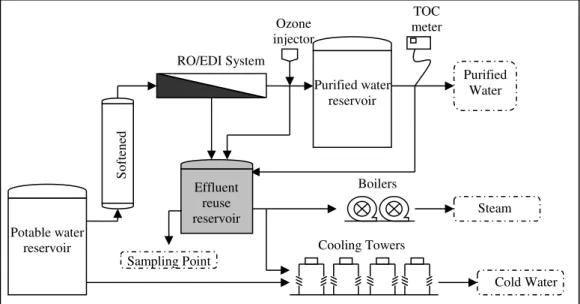
The TCV is responsible for the production of vaccines, diagnostic kits and biopharmaceuticals for the Ministry of Health. It is one of the most modern vaccine production centers in Latin America and it supplies yellow fever and meningitis vaccines to Brazil, South American countries, and the United Nations (UNICEF, 2013). The pharmaceutical plant receives potable water from the State Company for Water and Wastewater. This water is used in various installations, including cooling towers and the water treatment center. At this center, the potable water is softened to supply boilers to generate industrial steam and also to supply the Reverse Osmosis/Electro-deionization System (RO/EDI System) that will produce purified water (Figure 1). The purified water receives ozone to be used in the preparation of solutions and reagents for diagnosis, cleaning materials and equipment, production of vaccines, pure steam and water for injections. During the production of purified water, a part of the softened water is discharged as effluent (P1 in Figure 1). Moreover, the online monitoring systems show that the TOC (Total Organic Carbon) meter and the ozone injector also tend to discard purified water (P2 and P3 in Figure 1).
2.2. Evaluation of water consumption at the TCV
The Brazilian pharmaceutical plant provided a breakdown of the total volume of water used at the TCV in restrooms, restaurants, gardens, for steam, cold water and to the water treatment center for the production of softened and purified water. The company also supplied the quantity of vaccines produced in the years 2012 and 2013 in order to calculate the balance of water per vaccine.
2.3. Evaluation of effluent from production of purified water
Rev. Ambient. Água vol. 12 n. 5 Taubaté – Sep. / Oct. 2017
(effluent from the ozone injector) and P3 (effluent from the TOC meter). These samples were analyzed for TOC (Model Sievers 900 auto sampler, GE), conductivity (Model 712, Methrom), pH (Model Seven Easy, Mettler Toledo), alkalinity, bicarbonate, hardness, total dissolved solids, dissolved ions (nitrate, nitrite, phosphate, fluorite, sulfate, chlorite, chloride and iron), total heterotrophic and total coliforms. Alkalinity, bicarbonates and hardness evaluations were performed by titration. Total dissolved solids were determined by gravimetric analysis. Total heterotrophic and total coliforms were available by Plate Count Agar and Colilert methods, respectively. Dissolved ions were determined by Ion Chromatography (Model 790 Personal, Metrohm). All methodology followed the recommendations cited by Standard Methods (APHA et al., 2012) and United States Pharmacopoeia (USP, 2009).
Figure 1. Distribution flowchart of the Technological Complex of Vaccines showing the use of potable water in Cooling Towers (production of the water cold) and softened water in Boilers
(production of the steam) and the RO/EDI System (production of the purified water). P1: is effluent
(concentrate) from the RO/EDI System; P2: is effluent from the O3 injector; and P3: is effluent
from the TOC meter.
Note: RO/EDI System - Reverse Osmosis/Electro-deionization System.
2.4. Evaluation of the financial economy
Since the publication of the National Water Resources Policy in Brazil (Brasil, 1997), licenses for water extraction and the regulations to discharge wastewater into water sources have become more restricted. For industry, the cost of freshwater and the technical requirements for effluent disposal are high. In 2012 and 2013, the cost of potable water for industries in Rio de Janeiro was 4.00 USD (about R$ 16,00) per m3, which includes the discharge of effluents (data provided by State Company for Water and Wastewater). The cost at the TCV was based on the average volume of potable water consumed from 2012 and 2013 multiplied by the price charged by the State Company for Water and Wastewater. The estimated gross direct savings was calculated by multiplying the volume of water that would be saved by the proposal set forth here (Vp) by the price charged as above (Pc) (Equation 1). This evaluation of financial savings did not include the costs of implementation and maintenance of this proposal.
Purified Water RO/EDI System
Boilers
Cooling Towers
Potable water reservoir
S
often
ed
Purified water reservoir Ozone
injector
TOC meter Cold Water
Steam
P1 P2
P3
Rev. Ambient. Água vol. 12 n. 5 Taubaté – Sep. / Oct. 2017
Gds = Pc x Vp (1)
where:
“Gds” – gross direct saving;
“Pc” – price charged for cost of potable water; and
“Vp” volume of potable water saved according to this reuse proposal.
3. RESULTS AND DISCUSSION
3.1. Balance of water for vaccine produced
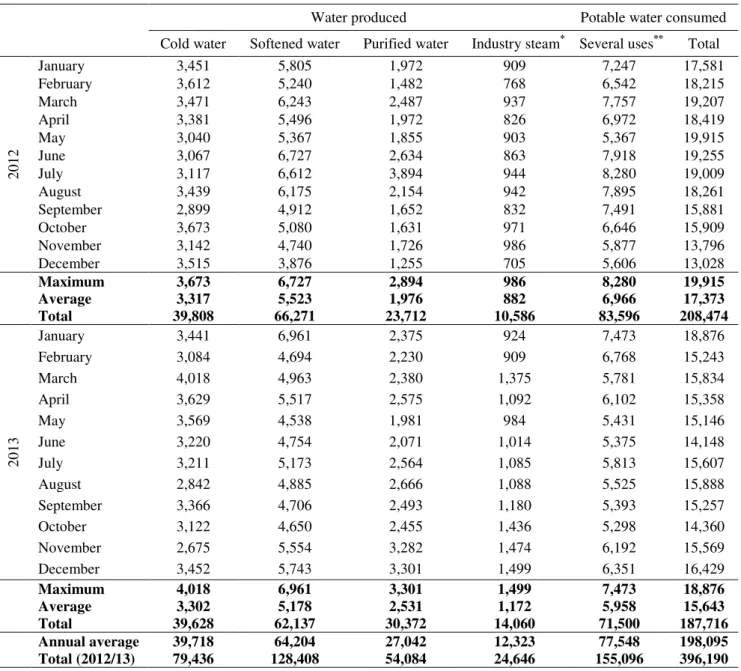
The water consumed at the TCV in was about 200,000 m3 per year (Table 2), 39% of which is for other uses, including gardens, cleaning of external areas, restaurants and restrooms (Figure 2). 104,000 m3 of potable water were used in production processes such as the production of cold and softened water. 9% of the TCV’s water was lost due to purging, cleaning, regeneration and other.
Table 2. Volume (m3) of water produced and consumed at the Technology Center of Vaccines (TCV).
Water produced Potable water consumed
Cold water Softened water Purified water Industry steam* Several uses** Total
2012
January 3,451 5,805 1,972 909 7,247 17,581
February 3,612 5,240 1,482 768 6,542 18,215
March 3,471 6,243 2,487 937 7,757 19,207
April 3,381 5,496 1,972 826 6,972 18,419
May 3,040 5,367 1,855 903 5,367 19,915
June 3,067 6,727 2,634 863 7,918 19,255
July 3,117 6,612 3,894 944 8,280 19,009
August 3,439 6,175 2,154 942 7,895 18,261
September 2,899 4,912 1,652 832 7,491 15,881
October 3,673 5,080 1,631 971 6,646 15,909
November 3,142 4,740 1,726 986 5,877 13,796
December 3,515 3,876 1,255 705 5,606 13,028
Maximum 3,673 6,727 2,894 986 8,280 19,915
Average 3,317 5,523 1,976 882 6,966 17,373
Total 39,808 66,271 23,712 10,586 83,596 208,474
2013
January 3,441 6,961 2,375 924 7,473 18,876
February 3,084 4,694 2,230 909 6,768 15,243
March 4,018 4,963 2,380 1,375 5,781 15,834
April 3,629 5,517 2,575 1,092 6,102 15,358
May 3,569 4,538 1,981 984 5,431 15,146
June 3,220 4,754 2,071 1,014 5,375 14,148
July 3,211 5,173 2,564 1,085 5,813 15,607
August 2,842 4,885 2,666 1,088 5,525 15,888
September 3,366 4,706 2,493 1,180 5,393 15,257
October 3,122 4,650 2,455 1,436 5,298 14,360
November 2,675 5,554 3,282 1,474 6,192 15,569
December 3,452 5,743 3,301 1,499 6,351 16,429
Maximum 4,018 6,961 3,301 1,499 7,473 18,876
Average 3,302 5,178 2,531 1,172 5,958 15,643
Total 39,628 62,137 30,372 14,060 71,500 187,716
Annual average 39,718 64,204 27,042 12,323 77,548 198,095
Total (2012/13) 79,436 128,408 54,084 24,646 155,096 396,190
Rev. Ambient. Água vol. 12 n. 5 Taubaté – Sep. / Oct. 2017
The TCV produced about 100 million of doses of vaccines between 2012 and 2013. Thus, considering the total water consumption and the number of doses of vaccine produced, each dose of vaccine required 2.0 liters of water. One dose averages 1 mL; therefore 2.0 m3 of water are required to produce 1 liter of vaccine. A soft drink factory consumes 4 to 7 liters of
water per liter of soda (Tokos and Pintariĉ, 2009; Götz et al., 2014), each liter of beer
consumes 4.6 liters of water (Lambooy, 2011) and one liter of treated milk requires 1.5 to 5 liters of water (Vourch et al., 2008; Riera et al., 2013). The balance water for vaccine production was therefore much higher compared to these other manufacturing sectors (Casani et al., 2005; Lambooy, 2011; Götz et al., 2014). This result shows the importance of implementing a water reuse policy at the plant to reduce this cost. Lambooy (2011) cited several examples of industries that have adopted water consumption reduction policies to achieve sustainable water use. While these companies did not detail what measures they used to reduce their water consumption, changes such as layouts based on water and wastewater flows, and the reuse of wastewater may be strategies for sustainable water use (Boix et al., 2012).
Figure 2. Internal distribution of potable water at the Technology Center of Vaccines (TCV) showing the total potable water used in different activities. In particular, the use of softened water to produce steam and purified water as well as effluent generated from purified water production (RO/EDI System).
Notes: “Other Uses” – Potable water used in laboratories, restrooms, firefighting, internal and
external cleaning, gardens and other; “RO/EDI System” – Reverse Osmosis/Electro-deionization System.
3.2. Quantity of effluent from RO/EDI System
The production of cold- and softened water consumed annually 39,718 m3 (20%) and 64,204 m3 (32%) of all the potable water acquired by TCV respectively (Table 2 and Figure 2). During this period, the RO/EDI System produced an average of 27,042 m3 of purified water per year, which corresponds to about 80% of all the softened water. Moreover, this system generated 23,000 m3 of effluent (concentrate) (P1), which corresponds to 36% of all softened water produced by the TCV. This percentage corresponds to the value recommended by the manufacturer and was obtained directly from the control panel. This system discharged softened water during the production of purified water which is controlled by sensors that measure parameters such as temperature, pH and TOC. The average volumes of effluent discharged by the O3 injector and TOC meter (P2 and P3) were 600 and 400 m3, respectively.
Rev. Ambient. Água vol. 12 n. 5 Taubaté – Sep. / Oct. 2017
system; therefore, the total annual volume of softened water discharged by the RO/EDI System was over 24,000 m3 between 2012 and 2013.
3.3. Quality of effluent from RO/EDI system
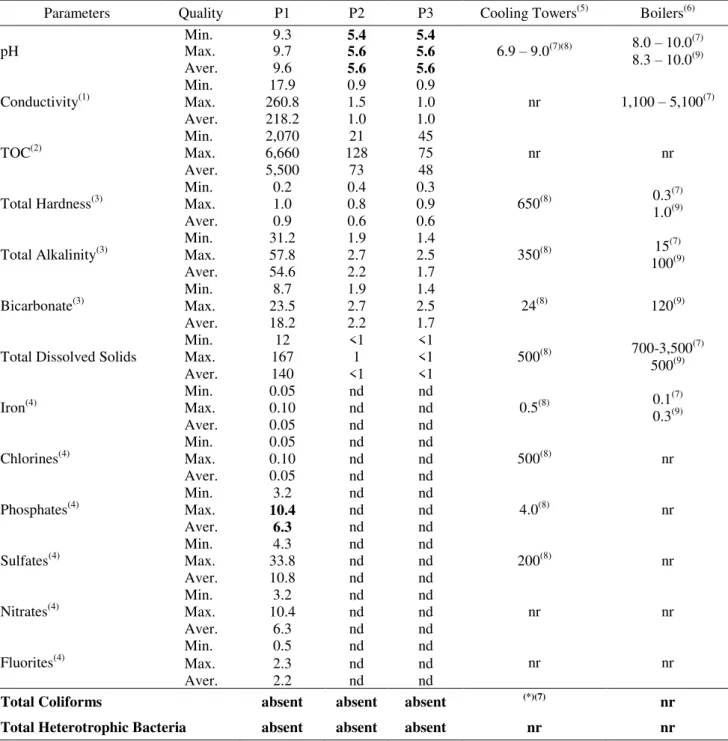
The effluent from P1, P2 and P3 complied with most of the minimum requirements set by the EPA (1992; 2012) for water quality used in boilers and cooling towers. The only exception was the pH (Table 3). In addition, this quality was superior to that found for the water supplying the boiler at the TCV in 2012 and 2013 (Table 4).
Table 3. Quality of effluent discharged during the production of Purified Water in TCV. P1 is effluent of the RO/EDI System; P2 and P3 are effluents of the TOC meter and ozone injector, respectively.
Parameters Quality P1 P2 P3 Cooling Towers(5) Boilers(6)
pH Min. Max. 9.3 9.7 5.4 5.6 5.6 5.4 6.9 – 9.0(7)(8) 8.0 8.3 –– 10.0 10.0(7)(9)
Aver. 9.6 5.6 5.6
Conductivity(1) Min. Max. 260.8 17.9 0.9 1.5 0.9 1.0 nr 1,100 – 5,100(7)
Aver. 218.2 1.0 1.0
TOC(2) Min. Max. 2,070 6,660 128 21 45 75 nr nr
Aver. 5,500 73 48
Total Hardness(3) Min. Max. 0.2 1.0 0.4 0.8 0.3 0.9 650(8) 0.31.0(7)(9)
Aver. 0.9 0.6 0.6
Total Alkalinity(3) Min. Max. 31.2 57.8 1.9 2.7 1.4 2.5 350(8) 10015(7)(9)
Aver. 54.6 2.2 1.7
Bicarbonate(3) Min. Max. 23.5 8.7 1.9 2.7 1.4 2.5 24(8) 120(9)
Aver. 18.2 2.2 1.7
Total Dissolved Solids Min. 12 <1 <1 500(8) 700-3,500(7)
500(9)
Max. 167 1 <1
Aver. 140 <1 <1
Iron(4) Min. 0.05 nd nd 0.5(8) 0.1(7)
0.3(9)
Max. 0.10 nd nd
Aver. 0.05 nd nd
Chlorines(4) Min. Max. 0.05 0.10 nd nd nd nd 500(8) nr
Aver. 0.05 nd nd
Phosphates(4) Min. Max. 10.4 3.2 nd nd nd nd 4.0(8) nr
Aver. 6.3 nd nd
Sulfates(4) Min. Max. 33.8 4.3 nd nd nd nd 200(8) nr
Aver. 10.8 nd nd
Nitrates(4) Min. Max. 10.4 3.2 nd nd nd nd nr nr
Aver. 6.3 nd nd
Fluorites(4) Min. Max. 0.5 2.3 nd nd nd nd nr nr
Aver. 2.2 nd nd
Total Coliforms absent absent absent (*)(7) nr
Total Heterotrophic Bacteria absent absent absent nr nr
Notes: Min. – Minimum; Max. – Maximum; Aver. – Average; TOC – Total Organic Carbon; nd – not detected; nr – not recommended; (1) - µS cm-1; (2) - µg L-1; (3) - mg CaCO
3 L-1; (4) – mg L-1; (5) recommended values for makeup; (6) boilers
Rev. Ambient. Água vol. 12 n. 5 Taubaté – Sep. / Oct. 2017
The alkaline pH at P1 would be due to the addition of sodium hydroxide (50%) for the production of PW to prevent any fouling of the reverse-osmosis membrane. On the other hand, the effluent from the TOC meter and O3 injector was more acidic. While a pH higher
than 8.5 can favor fouling and deposits in these systems, an acidic pH (less than 3.0) increases the risk of corrosion (Kolliopoulos et al., 2015). An important result was the low total alkalinity at P1 that had the highest pH value; this shows that effluent from P1 can be easily neutralized before reuse. A neutralization tank is required in order to reuse the effluent from the reverse osmosis system, mainly to reuse effluent discharged by the O3 injector (P2) and the TOC meter (P3).
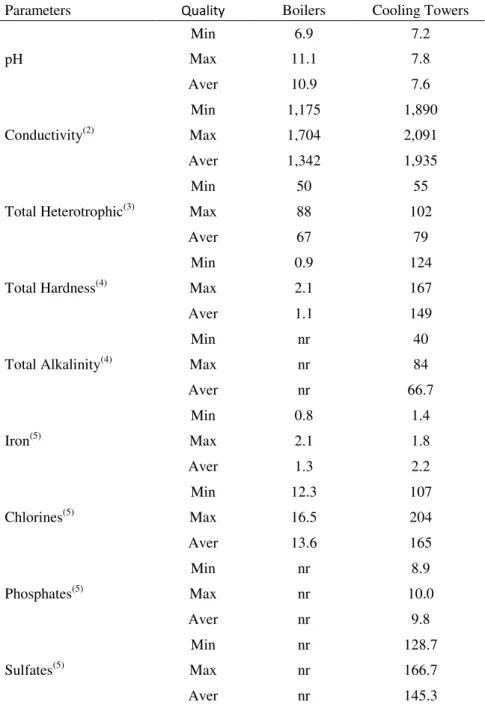
Table 4. Quality of water that supply boilers and cooling towers at
TCV(1).
Parameters Quality Boilers Cooling Towers
pH
Min 6.9 7.2
Max 11.1 7.8
Aver 10.9 7.6
Conductivity(2)
Min 1,175 1,890
Max 1,704 2,091
Aver 1,342 1,935
Total Heterotrophic(3)
Min 50 55
Max 88 102
Aver 67 79
Total Hardness(4)
Min 0.9 124
Max 2.1 167
Aver 1.1 149
Total Alkalinity(4)
Min nr 40
Max nr 84
Aver nr 66.7
Iron(5)
Min 0.8 1.4
Max 2.1 1.8
Aver 1.3 2.2
Chlorines(5)
Min 12.3 107
Max 16.5 204
Aver 13.6 165
Phosphates(5)
Min nr 8.9
Max nr 10.0
Aver nr 9.8
Sulfates(5)
Min nr 128.7
Max nr 166.7
Aver nr 145.3
Notes: nr – not recommended; (1) data of two years studied that were available
Rev. Ambient. Água vol. 12 n. 5 Taubaté – Sep. / Oct. 2017
P1 showed high values for phosphates (Table 3). Phosphates can cause fouling when combined with calcium and zinc ions (Petrinic et al., 2015); however, this effluent had low concentrations of hardness and alkalinity (as carbonate, for example), so the risk of fouling would be low (Colla et al., 2015). Moreover, the mean phosphate values of the water that feed the cooling tower in the TCV was higher than those measured in the effluent from RO/EDI System (Tables 3 and 4). Although the guidelines of effluent reuse do not mention fluoride and nitrate, these ions were monitored due to fluoridation and the amount of nitrate present in potable water that is used by the TCV. Fluoride can cause fouling when combined with calcium, while nitrates can block the action of bactericides used in the protection of cooling systems (Petrinic et al., 2015). However, the average concentration of anions was below that recommended for potable water (Brasil, 2011).
One of the most critical points for effluent reuse in cooling towers and boilers is microbiological contamination (EPA, 2012). This is because microorganisms can reduce the efficiency of heat transfer and water flow and can promote the production of corrosive chemicals such as hydrogen sulfide (EPA, 2012). The microbial load of the effluent was monitored, but no heterotrophic bacteria or total coliforms were found (Table 3). No recommended limit of microbiological contamination has been found for water reuse in boilers and cooling towers except for EPA-recommended limits (2012) of fecal coliforms (Table 3). In the specific case, the standard for potable water (Brasil, 2011) was considered for these two uses since the boilers are fed with softened water and the towers with potable water. In addition, the quality of water that supplies these two utilities in the TCV (Table 4) was compared with the quality of these effluents. Considering these two criteria, the effluent generated by the RO/EDI system meets both requirements. It is also worth noting that the water supplying the cooling towers is normally treated with biocides to avoid microbiological contamination. These results reinforce the possibility of reusing this effluent in these utilities.
Therefore, the quality of effluent from the purified water production system meets the parameters for the production of industry steam (boilers) and/or cold water (cooling towers). Silva and Teixeira (2011) and Faria et al. (2016) studied the feasibility of the reuse of concentrate from reverse osmosis in hemodialysis units. These authors found large volumes of concentrate being generated by these systems and recommended their reuse in external cleaning and firefighting. They regretted that despite the high quality of these effluents, the lack of a specific regulation for the water reuse prevents a better use of this waste (Faria et al., 2016). The studies of effluent reuse require an advanced pretreatment (Colla et al., 2015; Zheng et al., 2015), especially in the food industry (Casani et al., 2005; Götz et al., 2014; Suárez et al., 2014). Thus, as far as we know, this study has shown for the first time the technical feasibility for the direct reuse of effluent in a pharmaceutical industry producing vaccines.
3.4. Reduction of water consumption and financial savings
According to the distribution of potable water at the TCV, the effluent discharged during the production of purified water by the RO/EDI system could be used in the boilers or cooling towers; but the amount would be insufficient to supply its full demand of the cooling towers (about 40,000 m3). However, this amount would be sufficient to supply the boilers for the production of industrial steam with a certain surplus (about 12,000 m3). Therefore, this effluent could be used to fully supply the boilers and the surplus would go to the cooling towers which would receive a supplement of potable water. The total reuse of this effluent would correspond to an average gross savings of 24,000 m3 water per year.
Rev. Ambient. Água vol. 12 n. 5 Taubaté – Sep. / Oct. 2017
Therefore, the reuse of this effluent for industrial steam and in the cooling towers could generate a direct gross savings of 96,000 USD per year. This economy could increase, as this reuse is for softened water which has higher production costs than just potable water. In addition, with the recent shortage of water in the region and possible rationing, the cost of water may, in the near future, be higher than that adopted in this study, thus justifying investments.
A more accurate survey of these savings should consider implementation expenses, controls for effluent reuse, and personnel expenses, among others. Figure 3 shows a proposal for the reuse of wastewater from the RO/EDI System for steam and cold water production. In this new flowchart of the process, all the softened water would be used for the production of purified water. The boilers would be supplied with the effluent generated by RO/EDI system and the cooling towers would be fed a mixture of the same effluent and potable water (additional volume).
Making an analogy of the quality of water required for the production of vaccines to the electronic industry, Eksangsri and Jaiwang (2014) managed to get good results in the direct reuse of wastewater for washing electronic circuits in Thailand. These authors proposed the reuse model to overcome the local water crisis and reduce costs for the company so that it could expand its plant. However, the major challenge is the regulations and restrictions associated with effluent reuse in vaccine production systems at a pharmaceutical plant such as those applied to the food industry (Casani et al., 2005). On the other hand, the implementation of this project would create a positive image of the company from an environmental and social point of view (Lambooy, 2011). This would also be innovative for the pharmaceutical industry when it comes to effluent reuse in a plant for the production of vaccines.
Figure 3. Diagram showing the effluent reuse from the OR/EDI System to supply the
boilers and cooling towers.
Note:“RO/EDI System” – Reverse Osmosis/Electro-deionization System.
4. CONCLUSIONS
This work evaluated for the first time the possibility of direct reuse of effluent from a Reverse Osmosis System (RO/EDI System) in the pharmaceutical industry, i.e., effluent reuse without pre-treatment. The amount of water used by the pharmaceutical industry for the production of vaccines is about 100 times greater than that used by beverage factories; therefore, reuse could help to reduce total water consumption. The effluent from the RO/EDI
Purified Water RO/EDI System
Boilers
Cooling Towers Potable water
reservoir
S
often
ed
Purified water reservoir Ozone
injector
TOC meter
Cold Water Steam Effluent
reuse reservoir
Rev. Ambient. Água vol. 12 n. 5 Taubaté – Sep. / Oct. 2017
System’s purified-water production units of is of high–quality, and could be used in a steam-generation system (boiler) and/or in cooling towers. Effluent reuse would generate an annual gross financial savings of about 96,000 USD per year.
5. ACKNOWLEDGEMENTS
PROEX/CAPES.
5. REFERENCES
AMERICAN PUBLIC HEALTH ASSOCIATION – APHA; AMERICAN WATER WORKS ASSOCIATION – AWWA; WATER ENVIRONMENT FEDERATION - WEF. Direct air-acetylene flame method. Standard methods for the examination of water and wastewater. Washington, 2012.
AGÊNCIA NACIONAL DAS ÁGUAS – ANA (Brasil). Relatório sobre a conjuntura dos recursos hídricos no Brasil de 2013. 2013. Disponível em: http://shorturl.at/aDEP2. Acesso em: 01 mar. 2015.
BELKACEM, M.; BENSADOKA, K.; REFESB, A.; CHARVIERB, P. M.; NEZZAL, G. Water produce for pharmaceutical industry: role of reverse osmosis stage. Desalination, v. 221, p. 298-302, 2008. http://dx.doi.org/10.1016/j.desal.2007.01.086.
BRASIL. Lei nº 9.433, de 08 de janeiro de 1997. Política Nacional de Recursos Hídricos. Diário Oficial [da] União, Brasília, 09 de janeiro de 1997.
BRASIL. Portaria nº 2914, de 12 de dezembro de 2011. Procedimentos de Controle e de Vigilância da Água para Consumo Humano e Potabilidade. Diário Oficial [da] União, Brasília, 14 de dezembro de 2011.
BOIX, M.; MONSTASTRUC, L.; PIBOULEAU, L.; AZZARO-PANTEL, C.; DOMENECH, S. Industrial water management by multiobjective optimization: from individual to collective solution through eco-industrial parks. Journal of Cleaner Production, v. 22, p. 85-97, 2012. http://dx.doi.org/10.1016/j.jclepro.2011.09.011
CASANI, S.; ROUHANY, M.; KNOCHEL, S. A discussion paper on challenges and limitations to water reuse and hygiene in the food industry. Water Research, v. 39, p. 1134-1146, 2005. http://dx.doi.org/10.1016/j.watres.2004.12.015
COLLA, V.; BRANCA, T. A.; ROSITO, F.; LUCCA, C.; VIVAS, B. P.; DELMIRO, V. M. Sustainable reverse osmosis application for wastewater treatment in the steel industry. Journal Cleaner of Production, v. 130, p. 103-115, 2015. http://dx.doi.org/10. 1016/j.jclepro.2015.09.025
DOMINGUES, C. M. A.; TEIXEIRA, A. M. S.; CARVALHO, S. M. D. National immunization program: vaccination, compliance and pharmacovigilance. Revista do Instituto de Medicina Tropical de São Paulo, v. 54, supl. 18, p. S.22-S27, 2012. http://dx.doi.org/10.1590/S0036-46652012000700009
Rev. Ambient. Água vol. 12 n. 5 Taubaté – Sep. / Oct. 2017
FARIA, P. G. S.; NAGALLI, A.; FREIRE, F. B.; RIELLA, M. C. Reaproveitamento do concentrado gerado por sistema de tratamento de água por osmose reversa em uma clínica de hemodiálise. Revista Engenharia Sanitária e Ambiental, v. 21, n. 2, p. 329-336, 2016. http://dx.doi.org/10.1590/S1413-41522016122029
FEIJÓ, R. B.; SÁFADI, M. A. P. Immunizations: three centuries of success and ongoing challenges. Jornal de Pediatria, v. 82, n. 3, p. S1-S3, 2006. http://dx.doi.org/10.1590/S0021-75572006000400001
FOOD AND AGRICULTURE ORGANIZATION OF THE UNITED NATIONS - FAO. AQUASTAT: Information System on Water and Agriculture. Roma, 2010. Disponível em: http://shorturl.at/hwHQ9. Acesso em: 27 mar. 2014.
GÓIS, E. H. B.; RIOS, C. A. S.; CONSTANZI, R. N. Evaluation of water conservation and reuse: a case study of a shopping mall in southern Brazil. Journal of Cleaner Production, v. 96, p. 263-271, 2015. http://dx.doi.org/10.1016/j.jclepro.2014.08.097 GÖTZ, G.; GEIßEN, S-U.; AHRENS, A.; REIMANN, S. Adjustment of the wastewater
matrix for optimization of membrane systems applied for water reuse in breweries. Journal of Membrane Science, v. 465, p. 68-77, 2014. http://dx.doi.org/10.1016/j.memsci. 2014.04.014
KLEMES, J. J. Industrial water recycle/reuse. Current Opinion in Chemical Engineering, v. 1, n. 3, p. 238-245, 2012. http://dx.coi.org/10.1016/j.coche.2012.03.010
KOLLIOPOULOS, A. V.; METTERS, J. P.; BANKS, C. E. Quantification of corrosion inhibitors used in the water industry for steam condensate treatment: the indirect electroanalytical reusing of morpholine and cyclohexylamine. Environmental Science: Water Research & Technology, v. 1, p. 40-46, 2015. http://dx.doi.org/10.1039/C4EW00033A
LAMBOOY, T. Corporate social responsibility: sustainable water use. Journal of Cleaner Production, v. 19, p. 852-866, 2011. http://dx.coi.org/10.1016/j.jclepro.2010.09.009 MATSUMURA, E. M.; MIERZWA, J. C. Water conservation and reuse in poultry processing
plant – a case study. Resources Conservation and Recycling, v. 52, p. 835-842, 2008. http://dx.doi.org/10.1016/j.resconrec.2007.10.002
PETRINIC, I.; KORENAK, J.; POVODNIK, D.; HÉLIX-NIELSEN, C. A feseability study of ultrafiltration/reverse osmosis (UF/RO) – based wastewater treatment and reuse in the metal finishing industry. Journal of Cleaner Production, v. 101, p. 292-300, 2015. http://dx.doi.org/10.1016/j.jclepro.2015.04.022
PROENÇA, L. C.; GHISI, E. Water and-uses in Brazilian office buildings. Resources, Conservation and Recycling, v. 54, n. 8, p. 489-500, 2010. http://dx.doi. org/10.1016/j.resconrec.2009.10.005
RIBEIRO, L.; SANCHES-PAGLIARUSSI, M.; RIBEIRO, J. Reutilização da sobra de água permeada e de rejeito de uma central de tratamento de água por osmose reversa de uma unidade de hemodiálise hospitalar. Brazilian Journal of Biosystems Engineering, v. 10, n. 3, p. 259-272, 2016. http://dx.doi.org/1018011/bioeng2016v10n3p259-272. RIERA, F. A.; SUÁREZ, A.; MURO, C. Nanofiltration of UHT flash cooler condensates
Rev. Ambient. Água vol. 12 n. 5 Taubaté – Sep. / Oct. 2017
SILVA, P. B.; TEIXEIRA, E. P. Reúso da água do rejeito de um tratamento de osmose reversa de uma unidade de hemodiálise hospitalar: estudo de caso. Revista Brasileira de Inovação Tecnológica em Saúde, v. 4, n. 4, p. 42-51. 2011. http://dx.doi.org/10.18816/r-bits.v4i4.1496
SUÁREZ, A.; FIDALGO, T.; RIERA, F. A. Recovery of dairy industry wastewater by reverse osmosis: production of boiler water. Separation and Purification Technology, v. 133, p. 204-211, 2014. http://dx.doi.org/10.1016/j.seppur.2014.06.041
TOKOS, H.; PINTARIC, Z. N. Synthesis of batch water network for a brewery plant. Journal of Cleaner Production, v. 17, p. 1465-1479, 2009. http://dx.doi.org/10.1016/j. clepro.2009.06.009
TOMAZ, P. Conservação da água. Guarulhos: Digihouse, 1998.
UNITED NATIONS CHILDREN'S FUND – UNICEF. Yellow fever vaccine: current outlook. Unit for children. Disponível em: http://shorturl.at/esX45. Acesso em: 01 dez. 2015.
UNITED STATES. Environmental Protection Agency - USEPA. Guidelines for Water Reuse. Washington, DC, 1992.
UNITED STATES. Environmental Protection Agency - USEPA. Guidelines for Water Reuse. Washington, DC, 2012.
UNITED STATES PHARMACOPOEIA - USP. The United States Pharmacopeia Convention. 2nd Ed. Washington, DC: 2012.
VAJNHANDL, S.; VALH, J. V. The status of water reuse in European textile sector. Journal of Environmental Management, v. 141, p. 29-35, 2014. http://dx.doi.org/10.1016/j.jenvman.2014.03.014
VOURCH, M.; ALANNEC, B.; CHAUFER, B.; DORANGE, G. Treatment of dairy industry wastewater by reverse osmosis for water reuse. Desalination, v. 219, p. 190-202, 2008. http://dx.doi.org/10.1016/j.desal.2007.05.013