Vol.47, n. 1 : pp. 63-70, March 2004
ISSN 1516-8913 Printed in Brazil
BRAZILIAN ARCHIVES OF
BIOLOGY AND TECHNOLOGY
A N I N T E R N A T I O N A L J O U R N A L
Flour Mixture of Rice Flour, Corn and Cassava Starch in
the Production of Gluten-Free White Bread
Ana Cristina Ballesteros López
*, Accacia Julia Guimarães Pereira and Roberto Gonçalves
Junqueira
FAFAR/UFMG; Av. Olegário Maciel, 2360; tininha@net.em.com.br; 30180-112; Belo Horizonte - MG - Brazil
ABSTRACT
The use of rice flour corn and cassava starch was evaluated in several formulations aiming to find a flour mixture to replace wheat flour in the production of free-gluten white bread. Production parameters were evaluated through sensory analysis. The resulting breads were evaluated taking into account physical parameters (crumb appearance, specific volume and moisture) and sensorial parameters (flavor, appearance, crumb texture, crust color and satisfaction). Regarding flavor and moisture, breads prepared with the three different ingredients were not statistically different at 5% probability by the Tuckey test. However, they differed significantly regarding the specific volume, crumb texture, crust color, degree of satisfaction and external appearance. Rice flour bread presented the best parameters, being preferred by the sensory evaluation panel, followed by corn starch bread and cassava starch bread. Breads prepared with rice flour resulted in a softer product, presenting a better consistency with small alveoli homogeneously distributed. As far as crumb texture was concerned, corn starch bread presented larger alveoli, while cassava starch resulted in bread with expandable and gummy crumb, with granulation without alveoli, and undesirable sensorial characteristics. Production parameters were established based on these results and a mixture of flours, composed by 45% rice flour, 35% corn starch and 20% cassava starch presented good results originating bread with crumb formed by uniform and well distributed cells, and pleasant flavor and appearance.
Key-words: Celiac disease, gluten-free bread, corn starch, cassava starch, rice flour
*
Author for correspondence
INTRODUCTION
Celiac disease is a condition in which the mucous membrane of the small intestine of gluten-intolerant people is damaged by gluten, resulting in poorly absorption of nutrients and, consequently, weight loss, diarrhea, anemia, fatigue, flatulence, deficiency of folate and osteopenia (Blades, 1997; Thompson, 1997). The first description of the disease was made more than 100 years ago by Samuel Gee, as a “celiac disorder”, defined as a chronic indigestion occurring in people of all ages, particularly in
one-to-five years old children (Sdepanian et al., 1999). The Brazilian Association of People with Celiac Disease (Acelbra) has approximately 600 members. However, the number of affected people is probably much higher, since, according to data from the Word Health Organization (WHO), approximately 5% of the population may present this syndrome (Doença Celiaca, 1999).
since the most commonly baked products, such as breads, cakes, biscuits, pizzas and pasta are usually prepared with wheat flour and are consumed on an every-day basis by most people. There are alternative products, such as cheese bread, tapioca biscuits and maize cakes in the Brazilian cuisine. The introduction of low-cost industrialized products could be a solution as in some European countries and in the USA.
Brazil has a federal law (Law number 8543 of 23/12/92) that obligates food producers to indicate in the labels and packages of products containing gluten “CONTAIN GLUTEN”. A research carried out by the Consumers Defense Institute (IDEC), that examined Brazilian and imported industrialized products prepared with wheat, oat, rye, barley and their derived components, concluded that among 48 products 31 did not comply with the law. The situation could be improved if all gluten-free products had the indication “DO NOT CONTAIN GLUTEN” in their labels and packages or had the international symbol (Doença Celiaca, 1999). Brazil imports high quantities of wheat, thus attempts to replace it by products such as corn, rice and other cereals would be of great importance. Several advantages can be mentioned favoring the replacement of wheat flour by alternative flours, and these include the reduction of wheat importations and an increased consumption of flours made from cassava, corn, sorghum, and other cereals (Machado, 1996). With the objective to establish a flour mixture for use in the replacement of wheat flour, several formulations were tested taking into account the composition and the stages involved in the production of a loaf of bread adapted to the mixture.
MATERIAL AND METHODS
Material
The ingredients used were: maize flour (Arisco), cassava starch (Marinez), rice flour (Yok), granulated white sugar (União), dried milk (Cotochés), iodized refined salt (Globo), backing powder (Fleischman), margarine (Dona Vaca), dried egg (Sohovos), xanthan gum (Keltrol F- Nutrasweet). All ingredients were purchased from commercial sources or directly from the suppliers, keeping the same specification in all experiments. The following equipments and utensils were used to carry out the physical analysis of the product,
the technical assays for the bread preparation and the sensorial analysis: drying-sterilizing stove, FANEM, model 315 SE; electric oven LAYR, model Crystal.1.75, with a temperature control unit FORNAX 1000; dough processor Kitchen Aid; multiprocessor ARNO; balance OHAUS model MB200; loaf baking pan (500 g); bread slicer adapted to produce uniform pieces.
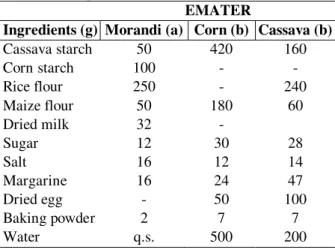
The basic replacing formulation for the loaf of bread was determined based on several preliminary assays. The ideal proportions of the main ingredients and the development of a standard procedure was based on traditional recipes, as presented in Table 1.
Table 1 - Adapted formulations from gluten-free breads
EMATER
Ingredients (g) Morandi (a) Corn (b) Cassava (b)
Cassava starch 50 420 160
Corn starch 100 - -
Rice flour 250 - 240
Maize flour 50 180 60
Dried milk 32 -
Sugar 12 30 28
Salt 16 12 14
Margarine 16 24 47
Dried egg - 50 100
Baking powder 2 7 7
Water q.s. 500 200
Source: a - MorandiI, 1999; b - Pão…, 1999
Methods
The tests were carried out in quadruplicates, according to the formulation presented in Table 2, following the flow chart shown in Fig. 1.
Mixture of ingredients (Kneading)
↓↓↓↓
Dough division
↓↓↓↓
Shaping
↓↓↓↓
Fermentation
↓↓↓↓
Baking
↓↓↓↓
Cooling
↓↓↓↓
Wrapping
The preparation started by weighing all ingredients. The following step was the mixture and kneading, according to a specified sequence, adding first the dry ingredients, followed by the eggs, water, and butter, according to times and speed experimentally determined. After homogenization, 420g of bread dough were transferred to a greased baking pan and incubated at room temperature and relative humidity experimentally determined. Dough rising was observed every 10 minutes to define the fermentation stage. The baking process was carried out in an electric oven according to time and temperature experimentally determined. The baked breads were cooled down at room temperature for two hours and were then sliced and wrapped up in polystyrene bags.
Evaluation of crumb texture appearance
The crumb texture appearance was evaluated by impressions, made by pressing the slice of bread in an inkpad and then on a mimeograph paper. The impressions represented the original dimensions of the alveoli, as well as the shape of the bread slices allowing visualization of its granulation (Child and Prudy, 1926; Griswold, 1972).
Evaluation of bread volume
The volume of the thin loaf was determined one hour after the end of the baking process using the formula: specific volume (cm3 /g) = volume (cm3) /dough (g). After weighing, the volume of the sample was measured by the method of displacement of Italian millet seeds (Griswold, 1972).
Moisture levels
Moisture was determined by placing a 10g milled sample an infrared balance OHAUS, adjusted to 105 ºC for 25 minutes, which gave the moisture reading in g/100g.
Bread sensorial evaluation
One day after preparation, breads were submitted to a sensory analysis in order to evaluate appearance, crumb texture, crust color, degree of satisfaction and flavor. Samples were homogenously sliced and placed in codified recipients using three digits randomly. One slice of each sample was given to each taster. The breads were submitted to an acceptance test, applying a hedonistic scale of 5 points. Breads prepared with flour mixtures were submitted to an acceptability
test, using a proper question. Sensorial data were statistically analyzed considering frequencies and comparisons of means by the Tuckey test at 5% probability, as recommended by Daniel (1999).
Table 2 - Basic formulation used for preparation of gluten-free bread.
Ingredients G/100g*
Flours * * 100
Dried milk 15
SUGAR 2
Salt 2
Margarine 3
Backing powder 1
Water 100-120
Dried egg 10
Xanthan gum 0.5
* Percentage of ingredients in relation to 100% of the total flour weight.
** Corn starch, cassava starch, rice flour
RESULTS AND DISCUSSION
The general aspects of the breads produced with corn and cassava starch and rice flour as shown in Figs. 2, 3 and 4. It was observed that the bread produced with rice flour, presented golden color and satisfactory appearance in terms of structure and volume, although the crust was relatively dry (Fig. 2).
Figure 2 - Loaf of bread prepared with rice flour
Figure 3 - Loaf of bread prepared with corn starch
The cassava bread, shown in Fig. 4, exhibited a rubber-like aspect, with no defined structure, puckered, and an irregular crust, with little volume and non-uniform color.
Figure 4 - Loaf of bread prepared with cassava starch
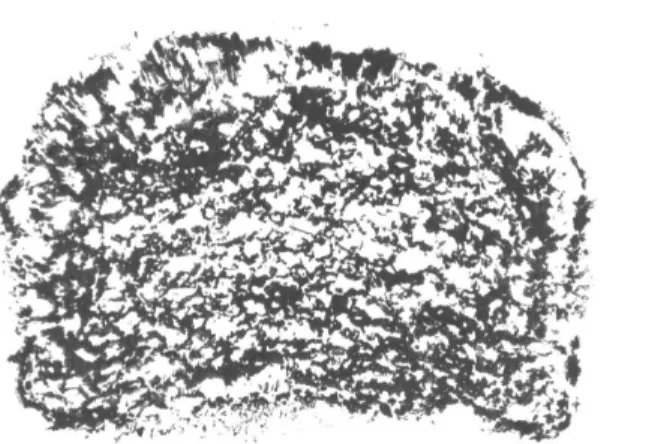
The texture appearance of the crumbs prepared with rice flour, corn and cassava starch is shown in Figs. 5, 6 and 7 respectively. According to Machado (1996), the texture is considered one of the most important aspects of bread quality, which is influenced by the granulation or structure of the crumb. The texture of flour rice bread shown in Fig. 5, indicated the presence of small alveoli, slightly elongated with thin walls distributed homogeneously, similar to the breads prepared by Ylimaki et al. (1991), who reported that rice bread presented rougher texture and smaller cells in the crumb when compared with wheat bread.
Figure 5 - Impression of rice flour crumb
The corn starch bread presented larger alveoli and some roles with crumbling characteristics, as shown in Fig. 6. This result differed from that found for the thin loaf by Griswold (1972), regarding the crumb texture characteristics with smaller slightly elongated alveoli, homogeneously distributed.
Figure 6 - Impression of corn starch crumb
Figure 7 - Impression of cassava starch crumb
According to He and Hoseney (1991), the capability to retain gas can be expressed in terms of bread volume. The highst volume was obtained with wheat flour, followed by barley, rice and corn. The differences in the breads quality were evident being that rye, rice and corn flour produced dense breads with small volume.
The specific volumes presented in Table 3 showed a significant difference only for corn starch with the highest value 2.53 cm3/g. However, this value was not satisfactory when compared to the specific volume obtained for an ordinary thin loaf prepared with plain flour, for which the mean value was 6.00 cm3/g, according to Machado (1996). Some special bread exhibited specific small volumes (cm3/g), that is, they were denser and more compact, although these characteristics did not interfere with their acceptability by the consumers, according to Matz (1960).
The cassava starch bread and rice flour bread presented lower volumes than corn starch breads, but no significant differences were seen between them at 5% probability.
Table 3 - Specific volumes for breads prepared with corn and cassava starch and rice flour (cm3/g)
Corn starch Rice flour Cassava starch
Mean 2.53a 1.92b 2.04b
DP 01 0.16 0.19
CV 8.0 8.30 9.50
Means followed by different letters differ among them as analyzed by Tuckey test, at 5% probability.
Regarding moisture, no significant difference was seen among the breads prepared with the different types of starch, as analyzed by Tuckey test (5% probability). However, the mean moisture values
presented in Table 4 were higher than those for plain flour bread, whose mean value was 38g/100g, according to the standard value established by the Brazilian legislation. The cassava bread moisture in these experiments was closer to the established standard 38g/100g than that described by Silva (1995), 79g/100g. Moisture levels for rice flour bread and corn starch bread have not been reported in the revised literature.
Table 4 - Moisture levels of breads prepared with corn and cassava starch and rice flour (g/100g)
Corn starch Rice flour Cassava starch
Mean 43.36a 47.93a 42.88a
DP 2.47 3.69 2.55
CV 5.50 7.70 5.90
Means followed by different letters differ among them as analyzed by Tuckey test, at 5% probability.
The sensory analysis showed no significant differences (5% probability) among the different experimental breads for the attribute flavor (Table 5). However, 50% of the assessors found the corn bread flavor regular, 25% very bad, 17% bad, and only 8% good. The bread prepared with rice flour was considered good by 25% of the assessors, regular by 33%, very bad by 17% and very good by only 8%. The cassava starch bread was considered regular by 67% of the assessors, very bad by 17%, and between good and bad by 17%. Regarding the other attributes of the sensory analysis, the breads differed significantly in relation to the crumb texture, crust color, degree of satisfaction and external appearance. The rice flour bread presented the best results, higher softness and better consistency, followed by corn and cassava starch breads, as shown in Table 5.
Table 5 - Sensorial characteristics of corn and cassava starch breads and rice flour bread.
Corn starch
Rice flour
Cassava starch
Appearance 2.42 b 3.63 a 1.42 c Flavor 2.42 a 2.92 a 2.67 a Crust color 3.33 b 4.42a 2.83 b Crumb texture 3.08 b 4.42 a 1.00 c Degree of
satisfaction
2.25 a, b 3.00 a 1.42 b
The general analysis of the results indicated that the corn and cassava starch and rice flour could compose the flour mixture. The rice flour predominated in the mixture due to the favorable characteristics in the crumb texture, appearance and crust color. However, the other starch should also be included, since the corn starch favored the formulation volume and the corn starch was essential for the adhesiveness, decreasing the bread crumbling, resulting in a more compact bread. Fig. 7 showed that the cassava crumb was denser with less alveoli. The proposed starchy mixture was tested and produced a good result, originating breads with well-distributed cells, uniform in size, as shown in Fig. 8. As for the flavor, 58% of the testers reported that the bread was salty; it was then proposed to increase sugar in the formulation. The crust and the crumb color were considered ivory-like by 67% and 75% of the assessors, respectively. The crumb texture was considered dry by 76% of assessors and floury by 67%, as shown in Figs. 9 to 13.
After the definition of the ideal mixture of starch, the operational conditions, kneading time and fermentation conditions were established, i.e., time, incubation temperature and humidity and baking time and temperature.
The first step to prepare the mixture began by homogenizing all the dry ingredients at low speed in the food processor (2) for 2 minutes; this was followed by the addition of butter, water and egg; the food processor speed was then increased (6) for 7 minutes. According to the visual analysis of the dough, the kneading time varied. It was observed that a more prolonged kneading softened the dough resulting in loss of the final structure of the product.
It was determined that the optimum kneading time was 5 minutes at high speed (6), until homogeneous and smooth dough was obtained. According to El-dash (1983), the correctness of the dough kneading and the appropriate time produced a fine texture and good volume, whereas the insufficient or excess dough kneading resulted in a very soft product that was difficult to be prepared. Kim and Ruiter (1968), analyzing the effect of speed of kneading, obtained a finer and softer crumb texture when the process was quicker.
The bread was placed in the incubation with 50% humidity, until the dough doubled the volume, (El-dash, 1983). They defined the ideal fermentation time as that sufficient to increase the
volume to a maximum without breaking the dough. The fermentation at room temperature (30oC) took a very long time, causing negative effects both in the bread volume and in the crumb structure, which was thicker. Kim and Ruiter (1968) observed that by increasing the fermentation time of gluten-free bread from 48 to 68 minutes, no significant effect in the bread volume was obtained, but the crumb texture became thicker. Therefore, the standard temperature of 40oC, 50% humidity and fermentation time of 50 minutes were considered good condition.
The initial baking temperature of 230oC, commonly used for wheat flour bread, was not suitable for our breads, as it produced dark crust and dry bread. From preliminary experiments, the temperature of 210oC and time of 30 minutes were established as the baking standard. According to El-dash (1983), the final stage of baking must yield a colored, light, porous, tasty product as shown in Figs. 8 to 13.
0 10 20 30 40 50 60 70 sour
bitter row dough fermented tastless rancid savour sweet
%
mild moderate strong
Figure 9 - Sensory analysis of the attributes flavor for the bread prepared with the starch mixture.
0 20 40 60 80
white ivory-like yellowish irregular
%
mild moderate strong
Figure 10 - Sensory analysis of the attributes, crumb color, for the bread prepared with the starch mixture.
0 20 40 60 80
white ivory-like yellowish manchada
% mild moderate strong
Figure 11 - Sensory analysis of the attributes, crust color, for the bread prepared with the starch mixture.
0 20 40 60 80
dry hard greasy floury buttery crumbling
%
mild moderate strong
Figure 12 - Sensory analysis of the attributes, crumb texture, for the bread prepared with the starch mixture.
0 20 40 60 80
like very much like like nor dislike dislike dislike very much
%
Figure 13 - Sensory analysis of the attributes, satisfaction, for the bread prepared with the starch mixture.
RESUMO
aparência, textura do miolo, cor da casca e satisfação). Para os parâmetros sabor e umidade não houve diferença significativa a 5% de probabilidade pelo teste de Tuckey. Os pães produzidos com os 3 ingredientes diferiram significativamente quanto ao volume específico, à textura do miolo, à cor da casca, ao grau de satisfação e à aparência externa. Os pães de farinha de arroz apresentaram os melhores parâmetros, sendo preferidos pela equipe de provadores, seguidos pelos de amido de milho e por último de fécula de mandioca. Os pães elaborados com farinha de arroz resultaram em produto de maior maciez, melhor consistência com pequenos alvéolos homogeneamente distribuídos. Quanto ao aspecto da textura do miolo, os pães fabricados com amido de milho apresentaram alvéolos maiores. A fécula de mandioca resultou em pães com miolo extensível, gomoso e de granulação fechada sem alvéolos, com características sensoriais indesejáveis. Os parâmetros de produção foram estabelecidos a partir destes resultados e uma mistura de farinhas, composta por 45% de farinha de arroz, 35% de amido de milho e 20% de amido de mandioca apresentou um bom resultado, originando pães com miolo compostos por células de tamanho uniforme bem distribuídas e sabor e aparência agradáveis.
REFERENCES
Anvisa (2001), Resolução RDC 90. Disponível na internet: http://www.anvisa.gov.br.
Blades, M. (1997), Food allergies and intolerances: an update. Nutricion and Food Science, 4 : (5), 146-151. Child, A. M. and Prudy D. I. (1926), Method for a
graphic record of texture, volume and contour of cakes. Cereal Chemistry, 3, 57-59.
Daniel, W. W. (1999), Biostatistics: a foundation for
analysis in the health sciences. 7th ed. New York :
John Wiley and Sons. 907 pp.
Doença celiaca: causas e prevenção. Acelbra. (1999), Disponível na internet: http://www.celi.com.br.
El-dash, A. A. (1983), Análises das perspectivas de um programa para a substituição parcial de
farinha de trigo por sucedâneos de produção nacional.
Rio de Janeiro : Embrapa-CTAA. (Documentos; 4). EMATER (1999), Pão mandioca. Disponível na
internet: hhtp://www.agridata.mg.gov.br.
Griswold, R. M. (1972), Estudo experimental dos alimentos. São Paulo: Editora da Universidade de São Paulo - EDUSP. 469 pp.
He, H.; Hoseney, R. C. (1991), Gás retention of different cereal flours. Cereal Chemistry, 68 : (4), 334-336. Kim, J. C.; De Ruiter, D. (1968), Bread from non-wheat
flours. Food Technol. 22, 867-878.
Machado, L. M. P. (1996), Pão sem glúten: Otimização
de algumas variáveis de processamento. Campinas:
Universidade Estatual de Campinas. (Dissertação de Mestrado em Tecnologia de Alimento). 186 pp. Matz, S. A. (1960), Testing of bakery products Bakery
technology engineering. Westport. pp. 614-620.
Morandi, L. (1999), Receitas sem açúcar e sem glúten. Disponível na internet: http://www.bdt.org.br. Sdepanian V. L.; Morais, M. B. and Fagundes Neto, F.
(1999), Doença Celíaca: a evolução dos conhecimentos desde sua centenária descrição original até os dias atuais. Disponível na internet: http://www.e-gastroped.com.br/march.
Silva, M. M. S. (1995), Convivendo com a doença
celíaca. Viçosa : Jard Produções Gráficas. pp. 154.
Thompson, T. (1997), Do oats belong in a glúten-free diet? Journal of the American Dietetic Association,
97 : (12), 1413-1416.
Ylimaki, G.; Hawrysh, Z. J.; Hardin, R. T. and Thomson, A. B. R. (1991), Response surface methodology in the development of rice flour yeast breads: sensory evaluation. Journal of Food Science,
56 : (3), 751-755,759.