1 UNIVERSIDADE DE LISBOA
Faculdade de Medicina
Audio-perceptive analysis of the Parkinsonism associated dysarthria by different health professionals, patients, relatives and from general population.
Joana Margarida do Nascimento Fagundes Carvalho
Orientadores: Prof. Doutor Joaquim José Coutinho Ferreira Profª. Doutora Isabel Guimarães
Dissertação especialmente elaborada para obtenção do grau de Mestre em Neurociências
2
“A impressão desta dissertação foi aprovada pelo Conselho Científico
3 UNIVERSIDADE DE LISBOA
Faculdade de Medicina
Audio-perceptive analysis of parkinsonism-associated dysarthria by different healthcare professionals, patients, relatives, and the general population.
Joana Margarida do Nascimento Fagundes Carvalho
Orientadores: Prof. Doutor Joaquim José Coutinho Ferreira Profª. Doutora Isabel Guimarães
Dissertação especialmente elaborada para obtenção do grau de Mestre em Neurociências
4 RESUMO
A doença de Parkinson (DP) idiopática é uma doença neurodegenerativa que se manifesta com sintomas motores e não-motores, um deles, a disartria hipocinética, que se insere nos sintomas motores e é caracterizada por uma diminuída inteligibilidade do discurso. A inteligibilidade diz respeito à forma como o sinal de um falante pode ser ou não compreendido pelo seu interlocutor podendo variar consoante o interlocutor. Objetivo principal: compreender como a disartria é compreendida por diferentes grupos de ouvintes. O primary outcome foi definido como sendo o total de palavras corretamente compreendidas por cada participante de cada grupo. Métodos: foram recolhidas avaliações motoras e gravações áudio de Doentes de Parkinson com diferentes níveis de disartria. Posteriormente foi reunido um júri que incluiu terapeutas da fala, neurologistas, doentes de Parkinson, familiares de doentes de Parkinson e pessoas sem qualquer tipo de contacto com a doença. O júri realizou uma análise áudio-percetiva das gravações procedendo a registos ortográficos de palavras e frases e análise de articulação, velocidade de fala, volume e inteligibilidade do discurso. Resultados: houve diferenças na percentagem de palavras corretamente compreendidas entre os grupos, tendo apresentado os neurologistas maior percentagem de acerto. Os piores scores em relação a velocidade, intensidade, articulação e compreensão de discurso foram associados a disartria severa. A articulação e a inteligibilidade do discurso foram parâmetros que mostraram uma tendência para diminuir a par com a gravidade da disartria, para todos os grupos de jurados, tendo sido mostrada também uma forte correlação entre os dois. Conclusões: o nível de inteligibilidade do discurso varia consoante os ouvintes e os grupos profissionais que trabalham com disartria diariamente têm mais facilidade em compreender o discurso dos Doentes de Parkinson, mesmo que os familiares que passam mais tempo com os doentes. Os defeitos de articulação são mais facilmente percecionados por qualquer interlocutor comparando com a intensidade ou velocidade do discurso, e a articulação parece estar correlacionada com a inteligibilidade do discurso. A percepção de ambas é mais difícil à medida que o grau de severidade de disartria evolui, para qualquer grupo de interlocutores.
Palavras-Chave: inteligibilidade; disartria; análise áudio-perceptiva; Doença de Parkinson;
5 ABSTRACT
Parkinson’s disease (PD) is a neurodegenerative disease with motor and nonmotor symptoms, one of them, hypokinetic dysarthria, is a motor symptom characterized by diminished speech intelligibility. Intelligibility concerns how a speaker's signal can be understood by his / her interlocutor and may be affected by factors intrinsic to the speaker but also by others associated with the listener. Improving speech intelligibility in PD is a therapeutic need.
Main goal: To understand how dysarthric speech is understood by different groups of listeners. The primary outcome was defined as the total number of words correctly understood by each participant of each group
Methods: Motor assessments and audio recordings of PD patients with different levels of dysarthria were collected. Subsequently, a panel was formed of speech therapists, neurologists, PD patients, relatives of PD patients and individuals without any contact with the disease. The panel conducted an audio-perceptual analysis of the recordings by orthographically transcribing words and sentences and performing articulation, speech velocity, volume and speech intelligibility analyses.
Results: There were differences in the percentage of words correctly understood between groups. Neurologists obtained the highest percentage. The worst results in terms of velocity, intensity, articulation and discourse comprehensibility were associated with severe dysarthria. The articulation and the discourse comprehensibility were parameters that showed a tendency to decrease with the severity of dysarthria, for all panel groups, and a strong correlation was also shown between the two.
Conclusions: The level of speech intelligibility varies according to the listeners. The professional groups working with dysarthria on a daily basis are the most likely to understand the discourse of PD patients, even when compared with the family members who spend the most time with the patients. Articulation defects are more easily perceived by all interlocutors compared to the intensity or speed of discourse, and articulation seems to be correlated with speech intelligibility. The perception of both is more difficult as the degree of severity of dysarthria evolves, for all groups of interlocutors.
6 TABLE OF CONTENTS Figures Index ... 8 Tables Index ... 9 Annexes Index ... 10 Abbreviations List ... 11 INTRODUCTION ... 12 Parkinson’s Disease ... 12 Hypokinetic Dysarthria ... 13
Voice and Speech Subsystems... 14
Respiration ... 14 Resonance ... 15 Articulation ... 15 Phonation ... 16 Prosody ... 16 Intelligibility of speech ... 17 Audio-perceptive analysis ... 18
Aims and hypotheses ... 19
METHODS... 21
Design of the study ... 21
Participants ... 21
Materials ... 22
Corpus – Selection and edition of audio-files recorded from PD patients ... 22
Information sheet ... 23
Informed Consent ... 24
Case Report Form (CRF) ... 24
Proceedings ... 24
Statistical analysis ... 25
RESULTS ... 27
Characterization of PD patients recorded for material purposes ... 27
Characterization of participants of jury panel ... 29
Primary outcome... 31
Differences in the hit percentage of dysarthric speech (words) between groups ... 31
Secondary outcomes ... 33
7
Inter-rater reliability calculated by means of percent agreement ... 34
Hit Percentage of words and sentences per level of dysarthria and per group... 35
Audio-perceptive analysis of conversation ... 38
Correlation between discourse comprehensibility and the other parameters ... 42
DISCUSSION ... 43
CONCLUSIVE REMARKS ... 49
AGNOWLEDGEMENTS ... 50
8 FIGURES INDEX
Figure 1: Triangular vowel space area of a healthy speaker and from a PD patient (dotted triangle)
16
Figure 2: Process of selecting words and sentences for each patient 23
Figure 3: percentage of words correctly transcribed per group and per level of dysarthria 36 Figure 4: percentage of sentences correctly transcribed per group and per level of
dysarthria
37 Figure 5: Audio-perceptive analysis of conversation parameter velocity per level of
dysarthria and by all panel groups
39 Figure 6: Audio-perceptive analysis of conversation parameter intensity per level of
dysarthria and by all panel groups
40 Figure 7: Audio-perceptive analysis of conversation parameter articulation per level of
dysarthria and by all panel groups
40 Figure 8: Audio-perceptive analysis of conversation parameter discourse comprehensibility per level of dysarthria and by all panel groups
9 TABLES INDEX
Table 1: Inclusion and exclusion criteria of the jury panel 21
Table 2: Demographical data and total scores from speech and global motor assessment of PD patients that were recorded for material purposes
27 Table 3: Current clinical problems and voice symptoms of PD patients that were recorded for material purposes
27
Table 4: Demographical data for panel groups 29
Table 5: Parkinson’s disease patient groups and their current clinical problems and voice symptoms
30
Table 6: Total number of words correctly understood in the intelligibility task by all participants, hit percentages, means and standard deviations by group
31
Table 7: Kruskall-Wallis pairwise comparisons for medians of words correctly understood
32
Table 8: Total of sentences correctly understood in the intelligibility task by all participants, hit percentages, means and standard deviations by group
33
Table 9: Kruskall-Wallis pairwise comparisons for medians of sentences correctly understood
34
Table 10: Interrater reliability for each group of judges 34
Table 11: percentage of words and sentences correctly transcribed per level of dysarthria 35 Table 12: parameters assessed for each conversation versus levels of dysarthria 38
10 ANNEXES INDEX
Annex I – Information sheet 60
Annex II – Informed consent 62
11 ABBREVIATIONS LIST
International Parkinson and Movement Disorder Society (MDS) Parkinson’s Disease (PD)
Substantia nigra pars compacta (SNpc) Monoamine oxidase B (MAO-B) Upper airway obstruction (UAO) Speech and Language Therapist (SLT)
Frenchay Dysarthria Assessment – 2nd edition (FDA-2) Clinical Global Impression (CGI)
12 INTRODUCTION
Parkinson’s Disease
The International Parkinson and Movement Disorder Society (MDS) defines Parkinson's disease (PD) as a neurodegenerative movement disorder, with predominant lesions in the basal ganglia, mainly in the substantia nigra, with a deficit of dopamine.1,2 PD was first described by Dr. James Parkinson in 1817 and is generally considered a progressive neurodegenerative disease with motor, nonmotor, and behavioural symptoms being among the most prevalent neurodegenerative conditions.3,4
The worldwide prevalence of PD varies widely.4 In Portugal, a 1994 study identified a prevalence of 130/100.0005 and currently the estimated total number of cases of PD for the Portuguese population is 180/100 000 inhabitants.6
The cardinal motor symptoms of the disease are: bradykinesia, rigidity, rest tremor, and postural instability.7 They are linked to the degeneration of dopaminergic neurons in the substantia nigra pars compacta (SNpc).1,8 The non-motor symptoms include mood changes, cognitive changes, orthostatic hypotension, constipation and early satiety, hyperhidrosis, seborrhea, urinary urgency and incontinence, sexual dysfunction, loss of sense of smell, sleep disorders, insomnia and excessive daytime sleepiness (rapid eye movement behavioural disorder or active dreaming, dream enactment, involuntary movements and vocalizations during sleep, restless leg syndrome/periodic limb movement disorder; fatigue), and sensory problems (pain, tightness, tingling, burning).7
These are related to the degeneration of other neuronal groups (e.g., serotoninergic neurons of the raphe nucleus, noradrenergic neurons of the locus ceruleus or cholinergic neurons of the nucleus basalis of Meynert).1,8
Pathophysiologically, PD is classified as a synucleinopathy.9,10 α-synuclein is an abundant neuronal protein that is highly enriched in presynaptic nerve terminals.11 Accumulation of misfolded oligomers and larger aggregates of α-synuclein define multiple neurodegenerative diseases including PD, but the mechanisms by which α-synuclein acts in neurodegeneration remains mostly unknown.9
The gradual loss of neurons results in a slow progression of symptoms and signs.12
Nevertheless, PD is considered as highly heterogeneous in the way that the clinical signs manifest and the rate of progression of the disease.13
There is no specific test or method for PD diagnosis and this presents a challenge because early symptoms can mimic those typical of normal aging or of other neurologic
13 diseases.14,15 Therefore, diagnosis is based on anamnesis, imaging tests, the response to
medications and the clinical criteria are based on the relative sensitivity and specificity of clinical signs.16 Currently, a variety of imaging techniques such as magnetic resonance imaging, diffusion tensor imaging, positron emission tomography, single-photon emission computed tomography and transcranial sonography may be used in the assessment of various parkinsonian syndromes.17 For the clinical diagnosis of PD, the MDS reviewed the diagnostic criteria in 2015 and currently they use a two-step process: first, parkinsonism is defined (bradykinesia in combination with either rest tremor, rigidity, or both) and the criteria then define whether this parkinsonism is attributable to PD.18 Before 2015 the UK Parkinson’s Disease Society Brain Bank Clinical Diagnostic Criteria were widely used.19
Drug therapies have tended to focus on replacing dopamine – the major-medical approach to treating PD - or addressing specific symptoms associated with the disease.2,8 Levodopa is still today the reference among anti-Parkinson’s therapies.20 Classifications of anti-PD medications include anticholinergics, dopamine agonists, amantadine, monoamine oxidase B (MAO-B) inhibitors, levodopa-carbidopa, and Catechol-o-methyl transferase inhibitors.21
Hypokinetic Dysarthria
Speech disorders were first mentioned in the description of PD by James Parkinson. He stated that “speech was slow, jerky and short of phrase… jolted out as it were, like an inexperienced rider on horseback, when the animal is trotting”.22 These features are attributed to hypokinetic dysarthria.
Dysarthria refers to a group of neurologic motor speech disorders, resulting from central and/or peripheral nervous system abnormalities and hypokinetic dysarthria is the typical speech disorder that presents in PD patients.23–25
Dysarthria classification is based on perceptual characteristics of speech and corroborated by the underlying neuropathology26, but in general they are characterised by slow, weak, imprecise or uncoordinated movements of the muscles responsible for speech .27 According to some authors, cranial motor deficits in the form of a hypokinetic dysarthria (and dysphagia) are reported in 90% of PD patients and there are studies that show an association of these with significant reductions in quality of life, social interactions and mental well-being.23,25,28,29
14 Hypokinetic dysarthria in PD typically shows reduced vocal loudness, flattened loudness and pitch inflections, poor voice quality, variable and frequently increased speech rate, inappropriate silences and breathiness.30–32 The combination of rigidity and bradykinesia have repercussions in respiratory, musculoskeletal and stomatognathic systems.33 Ultimately, respiration, phonation, articulation, resonance, and prosody are impaired in PD, these are the five subsystems responsible for speech and voice production.34–36
One shared characteristic in all dysarthrias is reduced speech intelligibility.23,34 Reduced intelligibility can have a critical impact on communication abilities and may limit vocational, educational, and social participation which can greatly interfere with quality of life that can be greatly diminished.34
Voice and Speech Subsystems Respiration
The respiratory cycle is composed of two phases37:
Inspiration: active phenomenon that implies the contraction of the diaphragm and accessory breathing muscles (external intercostals, anterior serrate, sternocleidomastoid, and scalene muscles) leading to expansion of the thoracic cage, creating a negative pressure allowing the lungs to expand;
Expiration: passive phenomenon where the relaxation of the inspiratory muscles allows the elastic recoil of the lungs and the thoracic cage, creating a positive pressure that expels the air out of the lungs.
Respiratory dysfunction which can strongly contribute to hypokinetic dysarthria, is a significant cause of morbidity and mortality in PD and is associated with increasing severity of PD.38–41 It may be characterized by a hyporespiratory pattern that may result from rigidity - irregular activation of agonist/antagonist muscles or by akinesia of the intercostal muscles leading to a limited movement of the thoracic cage.36,40 A study from 2010 divided respiratory dysfunction in PD into five subtypes: upper airway obstruction (UAO), restrictive disorders, complications of medication intake, complications of medication withdrawal, and aspiration pneumonia.37 Studies show that UAO contributes to 70% of hypophonia in PD, attributed to rigidity and fatigability of the thyroarytenoid muscles during vocalization.37,42
15 Resonance
Hypernasality may result from abnormalities in the involved structures, and in this case is called velopharyngeal insufficiency (e.g., cleft palate) or from distorted neuromuscular control of the levator veli palatini muscle and velopharyngeal seal, called velopharyngeal incompetence (e.g., neurodegenerative diseases like PD).43 In PD, because of the rigidity and bradykinesia, there are limitations of certain movements of the involved muscles, e.g., reduction of the opening of the mouth, that may interfere with patients resonance.30,36 Hypernasality results from a velopharyngeal impairment and has been reported in PD.26 It could be defined as “the presence of inappropriate air leakage through the nasal cavity during phonation”.26,44 Hypernasality in PD is not often perceived by the listener because of so many other dysarthria manifestations; studies have revealed that it was only perceptually detected in 10% to 30% of patients.26,45
Articulation
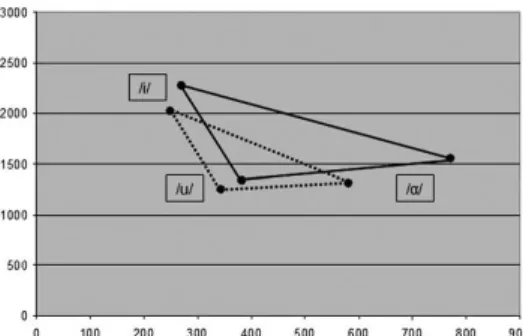
Imprecise vowel and consonant articulation is a common feature of dysarthria associated with PD which can be explained by a reduced amplitude of lips, tongue and jaw movements.16,30,46-47 Studies of physiologic measures of lip and tongue suggest slower rates of force and difficulty maintaining a given contraction.48 Vowels produced by individuals with dysarthria are characterized by articulatory undershoot (i.e., failure of the produced vowel to reach canonical formant frequencies – F1, F2), resulting in compressed or reduced working vowel space.49 F1 and F2 frequencies are mainly defined by the tongue position with the simplified ‘‘rule’’ that the F1 frequency is inversely related to the height of the tongue whereas the F2 frequency is directly related to the frontal tongue position.50 There is a restriction of articulatory gestures in PD and it is possible to note that on Triangular Vowel Space Area (Figure 1) assessed by plotting the F1 frequency as a function of F2 frequency for the vowels /a/, /i/, and /u/ in healthy controls and PD patients.47 Studies also show imprecise consonant articulation, usually those that require the most constriction like /p/, /b/ but also /s/, /f/, as well as /R/.51-52
16
Figure 1: Triangular vowel space area of a healthy speaker and from a PD patient (dotted triangle)47
Speech rate is the amount of speech produced per time unit and can be measured by the amount of time an individual spends articulating and the amount of pause time.53 Speech rate and rhythm are also compromised in PD which can be induced by complex dysfunction of planning, preparing and executing of motor speech sequences.54 Studies have shown that complex motor abnormalities seen in PD such as festination, hesitation, tremor, apraxias, akinesia, and dysprosody are also reflected in speech articulation.55-56 One of the most disabling axial symptoms in PD is festination, a tendency to speed up when performing repetitive movements and this was reported in gait, handwriting, and also in speech.57
Phonation
Resulting from rigidity and bradykinesia typical of PD, laryngeal, respiratory and thyroarytenoid muscle movements are limited; it is described as a reduced amplitude of vocal fold movements, irregular vocal fold vibrations or low variety of vibration that may lead to glottal incompetence.30,36,55,58-59 Consequently, this leads to reduced voice volume (hypophonia), poor initiation of phonation and a harsh and breathy voice.55,58-59 Another thing that may contribute to reduced voice volume is PD patients’ deficit in the perception of loudness.60
Prosody
Prosody consists of “distinct subdimensions, namely speech rhythm and velocity, articulation rate and speech to pause ratio, and speech intensity and pitch variation (the relative highness or lowness of a tone as perceived by the ear).30,56
17 Alterations in speech rate and pause time, and speech intensity and pitch variation are well described as being associated to PD.56 Inability to raise loudness of voice and vary pitch results in a low, monoloudness, monopitch and a hoarse voice.55
Intelligibility of speech
Intelligibility refers to how well a speaker’s acoustic signal can be accurately recovered by a listener or it can be defined as the degree to which the acoustic realization of one’s speech can be understood.34,61 However, it can be measured based solely on the sound signal, the so-called signal-dependent intelligibility or it can be based on the immediate acoustic signal and on cues from any other verbal (e.g. syntax, semantics) or non-verbal sources (e.g., facial expression, gesture, broader contextual setting).62-63 Signal-dependent intelligibility involves neither semantic/ syntactic context, nor visual aspects of communication like. gestures, but is purely determined by the performance of the speech production system.61
Typically, this signal-dependent intelligibility is measure by having listeners orthographically transcribe words or sentences that the speaker had read and a score is calculated dividing the number of words understood and the total number of words spoken.63 In this process, it is important to note that there are two stakeholders: a speaker who produces an acoustic signal for the purposes of conveying linguistic content and a listener who receives the signal and interprets the linguistic content.64
Thus, both production-related variables associated with the speaker and perception-related variables associated with the listener play key roles in intelligibility.64 In a clinical context, the speech therapist listens to and rates the patient’s utterances and this rating is consequently subjective as it is influenced by the listener’s familiarity with the patient’s voice, background and type of disorder and familiarity with the test material used.61
Intelligibility may influence the termination or continuation of treatment and in severe cases, the consideration of augmentative and alternative communication systems.65 It is one of the main criteria used for the assessment of severity of speech disorders and improved intelligibility often constitutes a main goal of therapy.66 This is why a comprehensive understanding of the factors that influence intelligibility and its measurement is critical.65 Research has shown that intelligibility may be affected by many variables like:
18
Message:
o The speaker’s task e.g., saying words vs. sentences.64 o Message predictability.67
o Message length.65
o Linguistic information e.g., real words vs. not real words.61 o Visual-facial information.68
Environment/ Context:
o The transmission system e.g., live voice vs. recorded voice.64
o Contextual cues.69 Listener:
o Familiarity.65
o Listener experience.70
Audio-perceptive analysis
Speech perception and comprehension often involves the need to recognize degraded or unclear speech sounds.71 Speech comprehension comprises several hierarchically-organized processing stages – lower-level acoustic and phonetic features are identified and (potentially) categorized into larger units (phonemes or syllables) to recognize familiar words and then access syntactic and semantic properties.71 The speed and accuracy of human speech comprehension when challenged by perceptual ambiguity is considered remarkable by Davis et al. as it seems to imply a neural hierarchy—temporal (left temporal cortex) and frontal regions (left frontal operculum; precentral gyrus; left anterior insula) with multiple processing pathways, activation of the superior temporal gyrus (STG) close to the primary auditory cortex—seen in functional neuroimaging data.71–74
Evidence suggests that there are four top-down processes that contribute to speech perception: (1) perceptual grouping of speech sounds into a single coherent stream, (2) segmentation of speech into meaningful lexical units, (3) perceptual learning mechanisms by which distorted and degraded speech is perceived and understood and (4) mechanisms for perceiving variable forms of speech in a categorical fashion.75
19 According to the Davis et al. these top-down processes are influences that act on auditory, echoic representations of incoming speech, and there are influences that arise from the interface between speech perception and speech production.75
A study from 2012 unequivocally demonstrated that clear speech can be processed even when ignored but degraded speech is processed depending on the listener’s state of attentiveness.76
Aims and hypotheses
The main planned objective of this study was to understand how dysarthric speech is understood by different groups of listeners. In particular we sought to examine auditory sensitivity to dysarthria by different interlocutors who are part of PD patients’ everyday life. The main hypothesis for this study was that different groups of listeners—speech and language therapists (SLTs), general population, relatives of PD patients, PD patients and neurologists,—would have different hit percentages in intelligibility tasks with words and sentences recorded from PD patients distinguished with different degrees of severity of dysarthria.
The secondary objectives planned for this study were:
1) To determine the inter-rater reliability within each group of listeners for the intelligibility tasks.
2) To determine if SLTs have a higher inter-rater reliability in their ratings of dysarthric speech when compared with naive listeners.
3) To determine whether listeners with greater interaction with PD (e.g., family members) have higher scores for the intelligibility tasks than the other groups.
4) To determine whether PD patients can more easily understand the dysarthric speech associated with PD than the other groups.
It was also hypothesized for this study that different groups of listeners would have different perception with regards to speech articulation, speech velocity, speech intensity or volume, and discourse comprehensibility, and this perception would differ according to dysarthria severity. The more severe the dysarthria, the worse the scores for each of these parameters.
Therefore, the primary outcome was defined as the total number of words correctly understood by each participant in each group. Secondary outcomes included the total
20 number of sentences correctly understood by each participant in each group and the mean scores of parameters assessed for each conversation including velocity, intensity, articulation and discourse comprehensibility, for each level of dysarthria severity.
21 METHODS
Design of the study
This is an observational cross-sectional study.
Participants
A panel was formed to listen to the corpus or recordings and to orthographically transcribe and register the words and sentences and also perform a perceptive analysis through the conversation samples. The panel was constituted of different interlocutors who normally have a relevant role in the daily life of a PD patient with different levels of familiarity, knowledge and experience with dysarthric speech.
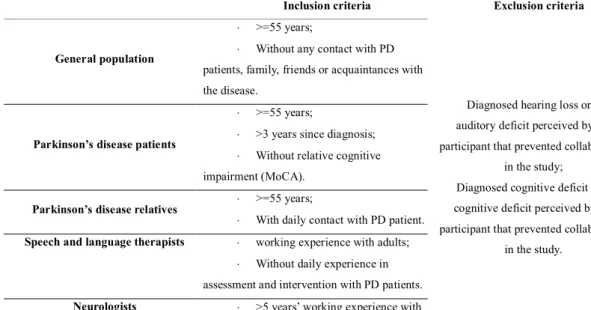
The panel was composed of ten people from the general population who had no contact or experience with PD patients; 10 PD patients; 10 relatives; 10 neurologists and 10 SLTs. Participants were recruited from hospitals, centers of rehabilitation medicine and the senior neurological campus. Inclusion and exclusion criteria of the - panel are summarized in table 1. Demographical data from the different groups and patients’ clinical problems are presented at tables 4 and 5.
Inclusion criteria Exclusion criteria
General population
>=55 years;
Without any contact with PD patients, family, friends or acquaintances with the disease.
Diagnosed hearing loss or any auditory deficit perceived by the participant that prevented collaboration
in the study;
Diagnosed cognitive deficit or any cognitive deficit perceived by the participant that prevented collaboration
in the study.
Parkinson’s disease patients
>=55 years;
>3 years since diagnosis;
Without relative cognitive impairment (MoCA).
Parkinson’s disease relatives >=55 years;
With daily contact with PD patient.
Speech and language therapists working experience with adults;
Without daily experience in assessment and intervention with PD patients.
Neurologists >5 years’ working experience with PD patients;
22 Materials
Corpus – Selection and edition of audio-files recorded from PD patients
First audio files were collected—words, sentences and conversation—of PD patients, and the associated demographic information, global motor assessment, level of dysarthria and speech characterization were made by an experienced SLT. All this information was from the “Fralusopark - Dysarthria in Parkinson’s Disease: Lusophony vs. Francophony Comparison”77 project database and was provided by JJ Ferreira Lab,
Instituto de Medicina Molecular. All patients are native Portuguese speakers, right-handed (Handedness Edinburgh test >80%)78, with a medical diagnosis of Idiopathic PD according to the UK Parkinson’s Disease Brain Bank Criteria79 for the diagnosis of idiopathic PD.
From a database of sixty patients, ten PD patients who fulfilled the following criteria: male, >55 years old were included, three of these patients were diagnosed with mild dysarthria, three with moderate, three with severe dysarthria and one without dysarthria, the control subject. Only men were recruited in order to control the variable sex since there are differences between sexes in terms of speech characteristics which could influence the results. Speech diagnosis was performed by an SLT expertise in the assessment and treatment of acquired sensoriomotor speech disorders, using Frenchay Dysarthria Assessment – 2nd edition (FDA-2) protocol and a Clinical Global Impression (CGI) scale. The level of dysarthria severity level was analyzed by two other SLTs experienced in PD assessment and intervention. They performed an audio-perceptive analysis of the recordings also using CGI. All the SLTs agreed on the inclusion of the patients who were included in the present study. Demographical data and total scores from speech and global motor assessment are presented in the results section as patients’ current clinical problems.
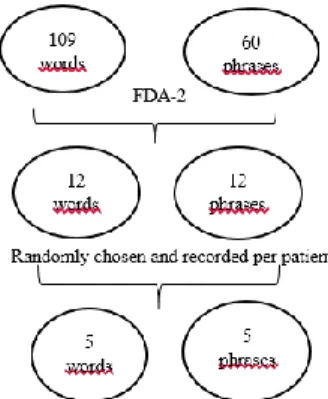
The audio-files selected from each patient include 5 single words and 5 phrases randomly chosen from a set of 12 words and phrases read by the patients. These words and phrases were also randomly chosen from a set of 109 words and 60 phrases available – illustrated in figure 2. They also included twenty seconds of a conversation cut from a two-minute conversation between the PD patient and the SLT in a way that the SLT does not interfere in the sample selected. A total of 50 different words, 50 different sentences and 10 conversation samples were finally selected. These words and sentences were part of the intelligibility tasks of FDA-2 that include a group of samples
23 with strong correlations in terms of distribution of frequency of phonemes, word length and type of syllabic structure involved. All patients were recorded in a quiet room with special speech recording equipment (Marantz PMD661 MKII recorder). Using Audacity software, the fifty words were put together in one single audio-file with silent intervals in between each word. In another single audio file the sentences were put together with a silent interval in between each. This time intervals were established so that the listener had time to write down the word.
Figure 2: Process of selecting words and sentences for each patient
Information Sheet
An information sheet was prepared for panel members. This sheet collected information including: research project title, purpose, proceedings, possible benefits, predictable physical risks, voluntary form of participation and right to leave the study, the use of data, and contact details. The participants had access to this information sheet before agreeing to participate in the study. If, after reading all this information and taking all doubts into consideration, the participant agreed to proceed, an informed consent was presented in order to obtain his/her consent. ANNEXE I
The researcher was present during orthographic annotations in order to make sure that each file (word or sentence) was only reproduced once, to ensure the intelligibility of the participants’ writing and to make sure that none of the parameters to be evaluated was forgotten.
24 Informed Consent
The informed consent sheet explained that the participant was part of a research project title, and informed on the purpose, proceedings, possible benefits, predictable physical risks, voluntary form of participation and right to leave the study, the use of data and contact details. To confirm acceptance, the participant signed the form as did the investigator. The original document remains with the investigator and a duplicate with the participant. ANNEXE II
Case Report Form (CRF)
A CRF was created to be completed by the investigator with demographic data of the panel, and blank spaces provided so that the panel members could transcribe the words (50 blank spaces) and the sentences (50 blank spaces). Ten tables were also included that consisted of four parameters each—speech velocity, intensity, articulation and speech comprehension—and 5-Likert type options per parameter (two options below the normal one, the normal option and two more above), to select according to the perceptual analysis of the conversation – ANNEXE III.
Proceedings
First the panel members were informed about dysarthria and intelligibility of speech concepts by reading the information sheet. The proceedings were described and if the participant wished to continue, they signed the informed consent. The audio files–words and sentences—were presented separately, only once, via headphones. Between each word there was a four second interval and between each sentence a seven second interval. Extra time for intervals was dictated by the transcription pace of the listeners or, other reasons: if a panel member asked, if the panel member paused to think about what had been heard before writing it down, if a panel member was tired; if for some reason a panel member asked. The investigator controlled the playing of audio-files and was prepared to pause if necessary. The panel members were instructed to write down what they heard in capital letters so that the investigator could understand what was written down.
25 Then, before the conversation audio/perceptive analysis of four parameters that the panel assessed—speech velocity, intensity, articulation and speech comprehension— were described in the CRF and examples were given for each one. The proceedings were described. Each table had the four parameter listed and each parameter had 5 options to characterize the conversation sample:
Speech velocity: very slow (0), slow (1), normal/ adequate (2), fast (3), very fast (4) Intensity: very low (0), low (1), normal/ adequate (2), loud (3), very loud (4)
Articulation: very bad (0), bad (1), normal/ adequate (2), good (3), very good (4)
Understanding speech: very difficult (0), difficult (1), normal/ adequate (2), easy (3), very easy (4).
For statistical analysis purposes, each classification corresponded to a value reported between parentheses. The conversation was played once. If the panel member considered part of the conversation with one characteristic and another part differently, it was possible to select two or more options for each parameter.
Statistical Analysis
Characterization of PD patients’ recordings was reported by describing the following variables: age (mean and standard deviation), years of education (mean and standard deviation), place of birth and living place since when, first symptoms and diagnosis data, total scores of FDA-2 (mean ± SD, max and min.) and MDS-UPDRS (mean ± SD, max and min.). The clinical problems and voice symptoms were also reported and percentage values presented.
Characterization of the participants from the panel was reported by calculating the mean and standard deviation for the quantitative variables and counts and percentages for categorical variables.
The total of words correctly understood in the intelligibility task by all participants was calculated and presented by hit percentages, and means and standard deviations per group. Whether the data followed a normal distribution for all groups was verified with a Shapiro Wilk test and homogeneity of the variances with a Levene’s Test. For the comparison of results of correct orthographic transcription of words between the groupsa Kruskall-Wallis test was performed, and because the the homogeneity of the variance (Levene’s test) was not verified, a non-parametric test was chosen. The test was adjusted for tied ranks and follow-up tests were conducted to evaluate pairwise differences among the 5 groups and the effect size for pairwise comparisons was
26 presented with statistically significant values. The same methodology was followed to study the correct orthographic transcription of sentences .
To examine inter-rater reliability—considered the measurement of the extent to which raters assign the same score to the same variable—within each group, the percent agreement was calculated, and which consisted of the number of agreement scores divided by the total number of scores.80 For this it “correct” or “not correct” transcribed words or sentences were considered—a perfect match between all words and phonemes spoken and written by the panel.
The hit percentage of words and sentences was calculated per dysarthria severity level and per group.
The audio-perceptive analysis of speech samples was also examined and the four variables classified—articulation, speech velocity, intensity and ease of comprehension—mean values ± SD were calculated in relation to the level of dysarthria and also per group.
All descriptive and inferential results were obtained using SPSS ® Software, version 20.0 (SPSS, Inc., Chicago, IL) and p-values less than 0.05 were considered significant.
27 RESULTS
Characterization of PD patients recorded for material purposes
Subjec t Number Ag e Place of Birth Living Place (since) Years of Education First Simptoms Date of the Diagnosis FDA-2 Scores MDS-UPDRS Scores Level of Dysarthria 1 59 Lisboa Lisboa (always) 11 2010 2012 98 113 Normal 2 75 Alfeiri a Alfreiria (always) 2 1998 2000 90 193 Ligeiro 3 75 Torres Vedras Torres Vedras (always) 5 2005 2005 85,5 217 Ligeiro 4 67 Lisboa Lisboa (always) 10 2013 2014 97 148 Ligeiro 5 72 Elvas Lisboa (1964) 4 2010 2012 89,5 151 Moderado 6 61 Proenç a a Nova Lisboa (1972) 4 2000 2002 85 169 Moderado 7 79 Vale de Cambra Lisboa (1962) 18 2000 2000 81 181 Moderado 8 72 Viana do castelo Lisboa (1968) 4 2005 2005 84,5 225 Grave 9 78 Torres Vedras Torres Vedras (since ever) 16 ND 2000 57 182 Grave 10 84 Lisboa Lisboa (>30 years) 14 ND 2002 72,5 197 Grave Mean ± SD 72. 2 ± 7.9 8.8 ± 5.8 84.0 ± 12.0 177.6 ± 33.8
Table 2: Demographical data and total scores from speech and global motor assessment of PD patients that were recorded for material purposes. ND meaning “no data”.
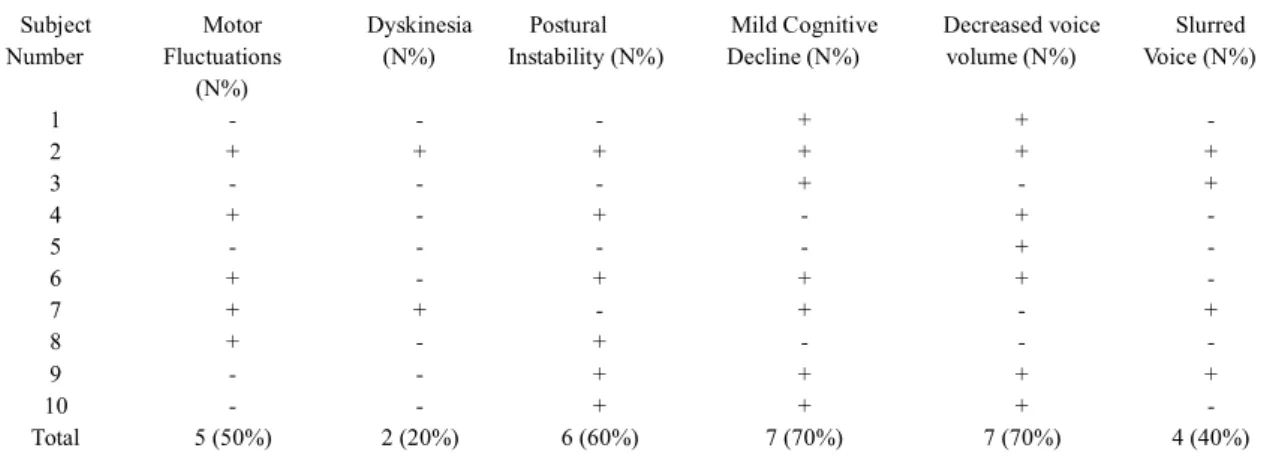
Subject Number Motor Fluctuations (N%) Dyskinesia (N%) Postural Instability (N%) Mild Cognitive Decline (N%) Decreased voice volume (N%) Slurred Voice (N%) 1 - - - + + - 2 + + + + + + 3 - - - + - + 4 + - + - + - 5 - - - - + - 6 + - + + + - 7 + + - + - + 8 + - + - - - 9 - - + + + + 10 - - + + + - Total 5 (50%) 2 (20%) 6 (60%) 7 (70%) 7 (70%) 4 (40%)
Table 3: current clinical problems and voice symptoms of PD patients that were recorded for material purposes. + means it’s present; - means it’s not present
This sample was composed by ten men who had a mean age of 72.2 years ± 7.9 SD
28 30 years. Regarding symptoms, 8 individuals with first PD symptoms a maximum 2 years prior to diagnosis, 2 individuals with no data; 3 with 17 years since PD diagnosis, 2 individuals with 15 years of PD, 2 individuals with 12 years, and 2 with 5 years, 1 with 3 years of PD. The group had a mean FDA-2 score of 84.0 ± 12.0 SD, min 57 and max 98, with a mean MDS-UPDRS score of 177.6 ± 33.8 SD, min 113 and max 225. Data are presented in table 2.
Regarding current clinical problems and voice symptoms, 7 patients had mild cognitive decline (assessed with MoCA) and perceived decreased voice volume, 6 reported postural instability, 5 motor fluctuations, 4 slurred voice and 2 dyskinesia. Data are presented in table 3.
The level of dysarthria was defined by 3 SLTs experienced in PD disease. All of them perceptually classified dysarthria severity levels, 2 by listening to the recordings, and one face-to-face who also performed a complete assessment including FDA-2 and MDS-UPDRS. These patients were classified the same by the 3 SLTs regarding severity levels of dysarthria.
29 Characterization of participants of panel
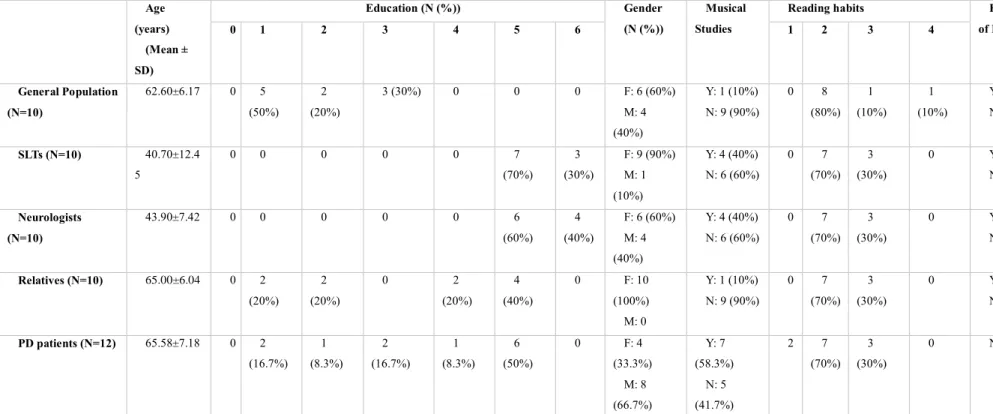
Age (years) (Mean ± SD) Education (N (%)) Gender (N (%)) Musical Studies
Reading habits Knowledge of PD 0 1 2 3 4 5 6 1 2 3 4 General Population (N=10) 62.60±6.17 0 5 (50%) 2 (20%) 3 (30%) 0 0 0 F: 6 (60%) M: 4 (40%) Y: 1 (10%) N: 9 (90%) 0 8 (80%) 1 (10%) 1 (10%) Y: 8 (80%) N: 2 (20%) SLTs (N=10) 40.70±12.4 5 0 0 0 0 0 7 (70%) 3 (30%) F: 9 (90%) M: 1 (10%) Y: 4 (40%) N: 6 (60%) 0 7 (70%) 3 (30%) 0 Y: 10 (100%) N: 0 Neurologists (N=10) 43.90±7.42 0 0 0 0 0 6 (60%) 4 (40%) F: 6 (60%) M: 4 (40%) Y: 4 (40%) N: 6 (60%) 0 7 (70%) 3 (30%) 0 Y: 10 (100%) N: 0 Relatives (N=10) 65.00±6.04 0 2 (20%) 2 (20%) 0 2 (20%) 4 (40%) 0 F: 10 (100%) M: 0 Y: 1 (10%) N: 9 (90%) 0 7 (70%) 3 (30%) 0 Y: 10 (100%) N: 0 PD patients (N=12) 65.58±7.18 0 2 (16.7%) 1 (8.3%) 2 (16.7%) 1 (8.3%) 6 (50%) 0 F: 4 (33.3%) M: 8 (66.7%) Y: 7 (58.3%) N: 5 (41.7%) 2 7 (70%) 3 (30%) 0 NA
Table 4: Demographical data for jury panel groups. Education level: 0 – Preschool; 1 - Elementary school; 2 - Middle School; 3 - High School; 4 - Further education, not higher; 5 - Higher education; 6 - Doctoral degree. Reading habits: 1 – without; 2 – daily; 3 – weekly; 4 - monthly
30 The PD patient group was constituted of 12 participants while the other groups comprised 10 participants each. The mean age was between 40 and 45 for SLTs and neurologists, and between 62 and 66 years for the other groups. Concerning education, SLTs and neurologists were the groups with the most years of education, 70% of SLTs and 60% of neurologists with higher education—bachelor's or master's degree—and 30% of SLTs and 40% of neurologists with a doctoral degree. Regarding sex, all groups except PD patients were constituted of a majority of women. None had undergone musical studies. In all groups there were a higher percentage of participants with daily reading habits and knowledge of PD. Data are presented in table 4.
Subject Number Motor Fluctuations (N%) Dyskinesia (N%) Freezing (N%) Hallucinations or delirium (N%) Decreased voice volume (N%) Slurred Voice (N%) Hoarseness (N%) MoCA scores 1 + + - + + + - 24 2 + - - + + - + 24 3 - - - - + - + 27 4 + - + - + + - 22 5 - - - - + - + 21 6 + + + + + + + 18 7 - - - + 26 8 - - - - + - - 26 9 - - - - + - + 29 10 - - + - + + - 26 11 + - - - + + - 27 12 - - + - + - + 27 Total 5 (41.7%) 2 (16.7%) 4 (33.3%) 3 (25.0%) 11 (91.7%) 5 (41.7%) 7 (58.3%) Mean 24.8 ± 3.1 SD
Table 5: Parkinson’s disease patients group and their current clinical problems and voice symptoms. + means it’s present; - means it’s not present. MoCA scores ≤ 18 means
31 Regarding current clinical problems and voice symptoms of the PD patient group, 11 patients reported decreased voice volume, 7 reported hoarseness, 5 motor fluctuations and slurred voice, 4 freezing, 3 hallucinations or delirium and 2 dyskinesia. Data are presented in table 5.
In terms of frequency of contact with PD patients, relatives spent a mean 6.7 ± 0.3 days per week with PD patients and a mean of 14.3 ± 3.4 hours per day, while neurologists spent a mean 4.6 ± 0.3 days per week with PD patients and 4.4 ± 0.6 hours per day.
In terms of professional experience, SLTs reported a mean 17.9 ± 3.9 years experience working with adults, and neurologists a mean of 16.4 ± 2.8 years working with movement disorders, particularly with PD.
Primary outcome
Differences in the hit percentage of dysarthric speech (words) between groups
Table 6 presents the results established for the primary outcome—total number of words correctly understood by each participant of each group, the total hit percentage and the mean and standard deviation values for each group.
Participa nts General Population N = 10 SLTs N = 10 Neurologi sts N = 10 Relativ es N = 10 PD patients N = 12 1 27 33 37 31 28 2 29 30 36 28 22 3 33 34 33 20 26 4 31 31 39 37 22 5 28 31 35 31 34 6 33 37 35 28 20 7 30 33 35 30 22 8 31 33 33 33 31 9 27 35 33 33 28 10 32 37 36 32 35 11 35 12 34 Total (%) 60.2% 66.8% 70.4% 60.6% 56.2% Mean ± SD 30.1 ± 2.3 33.4 ± 2.4 35.2 ± 1.9 30.3 ± 4.5 28.1 ± 5.7
Table 6: Total of words correctly understood in the intelligibility task by all participants’, hit percentages, means and standard deviations by group. Each participant heard a total of 50 words.
32 Results show differences in the hit percentage of words correctly understood between groups. In ascending order PD patients < general population < relatives < SLTS < neurologists.
There was a normal distribution for all groups (Shapiro Wilk test: p-value > α) but the assumption of the homogeneity of the variances was not verified (Levene Test: p-value = 0.00 < α). A non-parametric Kruskal-Wallis test was conducted in order to evaluate overall differences among groups regarding median of total number of words correctly understood. The results of the analysis indicate that there are significant overall differences between the medians of the total words correctly annotated by the five groups, χ2 (4, N = 52) = 19.0, p = 0.00 with a mean rank of 18.7 for the general
population, 33.2 for SLTs, 41.7 for neurologists, 22.0 for relatives and 18.7 for PD patients. The effect size was not high, η2= χ2/N-1, η2=0.4. Because the overall test is significant, pairwise comparisons among the 5 groups were completed and are presented in table 7.
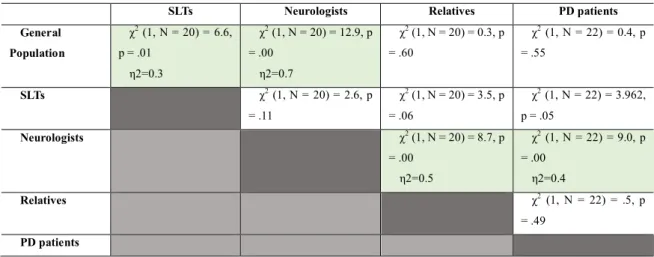
SLTs Neurologists Relatives PD patients General Population χ2 (1, N = 20) = 6.6, p = .01 η2=0.3 χ2 (1, N = 20) = 12.9, p = .00 η2=0.7 χ2 (1, N = 20) = 0.3, p = .60 χ2 (1, N = 22) = 0.4, p = .55 SLTs χ2 (1, N = 20) = 2.6, p = .11 χ2 (1, N = 20) = 3.5, p = .06 χ2 (1, N = 22) = 3.962, p = .05 Neurologists χ2 (1, N = 20) = 8.7, p = .00 η2=0.5 χ2 (1, N = 22) = 9.0, p = .00 η2=0.4 Relatives χ2 (1, N = 22) = .5, p = .49 PD patients
Table 7: Kruskall-Wallis pairwaise comparisons for medians of words correctly understood
There are significant differences between the general population and SLTs, the general population and neurologists, neurologists and relatives, and neurologists and PD patients because, in these cases, p-value < α and the highest effect size was between neurologists and the general population, η2=0.678.
33 Secondary outcomes
Differences in the hit percentage of dysarthric speech (sentences) between groups Table 8 presents the total number of sentences correctly understood by each participant of each group, the total hit percentage and the mean and standard deviations for each group. Participa nts General Population SLTs Neurologi sts Relati ves PD patients 1 31 34 37 31 36 2 33 34 39 30 29 3 37 39 42 25 27 4 31 39 37 36 23 5 39 35 38 37 35 6 37 42 35 30 27 7 26 34 38 35 23 8 37 36 36 35 30 9 32 36 36 37 35 10 36 36 37 36 33 11 33 12 36 Total (%) 67.8% 73.0 % 75.0% 66.4% 61.2% Mean ± SD 33.9±4.0 36.5± 2.7 37.5±2.0 33.2±4 .0 30.6±4.8
Table 8: Total number of sentences correctly understood in the intelligibility task by all participants, hit percentages, means and standard deviations by group. Each participant heard a total of 50 words.
Results show differences in the hit percentage of words correctly understood between groups. In ascending order PD patients < relatives < general population < SLTs < neurologists.
There was a normal distribution for all groups (Shapiro Wilk test: p-value > α) but the assumption of the homogeneity of the variances was not verified (Levene Test: p-value = 0.00 < α). As for the words intelligibility task, a non-parametric Kruskal-Wallis test was conducted in order to evaluate overall differences among groups regarding the median of the total number of sentences correctly understood. The results of the analysis indicate that there are significant overall differences between the medians of the total sentences correctly annotated by the 5 groups, χ2 (4, N = 52) = 18.0, p = 0.00 with a mean rank of 26.0 for general population, 32.4 for SLTs, 39.9 for neurologists, 22.4 for relatives, and 14.3 for PD patients. The effect size was not high, η2= χ2/N-1, η2=0.4.
34 Because the overall test is significant, pairwise comparisons among the 5 groups were completed and are presented in table 9.
SLTs Neurologists Relatives PD patients General Population χ2 (1, N = 20) = 1.4, p = .24 χ2 (1, N = 20) = 4.0, p = .05 χ2 (1, N = 20) = 0.6, p = .45 χ2 (1, N = 22) = 3.0, p = .09 SLTs χ2 (1, N = 20) = 1.7, p = .19 χ2 (1, N = 20) = 3.5, p = .06 χ2 (1, N = 22) = 7.8, p = .01 η2=0.4 Neurologists χ2 (1, N = 20) = 7.612, p = .01 η2=0.4 χ2 (1, N = 22) = 13.318, p = .00 η2=0.6 Relatives χ2 (1, N = 22) = 2.3, p = .13 PD patients
Table 9: Kruskall-Wallis pairwaise comparisons of median number of sentences correctly understood
There are significant median differences between SLTs and PD patients, neurologists and relatives, and neurologists and PD patients because, in these cases, p-value ≤ α and the highest effect size was between neurologists and PD patients η2=0.6.
Comparing the hit percentages between words and sentences, there were higher values in all groups for correct orthographic transcription of sentences than words.
Inter-rater reliability calculated by means of percent agreement
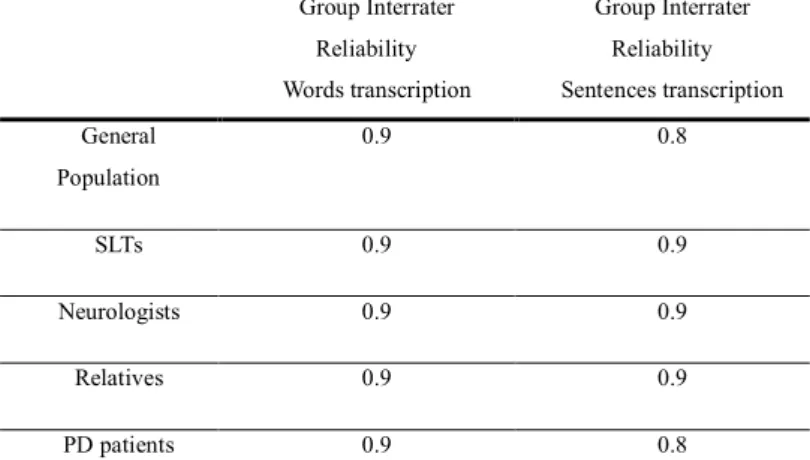
Group Interrater Reliability Words transcription Group Interrater Reliability Sentences transcription General Population 0.9 0.8 SLTs 0.9 0.9 Neurologists 0.9 0.9 Relatives 0.9 0.9 PD patients 0.9 0.8
35 For the analyses of the interrater reliability, words and sentences were considered correct or not correct. The overall interrater reliability for each group was higher than 0.8, which demonstrates an almost perfect agreement between the panel members in the correct orthographic transcription of words—the majority of the panel members correctly transcribed the same words.
The same occurred for sentences, except for the PD patient group who demonstrated a strong agreement between the panel members of the correct orthographic transcription of sentences.
Data are presented in table 10.
Hit Percentage of words and sentences per level of dysarthria and per group
Words Sentences Without Dysarthria Mild Dysarthria Moderate Dysarthria Severe Dysarthria Without Dysarthria Mild Dysarthria Moderate Dysarthria Severe Dysarthria N (%) 97.7% 67.3% 78.3% 30.4% 82.7% 77.1% 77.6% 45.8%
Table 11: percentage of words and sentences correctly transcribed per level of dysarthria.
In descending order of hit percentage of words correctly transcribed per level of dysarthria, without dysarthria > moderate dysarthria > mild dysarthria > severe dysarthria. The same happened with sentences correctly transcribed. These results are shown in table 11.
36
Figure 3: percentage of words correctly transcribed per group and per level of dysarthria. Trend line represented in dashed lines.
Looking at the data presented in figure 3 it is possible to notice a group that stands out because of their lower values in the orthographic transcription of words, this was the PD patient group, who had the lowest values for all degrees of dysarthria severity except for severe dysarthria where the relatives group had the lowest hit percentage. The neurologist group had the highest values for mild and moderate dysarthria. The general population group presented the highest values for severe dysarthria, compared with other groups. SLTs presented a 100% correct transcription of words corresponding to the control participant, without dysarthria.
All groups had lower scores for mild dysarthria less compared with moderate dysarthria. For all groups, the hit percentage of correctly transcribed words was higher for people without dysarthria and lower for people with severe dysarthria.
GP SLTs Neurologists Relatives PD patients Without Dysarthria 98,0% 100,0% 98,0% 98,0% 93,3% Mild 64,0% 77,3% 86,0% 68,7% 57,8% Moderate 72,7% 83,3% 87,3% 75,3% 71,1% Severe 30,7% 28,7% 28,0% 26,7% 27,2% 0,0% 10,0% 20,0% 30,0% 40,0% 50,0% 60,0% 70,0% 80,0% 90,0% 100,0%
Without Dysarthria Mild
Moderate Severe
37
Figure 4: percentage of sentences correctly transcribed per group and per level of dysarthria. Trend line represented in dashed lines.
Looking at the data presented in figure 4 it is possible to notice that the PD patient group had the lowest values for the orthographic transcription of sentences for all dysarthria severity levels, except for the control participant without dysarthria for which the relatives group had the lowest hit percentage, similarly to the intelligibility of words task. The SLT group had the highest values for mild and moderate dysarthria and had the same hit percentage of correct transcribed words for the control participant and mild dysarthria group. Neurologists presented the highest values for severe dysarthria, compared with the other groups and for the control participant, without dysarthria.
Something that was not expected and can be observed when comparing the correct hit percentages of general population and relatives groups between mild and moderate dysarthria, is that for mild dysarthria these groups obtained lower scores. For all groups, the hit percentage of correctly transcribed words was lower for people with severe dysarthria.
GP SLTs Neurologists Relatives PD patients Without dysarthria 82,0% 84,0% 92,0% 74,0% 81,7% Mild 76,0% 84,0% 82,0% 73,3% 71,1% Moderate 79,3% 82,7% 81,3% 78,0% 68,3% Severe 43,3% 48,7% 56,0% 45,3% 37,2% 0,0% 10,0% 20,0% 30,0% 40,0% 50,0% 60,0% 70,0% 80,0% 90,0% 100,0%
Without dysarthria Mild
Moderate Severe
38 Audio-perceptive analysis of conversation
The audio-perceptive analysis of conversation included four parameters: velocity, intensity or volume, articulation of words, and discourse comprehensibility. The results analyzed per dysarthria severity level are shown in table 12.
Dysarthria Parameters Without Mean±SD Mild Mean±SD Moderate Mean±SD Severe Mean±SD Velocity 1.9±0.5 1.8±0.8 1.4±0.8 1.4±1.1 Intensity / Volume 2.2±0.4 2.1±0.7 2.1±0.7 1.1±1.0 Articulation of words 2.9±0,7 2.0±0,9 1.5±0.7 0.8±1.0 Discourse comprehensibility 2.9±0.8 2.4±0.9 2.1±0.8 0.9±1.0
Table 12: Parameters assessed for each conversation versus levels of dysarthria.
In terms of mean values, in descending order of parameters considered good or normal to parameters considered bad or very bad: without dysarthria > mild dysarthria > moderate dysarthria > severe dysarthria.
Mean values for those without dysarthric conversation classified speech with normal velocity, between normal and loud intensity or volume, between normal and very good articulation of words and between normal and very easy understanding of speech.
Mild dysarthria was classified with values between slow and fast velocity, low and loud intensity or volume, bad and good articulation of words, difficult and easy understanding of speech.
Moderate dysarthria received values between slow and normal velocity, low and loud intensity or volume, bad and normal/adequate articulation, difficult and ease of understanding.
Severe dysarthria was the only group of conversations receiving classifications of very slow velocity, very low intensity or volume, very bad articulation and very difficult to understand speech understanding.
39
Figure 5: Audio-perceptive analysis of conversation parameter velocity per level of dysarthria and by all jury groups
In terms speech velocity of, SLTs were the most critical group of the control participant with a mean value of 1.5, which still corresponds to normal/adequate velocity as well as the perception of all the other panel groups. PD patients and general population groups were the most critical groups for mild dysarthria, but all groups presented mean values corresponding to normal/adequate velocity. Still, it is noteworthy that SLTs were more judgmental of the control participant than of the mild dysarthria group as far as this parameter was concerned. For moderate dysarthria, all groups presented mean values which corresponded to slow velocity, except for SLTs who had a mean score of 1.5 rounded to normal/adequate velocity of speech as in severe dysarthria, presenting a mean of 1.7. All the other panel groups’ mean values for severe dysarthria corresponded with slow velocity, the relatives group was the most judgmental.
Data are presented in figure 5.
GP SLTs Neurologists Relatives PD patients
Without dysarthria 2,00 1,50 2,00 2,25 2,04 Mild 1,63 1,80 1,75 1,88 1,64 Moderate 1,13 1,53 1,37 1,37 1,26 Severe 1,43 1,73 1,45 0,90 1,19 0,00 0,50 1,00 1,50 2,00 2,50
40
Figure 7: Audio-perceptive analysis of conversation parameter articulation per level of dysarthria and by all jury groups
GP SLTs Neurologists Relatives PD patients
Without dysarthria 2,70 2,90 3,10 3,00 2,58 Mild 2,00 2,30 1,58 2,05 1,82 Moderate 1,63 1,55 1,20 1,60 1,43 Severe 1,00 0,75 0,52 0,85 0,68 0,00 0,50 1,00 1,50 2,00 2,50 3,00 3,50
Without dysarthria Mild Moderate Severe
Figure 6: Audio-perceptive analysis of conversation parameter intensity per level of dysarthria and by all panel groups
GP SLTs Neurologists Relatives PD patients
Without dysarthria 2,00 2,10 2,10 2,50 2,42 Mild 1,90 2,00 2,07 2,22 2,15 Moderate 1,85 2,23 2,03 2,03 1,99 Severe 1,10 1,10 0,92 1,03 1,14 0,00 0,50 1,00 1,50 2,00 2,50 3,00
Without dysarthria Mild Moderate Severe
For speech intensity , it is possible to look at the data in figure 6. Relatives were the only group who considered the control participant to have a high volume. All the other groups’ mean values that corresponded to normal/adequate volume or intensity. For mild and also for moderate dysarthria, all panel groups had mean values that corresponded with normal/adequate intensity or volume with the general population being the most critical group, Relatives and SLTs were the least judgmental for mild and moderate dysarthria. For severe dysarthria, all panel groups presented mean values associated with low volume, with the neurologists the most critical.
41
GP SLTs Neurologists Relatives PD patients
Without dysarthria 2,80 3,00 3,20 2,90 2,71 Mild 2,30 2,63 2,53 2,30 2,06 Moderate 2,08 2,30 2,05 2,13 1,65 Severe 1,10 0,85 0,80 1,00 0,65 0,00 0,50 1,00 1,50 2,00 2,50 3,00 3,50
Without dysarthria Mild Moderate Severe
Figure 8: Audio-perceptive analysis of conversation parameter discourse comprehensibility per level of dysarthria and by all panel groups
terms of articulation, all -panel members presented mean values pointing to good articulation for control participants, neurologists had the highest with a mean of 3.1 and PD patients the lowest at 2.6. All groups had mean values corresponding to normal/adequate articulation for mild dysarthria, with the neurologists the most critical and SLTs the least critical. For moderate dysarthria, only two groups had mean values that did not correspond to normal/adequate articulation but were associated with bad articulation: neurologists and PD patients. For severe dysarthria, all jury groups had mean values associated with bad articulation, neurologists were the most critical group and the general population the least. Data are presented in figure 7.
Relative to discourse comprehensibility, looking at the data presented in figure 8 it is possible to notice that only severe dysarthria had mean values from all panel groups that were associated with difficulty understanding speech, with PD patients the most critical group. The control participant had mean values from all groups that corresponded with discourse comprehensibility, and SLTs and neurologists both considered mild dysarthria as easy to understand. The other groups considered mild dysarthria as normal/adequate to understand and all groups also considered moderate dysarthria as being normal/adequate to understand.
42 Correlation between discourse comprehensibility and the other parameters
Discourse comprehensibility is a parameter that corresponds to the perception of speech intelligibility of each participant. Because this was the main focus of the study, the possibility of a correlation between this parameter and other parameters was investigated, namely velocity, intensity, and articulation. For this, Spearman’s correlation was performed. Between discourse comprehensibility and articulation there was a strong uphill positive linear relationship that was statistically significant ((0.01 level [rs = +0.7]). Between discourse comprehensibility and intensity there was a
moderate uphill positive relationship that was statistically significant (0.01 level [rs =
+0.5]). Between discourse comprehensibility and velocity there was a weak uphill positive linear relationship that was a statistically significant (0.01 level [rs = +0.3]).
43 DISCUSSION
The hypothesis of the current study main was verified and overall differences in the hit percentage of dysarthric speech between speakers with dysarthria, SLTs, naive listeners, relatives and neurologists, for words and sentences was assessed.
For orthographic transcription of words, neurologists hadthe highest hit percentage with 70.4% followed by SLTs with 66.8%, relatives with 60.6%, general population with 60.2%, and PD patients with56.2% . Pairwise comparisons showed significant differences between neurologists and all the other groups, except for SLTs, in the medians of the total words correctly annotated. There were also significant differences between SLTs and the general population. These results may be justified by the expertise of the clinicians, especially neurologists who have many years of direct experience working with PD. Despite years of experience working with adults and with different types of dysarthria, one of the main inclusion criteria for SLTs for this study was that they did not have direct experience working daily with PD. This may justify the difference between total scores of correctly transcribed words between the two groups of clinicians and point to a need for specialization and for evidence-based expertise. Some studies affirm that familiarizing the listener with the type of dysarthria has been found to produce intelligibility benefits68,70,81 and Kreiman at al. defend that clinical training and experience might influence speech perception.82 These studies support the results presented here, where clinicians who knew in advance the type of dysarthria associated with PD, and work with dysarthric patients in their clinical practice, presented greater percentages of correctness. In other studies, speech-language pathologists provided significantly higher intelligibility scores for the speakers with dysarthria.83 The published literature also shows that clinicians who have experience with disordered speakers obtained higher transcription scores than inexperienced listeners,84 which is in agreement with the findings in this study. As far as PD patients are concerned, their scores were the lowest. The published literature states that individuals with dysarthria may perceive their speech differently to those without dysarthria67,85 and suggest that PD patients lack insight into their speech difficulties63. However, this is about PD patients listening to their own speech and not about PD patients’ perceptions of dysarthric speech by other PD patients. A literature review about perception of speech by individuals with PD provided evidence that PD patients have a deficit in the perception of loudness and other speech dimensions such as pitch and