BJRS
RADIATION SCIENCES
07-01A (2019) 01-13ISSN: 2319-0612 Accepted 2018-10-30
Comparative Dosimetric Study in Chest Computed
Tomography Using Phantoms
Aburjaile
aW. N., Gomez
aA. M., Guedes
bG., Mourão
a,bA. P.
a
Universidade Federal de Minas Gerais, Departamento de Engenharia Nuclear, CEP 31270-901, Belo Horizonte, Minas Gerais, Brazil
b
Centro Federal de Educação Tecnológica de Minas Gerais, Centro de Engenharia Biomédica, CEP 30480-000, Belo Horizonte, Minas Gerais Brazil.
ABSTRACT
The dissemination of Computed Tomography (CT) scan has promoted a significant increase in the absorbed dose by patients due to the diagnosis. Therefore, it is indispensable to improve protocols, seeking smaller doses, without impairing the diagnostic quality of the image. The risks of stochastic effects are greater for children due to tissue radiosensitivity coupled with longer life expectancy. In this work, a cylindrical phantom made of polymethylmethacrylate was used representing an adult chest, and a second phantom made of the same material was designed in an oblong shape, including axillary region, based on the dimensions of an eight-year-old pediatric patient. A comparative study was performed between chest scans formulated in two CT scanners in different radiodiagnostic services. The central slice of the both phantoms was irradiated successively, using a pencil ionization chamber, for the measurements in five different spots of each phantom. From the measurements, we obtained values of weighted and volumetric Dose Index (Cvol). The scans were performed with the routine chest acquisition protocols of the radiodiagnostic services, both for a voltage of 120 kV X-ray tube supply voltage. This work allowed to compare the dose between patients with variable chest volumes and the dose variation in patients between two CT scanners used for image generation with the same diagnostic objective.
1. INTRODUCTION
Computed tomography scanners currently installed in radiodiagnostic services present wide technological variations, either in the speed of acquisition or in the protocols used for the acquisition of images that are dependent on available technology. Thus, images generated with the same diagnostic objective in different devices can result in different doses to patient, very different, either by the technological difference or the acquisition protocol used [1].
The X-rays used for diagnosis is the artificial source that contributes most to the exposure dose of the population due to the large number of X-ray examinations performed per year. The ionizing radiation originated from the X-rays used for diagnosis is the artificial source that contributes most to the exposure dose of the population due to the large number of X-ray examinations performed per year. CT scans accounted for 5% of all radiological exams and resulted in 34% of deposited dose in the world population in the year 2000 [2].
In 2006 the contribution of medical exposures in the composition of the effective population in the USA corresponded to 48%, with 24% due to CT examinations. The other 52% are derived from other sources such as Radon (37%), spatial origin (5%), terrestrial (3%) and internal (5%). Considering this data, it can be estimated that currently this population receives practically twice the dose received by the population before the discovery of X-rays [2, 3].
The increase in the use of imaging methods that make use of ionizing radiation, and especially of CT scans is responsible for the sharp increase in the annual mean individual radiation dose. With this, there is a growing concern of the medical community, manufacturers and even patients regarding the control of the radiation dose determined by the various tests that use ionizing radiation. In addition to occupational radiological protection, clinical practice uses the principle known as ALARA (As Low As Reasonably Achievable) to guide the rational use of this technology [4].
Several factors contribute to the increased demand for CT scans, including the constant technological evolution of the equipment; the speed of the data acquisition and the reduction of the examination time; as well as the increase in the number of indications for its accomplishment, associated to greater availability and a relative tendency to decrease exam costs [5].
The risk associated with a radiological examination can be considered quite low compared to the risk due to natural radiation. However, any additional risk, no matter how small, is unacceptable if it does not benefit the patient. The knowledge of the dose distribution deposited in children is important when it is thought to change the acquisition parameters aiming at dose reduction. The risks of stochastic effects increase in the child due to the tissue radiosensitivity allied to the long life expectancy [6].
The CT scans result in absorbed doses to organs in the range of 10 to 100 mGy, usually below the lower limit considered for the occurrence of deterministic effects [Image Gently, 2014]. However, all procedures involving ionizing radiation can lead to stochastic effects, such as tumor induction. ICRP 87 (2000) advocates actions for dose reduction, such as the use of 270° partial tube rotation, selection of suitable reconstruction protocols, use of multi-channel Z filters, which would be actions to be incorporated into the technology of CT scanners. Several actions were introduced by the manufacturers, for example: specific protocols for pediatric patients, current modulation in the organ-based tube and interactive reconstruction [7].
The objective of this study is to find the differences in dose values deposited in adult and pediatric chest phantoms using the same acquisition protocols and calculate the CT dose index for the phantoms.
2. MATERIALS AND METHODS
2.1. Computer Tomography Scanners
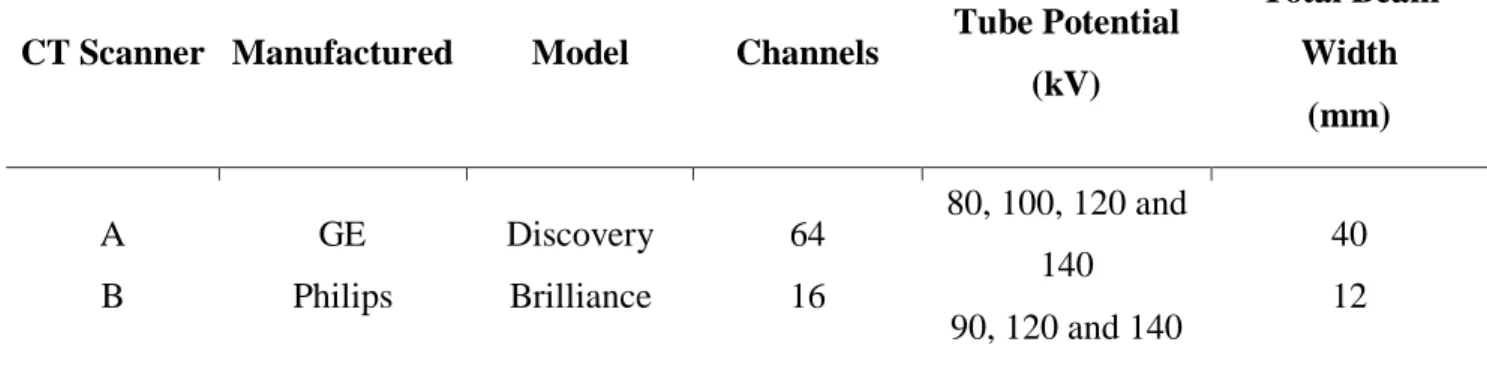
The experiments for the observation and comparison of the CT air kerma index and CT dose on the chest phantoms were carried out on two multislice CT scanners, one made by GE and another by Philips. The routine chest protocols and optimized pediatric chest scan protocols were used. Table 1 shows the main characteristics of the CT scanners used.
Table 1: Characteristics of CT scanners.
CT Scanner Manufactured Model Channels Tube Potential (kV) Total Beam Width (mm) A B GE Philips Discovery Brilliance 64 16 80, 100, 120 and 140 90, 120 and 140 40 12
2.2. Phantoms
Two chest phantoms were constructed by the research team of the Centro de Engenharia Biomédica (CENEB) of the Centro Federal de Educação Tecnológica de Minas Gerais (CEFET-MG), being a representative of an adult and a pediatric patient's chest. The adult patient chest phantom is a cylinder made of PMMA, 32 cm in diameter and 15 cm in length. This phantom is considered the default for the dose reference in chest CT scans. Thus, all chest CT scans performed are accompanied by a report that presents a volumetric CT dose index estimated by scanner (CTDIvol) based on the scanning of this phantom.
The pediatric chest phantom made of PMMA is oblong, with dimensions of 14 x 29 cm2, representing the dimensions of the chest of an eight-year-old pediatric patient, including the axillary region and 15 cm in length.
The phantom has openings for positioning of dosimeters, one central being representative of the mediastinum and four peripheral positions 3 and 9 axillary regions and 6 and 12 thoracic spine and mediastinum, which from the anatomical point of view, whose purpose will be to study the distribution of doses absorbed in these involved organs and tissues. The four peripheral openings are 90° out of phase, the center of which is 10 mm from the edge of the phantom. Figure 1 shows an illustration with the dimensions of the adult and pediatric phantoms.
Figure 1: Adult (A) and pediatric (B) chest phantoms.
(A) (B)
In order to carry out the scans on the CT devices, the phantoms were positioned in the isocenter of the gantry, and the peripheral openings were identified according to the hours of the analog clock, as: 3, 6, 9 and 12. These apertures are used as reference to position the phantom in the isocenter of the gantry with the aid of lateral side and up lasers.
The openings of the phantoms are filled with PMMA rods which must be removed one by one for the positioning of the pencil chamber, targeting the dose measurements in the five regions. Thus, while the ionization chamber is positioned in one opening, the others were filled with PMMA rods holding the phantom as a PMMA solid structure. Figure 2 shows the positioning of the adult phantom in the isocenter of the gantry.
The CT air kerma index measurements were performed using a pencil chamber with the routine chest scan protocol used by the radiological services and other protocols were proposed. The measurements were recorded with the gantry at zero-degree angulation and with the phantom positioned in the isocenter.
The pencil chamber was positioned alternately in the openings of the adult chest phantom and later in the pediatric phantom. For each chamber positioning, five measurements were performed, making a minimum of 25 measurements for each protocol and for each phantom. The central slice irradiations were performed in the two phantoms, in axial mode, with a voltage supply of the X-ray tube of 120 kV in the both CT scanners.
2.3. Scanning protocols
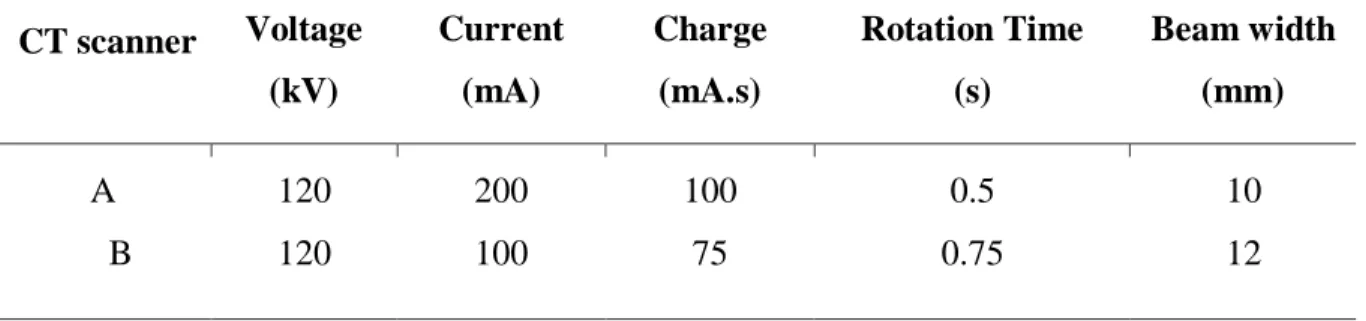
The definition of the protocol parameters for the central slice irradiation has been performed through the operating terminal of the scanner. In the examination room, the adult phantom and later the pediatric phantom have been placed on the table and, with the aid of lasers, they were oriented so that their central axis passed through the isocenter of the gantry during the displacement of the table. Table 2 shows the protocol parameters used to irradiate the central slice of the two phantoms in axial mode, for scanners A and B, respectively.
Table 2: Protocol parameter for irradiation of the chest phantom on scanners A and B CT scanner Voltage (kV) Current (mA) Charge (mA.s) Rotation Time (s) Beam width (mm) A B 120 120 200 100 100 75 0.5 0.75 10 12
Table 3 shows the protocols used in the services routines for all patients, regardless of size or age.
Table 3: Routine protocols of CT scanners A and B CT Scanner Voltage (kV) Current (mA) Charge (mA.s) Tube time (s) Beam thickness (mm) Pitch Scan length(cm) A B 120 120 300 500 150.0 250.0 0.5 0.5 40 12 0.984 0.938 10 10
Both scanners have automatic exposure control for dose reduction through current modulation (mA). Thus, the pediatric phantom was scanned with the automatic current control system, and the typical currents generated in the scans of the phantom were obtained.
2.4. Dose index values obtained
The values of air kerma in PMMA (Ck,PMMA,100) were obtained by reading the values recorded on
the electrometer duly calibrated by the influence of temperature and pressure through the calibration factor of the ionization chamber. In order to obtain the CT Dose Index (CTDI) values from the air kerma values, an air/PMMA conversion factor of 1.0412 was used, considering the 120 kV beam [8, 9].
3. RESULTS AND DISCUSSION
3.1. Measurements of C
k,PMMA,100The irradiation of the central slice of the adult phantom was done using the parameters defined in Table 1. The mean values obtained for each position and the standard deviation (SD) of the measurement are presented in the Table 4. Observing the mean values recorded in the five positions, it is verified that, among the values of air kerma in the peripheral PMMA, the highest recorded value was 12.52 ± 0.34 mGy, and it occurred in position 12, and the lowest was 10.50 ± 0.03 mGy in position 6, which is an effect of filtering the beam by the table when the X-ray tube
radiates the object from the bottom to the top. As the contribution in the composition of the registered value of point 6 is greater at that moment, due to the proximity of the beam focus, the total value of air kerma in that position becomes normally smaller. For these measurements, the standard deviation (SD) ranged from 0.29% to 2.72% of the average value.
Table 4: Values of Ck,PMMA,100 in mGy for adult and pediatric chest phantom for 120 kV and
100 mA.s in CT scanner A.
Phantom Position 3 6 9 12 Central
Adult Average SD 11.90 0.33 10.50 0.03 11.93 0.04 12.52 0.34 5.73 0.02 Pediatric Average SD 13.92 0.04 17.26 0.20 14.01 0.04 19.12 0.10 14.34 0.06
The proximity between the doses in points 3 and 9 indicates the good positioning of the object in the isocenter of the gantry, since if the object is displaced to the right, there would be a greater dose deposition in point 3 and, consequently, smaller in point 9. The average value obtained at the central point was the lowest, 5.73 ± 0.02 mGy, corresponding to approximately 48.52% of the mean peripheral values. It should be noted that the dose recorded in points 3 and 9 are of paramount importance, since there are located axillary lymphatic chains that are radiosensitive.
The average values of air kerma in the PMMA Ck,PMMA,100 calculated allow us to verify that
the highest recorded value was 19.12 ± 0.10 mGy and occurs at position 12; and the lowest was 13.92 ± 0.04 mGy at position 3. The dose values at positions 3, center and 9 are very close and smaller than the values recorded in positions 6 and 12. For these measurements the standard deviation varied between 0.29% and 1.16% of the average value. Figure 3 shows graphs of Ck,PMMA,100 values for adult and pediatric phantoms on A and B scanners.
Figure 3: Graphs of Ck,PMMA,100 values for adult and pediatric phantoms on A and B scanners
(A) (B)
For the measurements of the adult chest phantom in the CT scanner B it was verified that, among the values of air kerma in PMMA in the peripheral openings according to Table 5, the highest recorded value was 9.11 ± 0.43 mGy, and occurs in the position 12, and the lowest was 8.14 ± 0.25 mGy in the position 6, which is an effect of filtering the beam by the table when the tube irradiates the object from the bottom up. The mean value obtained at the central point was the lowest, 4.39 ± 0.01 mGy, corresponding to approximately 50.73% of the mean peripheral values. For these measurements the standard deviation ranged from 0.23% to 6.64% of the average value.
The irradiation of the central slice of the pediatric phantom was done using the parameters defined in the Table 5. Five values of Ck,PMMA,100 were obtained for the five measurement positions.
Table 5: Values of Ck,PMMA,100 in mGy for adult and pediatric chest phantoms in CT scanner B.
Phantom Position 3 6 9 12 Central
Adult Average SD 8.58 0.57 8.14 0.25 8.78 0.26 9.11 0.43 4.39 0.01 Pediatric Average SD 9.34 0.15 11.77 0.36 10.22 0.06 13.18 0.41 10.17 0.13
3.2. Values C
w, C
voland CTDI
volFrom the measured values the air kerma values in the air were obtained in PMMA Cw, shown in the Table 6 for a voltage of 120 kV and a charge of 100 mA.s. The estimated value in the A scanner report was 9.71 mGy, and in the B scanner it was 7.23 mGy. These values were very close to the values measured with the adult phantom.
Table 6: Cw values (in mGy) for 120 kV and 100 mA.s
CT Scanner Phantom Adult Pediatric A B 9.71 7.23 15.50 10.81
These results demonstrate that, if the same charge (100 mA.s) was used, the A scanner would promote greater dose deposition than the B scanner, both for an adult patient and for a pediatric patient. However, in the routine scans performed with the A scanner, the load value is 150 mA.s and for the B scanner, the load is 250 mA.s.
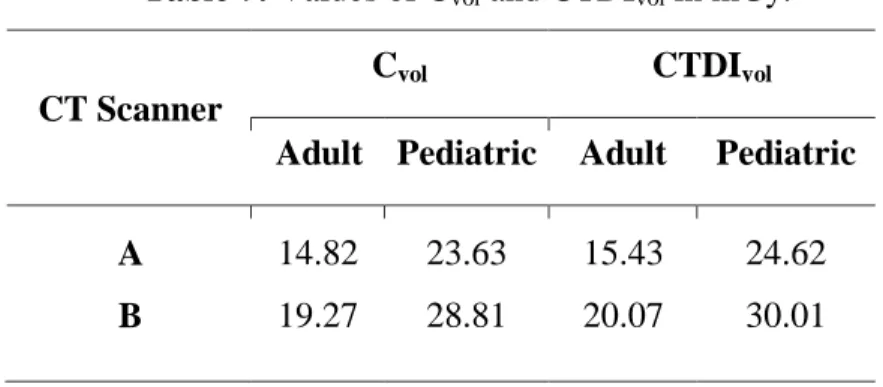
Considering also the influence of the pitch on the final value of the dose index in CT scans, we can obtain the value of Cvol and considering the pitch of 0.984 for the CT scanner A and 0.938 for
the B, as presented in Tables 5 and 6. Thus, the values of Cvol and CTDIvol shows in Table 7.
Table 7: Values of Cvol and CTDIvol in mGy.
CT Scanner
Cvol CTDIvol
Adult Pediatric Adult Pediatric A B 14.82 19.27 23.63 28.81 15.43 20.07 24.62 30.01
When comparing the obtained data, it can be concluded that the acquisition performed in the scanner B is responsible for a dose deposition of 21.89% greater than that deposition made in the scanner A, in order to obtain images with the same diagnostic objective of pediatric patients of 8 years. When considering adult patients, scans of the scanner B increase of up to 30.09% of the deposited dose.
Considering the dose variation through the CTDIvol of the pediatric phantom in relation to the
adult phantom it is verified that the pediatric phantom receives a dose 59.56% greater than the adult phantom in the scanner A and 49.53% in the B.
The development of the pediatric chest phantom in oblong format allowed the measurement of dose rates in CT and verify the variations presented and compare with the adult chest phantom. Chest scans with routine protocols have demonstrated that the dose in an eight years old patient when using the same scanning protocol is about 50% greater than in the adult patient.
4. CONCLUSIONS
The developed pediatric chest phantom allowed the verification of how the dose distribution can vary with the objet shape and volume. When comparing with the data obtained for the standard
adult chest phantom, it was found that doses in smaller volumes, such as pediatric patients, are higher when using the same acquisition protocol.
The scans of the central slice in the adult and pediatric chest phantom performed on the A and B CT scanners allowed us to observe the higher doses deposited in the pediatric phantom and which, depending on the section format, the doses are smaller on the longer axis 3, 9 and central positions, and larger in positions 6 and 12.
The results obtained allow us to say that the protocols defined for adult patients are oversized when used for chest scans of pediatric patients. Therefore, equipment that has automatic dose control tools must be activated when scans are performed in pediatric patients. However, it should be emphasized that in Brazil, a part of the equipment installed does not have automatic current adjustment tools, aiming at dose reduction and that even those who do not always have this tool triggered for pediatric patient scans. Even in more advanced technology equipment, such as multislice, which already have an automatic dose reduction system evaluated by patient mass and height, still require dose reduction adjustments for the pediatric patient.
ACKNOWLEDGMENT
This work was supported by FAPEMIG and the authors thank the Centro de Tecnología en Imagem Molecular (CTIM) of the Universidade Federal de Minas Gerais (UFMG).
REFERENCES
[1] MOURÃO, A. P.; ALONSO, T. C. Dose profile variation with voltage in head CT scans
using radiochromic filmes. Rio de Janeiro: ISRP2012. 2012.
[2] MOURÃO, A. P. Tomografia computadorizada. 2. ed. Rio de Janeiro: SENAC, 2015. 241 p. [3] BOLUS, N. E. NCRP Report 160 and What It Means for Medical Imaging and Nuclear
Medicine. J Nucl Med Technol, Alabama, p. 41:255–260, 2013.
[4] MOURÃO, A. P.; OLIVEIRA, F. A. D. Fundamentos de Radiologia e Imagem. São Caetano do Sul: Difusão, 2009.
[5] INTERNATIONAL ATOMIC ENERGY AGENCY. Implementation of the International
Code of Practice on Dosimetry in Diagnostic Radiology. Viena: [s.n.], v. TRS 457, 2011.
[6] PRANDO, A.; MOREIRA, F. A. Fundamentos de radiologia e diagnóstico por imagem. Colégio Brasileiro de Radiologia. 2. ed. São Paulo, 2015.
[7] MARINELLI, L.; QUIMBY, E.; HINE, G. Dosage determination with radioactive isotopes II, practical considerations in therapy and protection. Am J Roent Radium Ther, v. 59, p. 260-280, 1948.
[8] GOMEZ, A. M. L., Estudo de dosimetria e qualidade de imagem em varreduras de
tomografia computadorizada de cabeça utilizando objeto simulador. Dissertação (mestrado)
Universidade Federal de Minas Gerais, Escola de Engenharia. 2017