DEPARTAMENTO DE BIOLOGIA ANIMAL
ANGIOGENIC AND VASCULOGENIC PHENOTYPING
ALLOWS DISTINGUISHING LYMPHOMA FROM
LEUKEMIC “STAGES” OF CHRONIC LYMPHOCYTIC
LEUKEMIA
CRISTIANA ALEXANDRA FERREIRA MONTEIRO TEIXEIRA
MESTRADO EM BIOLOGIA HUMANA E AMBIENTE
1
UNIVERSIDADE DE LISBOA
FACULDADE DE CIÊNCIAS
DEPARTAMENTO DE BIOLOGIA ANIMAL
ANGIOGENIC AND VASCULOGENIC PHENOTYPING
ALLOWS DISTINGUISHING LYMPHOMA FROM
LEUKEMIC “STAGES” OF CHRONIC LYMPHOCYTIC
LEUKEMIA
CRISTIANA ALEXANDRA FERREIRA MONTEIRO TEIXEIRA
MESTRADO EM BIOLOGIA HUMANA E AMBIENTE
DISSERTAÇÃO ORIENTADA PELO DOUTOR SÉRGIO JERÓNIMO
RODRIGUES DIAS E PELA DOUTORA MARIA GABRIELA RODRIGUES
2
Contents
Abbreviations
... 6
Resumo
... 7
Abstract
... 12
Aims of the thesis
... 14
Introduction ... 15
1. Lymphoid Neoplasms ... 15
1.1. Non-Hodgkin Lymphomas ... 15
1.2. World Health Organization (WHO) Classification ... 15
2. Non-Hodgkin Lymphomas ... 16
2.1. Chronic Lymphocytic Leukemia ... 16
2.2. Small Lymphocytic Lymphoma ... 16
2.3. Prognostic factors (Ig VH Gene Mutation Status, CD38 and ZAP-70 expression
and cytogenetic abnormalities) and disease progression ... 18
2.4. Phenotypic features of CLL: Apoptosis ... 19
3. Phenotypic features of tumors: Blood vessels formation ... 19
3.1. Angiogenesis ... 19
3.2. Vasculogenesis (Embryonic vasculogenesis) ... 19
3.3. Postnatal Vasculogenesis (BM-derived EPC) ... 21
3.4. Biology of Endothelial Progenitor Cells ... 22
4. Angiogenesis and Vasculogenesis in Hematologic Neoplasias ... 24
5. MicroRNA expression profiling in PB ... 25
5.1. Implications in CLL ... 25
Materials and Methods ... 27
Patients Classification ... 27
Samples ... 27
Immunophenotyping by Flow cytometry ... 27
Enzyme-Linked Immunoabsorbent Assay (ELISA)... 28
Endothelial Differentiation Assays ... 28
Endothelial differentiation culture conditions ... 28
Immunohistochemical staining of BM and LN sections ... 29
TUNEL assay ... 30
RNA Extraction ... 30
miRNA microarrays ... 30
Analysis of the microarrays ... 31
cDNA synthesis and qRT-PCR ... 31
3
Results ... 33
Quantification of EPC in PB samples from CLL and SLL patients ... 33
CEPC correlate with VEGF plasma levels ... 34
CEPC differentiate into functional endothelial cells ... 38
Microvessel density, tumor cell apoptosis and CD38 expression by CLL cells in BM
and LN biopsies allows differentiating SLL from CLL phases... 39
MicroRNA profiling of lymphoma and leukemic “stages” of Chronic Lymphocytic
Leukemia ... 45
Discussion and Future Work
... 49
References
... 51
Supplementary information
... 56
Protocols
61
4
Em primero lugar, agradeço ao Doutor Sérgio Dias pela oportunidade que me proporcionou de realizar o meu primeiro projecto de investigação no seu grupo de trabalho. O meu muito obrigada.
Á Professora Gabriela Rodrigues pela sua ajuda e disponibilidade .
Agradeço à Doutora Maria Gomes da Silva por toda a disponibilidade, empenho e contribuição essencial para a realização deste trabalho.
Agradeço ao Laboratório de Citometria de Fluxo do IPOLFG, especialmente à Ana e à Andreia, por todos os ensinamentos de citomertria de fluxo.
Agradeço também ao Laboratório de Anatomia Patológica, ao Doutor José Cabeçadas por toda a ajuda na interpretação dos cortes histológicos e à Filipa Areia pela grande ajuda na realização da imunohistoquímica.
Agradeço especialmente ao grupo de Angiogénese, o meu grupo de trabalho por toda a ajuda e apoio durante este ano, pela disponibilidade e simpatia constantes e principalmente pela amizade e paciência que sempre demonstraram. Agradeço à Ana Costa (Ana Costinha) por me ter mostrado o maravilhoso mundo dos microRNAs, à Tânia Carvalho (Doutora Tânia Anatomista) pelos 3952 vasos contados, ao Francisco Caiado (Francisquinho) por acreditar comigo na existência dos progenitores, à Ana Cachaço (Senhora Ruiva) por me mostrar a luz ao fundo do TUNEL, à Ana Gomes (Goméz) pela pronúncia do norte, à Cristina Casalou pelo esclarecimento das minhas frequentes dúvidas existenciais, à Jacinta Serpa (Doutora Jaci) por não se esquecer da Tininha Marise, à Cheila Torre (Cheiloca) pelas conversas ao final do dia, à Leonor Remédio pela companhia no “after hours” no lab e à estudante que veio de Itália, Sara Lamorte. A todos o meu mais sentido e sincero obrigada...
Agradeço a todos os restantes membros do CIPM pela simpatia e companheirismo com que sempre me trataram.
5
Agradeço a todos os meus amigos por todo o o apoio nas boas e más horas, por todo o carinho e incentivo que sempre me deram, sem eles não teria conseguido. Agradeço à Sara Pinto, à Filipa Almeida, ao Jorge Henriques, ao Tomás Azevedo, ao Jaime Pita, à Rute Tomaz, à Sofia Fragoso, à Rita Domingues, ao Carlos Bruno, ao Artur Pelicho, às minhas muito pacientes “flatmates” Joana Costa e Patrícia Pedreirinha, à Vanessa Carlos e à Zita Santos.
E por último, mas sem dúvida o mais importante, o meu maior agradecimento aos melhores pais, irmão, irmã e cunhada do mundo, por estarem sempre presentes.
6
bFGF basic Fibroblast growth factorBM Bone marrow
CEPC Circulating Endothelial Progenitor Cells
CIPM Centro de Investigação em Patobiologia Molecular CLL Chronic Lymphocytic Leukemia
EC Endothelial cells
ELISA Enzyme-linked immunoabsorbent assay EPC Endothelial progenitor cells
F Female
FACS Fluorescence activated cell sorting HC Hematopoietic cells
HSC Hematopoietic stem cells Ig Immunoglobulin
IPOLFG Instituto Português de Oncologia Lisboa Francisco Gentil LLC Leucemia Linfocítica Crónica
LN Lymph node LNA Locked nucleic acid
M Male miRNA microRNA MNC Mononucleated cells MVD Microvessel Density ND Not determined NHL non-Hodgkin's lymphoma PB Peripheral blood
qRT-PCR Quantitative reverse transcription-polimerase chain reaction SD Standard deviation
SLL Small Lymphocytic Lymphoma
ssRNA Single-strand RNA
VEGF Vascular endothelial growth factor
VEGFR-1 Vascular endothelial growth factor receptor-1 VEGFR-2 Vascular endothelial growth factor receptor-2 vWf von Willebrand factor
7
A LLC é a leucemia mais frequente no mundo ocidental e afecta maioritariamente indivíduos do sexo masculino de idades avançadas (Zwiebel et al., 1998).
A doença tem um curso indolente e uma mediana de sobrevivência longa (Ray et al.,
1975). Os tratamentos disponíveis podem induzir a remissão da doença, no entanto na
maioria dos doentes ocorre recaída. Consequentemente, a LLC continua a ser uma doença incurável (Jaffe et al., 2001).
Esta doença do sistema hematopoiético resulta da acumulação de células-B maduras neoplásicas resistentes à apoptose no sangue periférico, na medula óssea e nos gânglios linfáticos (Bennett et al., 1989).
O diagnóstico clínico requer a presença de uma linfocitose persistente no sangue periférico (> 5000 linfócitos /μl) durante um período mínimo de 3 meses, sendo um dos principais critérios utilizados para distinguir a LLC do linfoma linfocítico (“Small Lymphocytic Lymphoma”) (Cheson et al., 1996). Quando o tumor se encontra apenas nos gânglios linfáticos (linfadenopatia) ou outros tecidos como o baço ou o fígado (hepatosplenomegália), sem ocorrer envolvimento do sangue periférico (< 5000 linfócitos /μl) (Jaksic et al., 2001) ou da medula óssea, os doentes são diagnosticados com linfoma linfocítico (Jaffe et al., 2001). Devido às suas semelhanças morfológicas, imunológicas e fenotípicas a mais recente classificação da Organização Mundial de Saúde (OMS) relativa às neoplasias hematológicas distingue a LLC da entidade designada por linfoma linfocítico apenas pela sua apresentação leucémica e baixa agressividade (Jaffe et al., 2001). A presença da doença nos gânglios linfáticos está associada a menores taxas de sobrevivência e de resposta às terapias. Por conseguinte, o linfoma linfocítico é uma manifestação mais agressiva e com pior prognóstico da doença (Jaksic et al., 2001).
A presença de marcadores de superfície das células-B (nomeadamente CD19, CD20 e CD23) (Cheson et al., 1996), a ausência de hipermutação somática dos genes das cadeias pesadas das imunoglobulinas (Hamblin et al., 1999; Damle et al., 1999) e a existência de anomalias citogenéticas nos cromossomas 13 [del(13q14.1)], 11[del(11q)], 6 [del(6q)], 17 [del(17p)] e trissomia do cromossoma 12 (Döhner et al.,
2000), são características utilizadas no diagnóstico clínico e são habitualmente
preditivas da progressão da doença. A expressão de ZAP-70 e CD38 pelas células neoplásicas está também associada a um pior prognóstico da doença (Matrai, 2005).
8
No embrião, os vasos sanguíneos surgem de novo a partir de precursores endoteliais do sistema hematopoiético. Este processo é denominado de vasculogénese (Risau,
1995), em oposição à angiogénese que ocorre através da ramificação de novos
capilares a partir de vasos pré-existentes, e ainda do alargamento, separação e fusão desses mesmos vasos, o que implica a proliferação de células endoteliais (Folkman et
al., 1992). No organismo adulto, os novos vasos surgem apenas através da
neo-vascularização (angiogénese) (Hanahan et al., 1996), mas o papel de precursores endoteliais neste processo tem ultimamente sido reconhecido como essencial
(Asahara et al., 1999; Urbich et al., 2004). Estas células precursoras derivadas da
medula óssea são recrutadas para a circulação em situações de stress vascular, resultante da libertação de níveis elevados de factores pró-angiogénicos (VEGF) e incorporam os vasos neo-formados (Hanahan et al., 1996). A existência de progenitores em circulação é sinal de uma actividade pró-angiogénica intensa, que poderá relacionar-se com o estádio de desenvolvimento tumoral e a agressividade da doença, e determinar a sensibilidade a diversas formas de terapêutica (Kay et al.,
2002). Diversos estudos demonstraram que o crescimento e metástases de tumores
sólidos são dependentes do processo angiogénico (Hanahan et al., 1996), já proposto em 1971 por Folkman et al.
Embora o seu papel patofisiológico em tumores sólidos tenha sido extensivamente estudado, a importância da angiogénese nas neoplasias hematológicas foi demonstrada recentemente (Perez-Atayde et al., 1997; Kini et al., 2000). Um aumento da angiogénese (vascularização) foi demonstrado em Linfomas de não-Hogdkin de células-B, nomeadamente na medula óssea e gânglios linfáticos de doentes diagnosticados com LLC (Chen et al., 2000; Kini et al., 2000). A síntese pelas células leucémicas de níveis elevados de factores pró-angiogénicos (VEGF), assim como a expressão nestas células de VEGF e dos seus receptores (VEGFR-1/FLT-1 and VEGFR-2 /KDR) foram também fundamentais para demonstrar o aumento do processo angiogénico (Chen et al., 2000; Kini et al., 2000; Molica et al.,
2002).
Com a finalidade de melhor compreender qual a importância dos processos angiogénico e vasculogénico em neoplasias hematológicas, nomeadamente na LLC e de contribuir para a identificação de factores moleculares/biológicos que permitissem a distinção entre as formas leucémica e linfomatosa desta doença, o principal objectivo
9
desta tese de mestrado foi a caracterização do perfil angiogénico e vasculogénico
dos doentes com LLC.
Esta caracterização tinha como principal hipótese a possível existência de diferenças entre as duas fases da doença em determinados parâmetros angiogénicos/vasculogénicos existentes em circulação e incorporados na medula óssea e gânglios linfáticos.
O primeiro parâmetro angiogénico estudado foram os progenitores endoteliais
existentes em amostras de sangue periférico dos doentes em estudo. Os doentes
foram estratificados em 4 grupos, de forma a homogeneizar as amostras e a criar grupos comparáveis entre si: doentes com LLC sem tratamento vs. doentes com linfoma linfocítico sem tratamento e doentes com LLC sob tratamento vs. doentes com linfoma linfocítico sob tratamento.
Para a caracterização e quantificação da percentagem destes EPC foi utilizada a imunofenotipagem por Citometria de Fluxo através de anticorpos monoclonais contra os marcadores específicos da superfície celular dos progenitores endoteliais CD133 e VEGFR-2(KDR). Os resultados sugerem que o grupo de doentes com linfoma linfocítico têm uma maior percentagem de EPC em circulação independentemente da situação clínica.
O potencial de diferenciação destes progenitores em células endoteliais
maduras foi posteriormente testado in vitro em ensaios de diferenciação através da
utilização de células mononucleadas isoladas do sangue periférico. Os resultados sugerem que estes progenitores são funcionais nos doentes com LLC e linfoma linfocítico e que a sua diferenciação em células positivas para o factor de Von Willebrand pode sugerir uma contribuição destes EPC para a formação dos novos vasos (vasculogénese).
O segundo parâmetro em estudo foram os níveis circulantes de factores
angiogénicos (VEGF) em plasma de sangue periférico. A concentração dos níveis
VEGF foi determinada por métodos de ELISA. Os resultados obtidos sugerem que os níveis de VEGF no plasma não estão relacionados com a fase da doença ou com a situação clínica dos doentes, visto que se verificaram níveis elevados de VEGF no grupo de doentes com linfoma linfocítico sob terapia e no grupo de doentes com LLC sem tratamento.
10
Outros parâmetros angiogénicos incorporados nos tecidos afectados pelas células neoplásicas foram também caracterizados em biópsias de medula óssea e de gânglios linfáticos dos doentes em estudo.
A determinação da densidade microvascular (angiogénese) em secções
histológicas foi realizada por imunohistoquímica para o factor de Von Willebrand. Os
resultados sugerem um maior número de vasos medulares nas biópsias dos doentes com linfoma linfocítico, o que poderá estar correlacionado com um fenótipo mais agressivo da doença.
Outras características fenótipas da doença foram também observadas nomeadamente
apoptose das células tumorais e expressão de CD38 por estas células nos tecidos afectados. Uma menor apoptose das células tumorais e uma maior
expressão de CD38 foram observadas nas biópsias de medula óssea dos doentes com linfoma linfocítico. Estes resultados podem predizer uma maior agressividade desta fase da doença, com pior prognóstico quando comparada com a fase leucémica. As células tumorais são por conseguinte mais resistentes à apoptose e expressam mais CD38. Em estudos anteriores, foi demonstrado que doentes com uma maior expressão de CD38 pelas células neoplásicas tinham um pior prognóstico e uma menor sensibilidade às terapias (Matrai, 2005).
O perfil de expressão de miRNAs foi caracterizado em células mononucleadas isoladas do sangue periférico de doentes com LLC e linfoma linfocítico. Os resultados revelaram que existem diferentes perfis de expressão de miRNAs associados com as duas formas da doença.
Em suma, o trabalho desenvolvido durante este projecto de mestrado revelou pela primeira vez a existência de diferenças significativas entre as duas fases da doença (LLC vs. linfoma linfocítico) em determinados parâmetros angiogénicos e vasculogénicos existentes em circulação e incorporados nos tecidos-alvo da doença. Estas diferenças foram sugeridas por uma maior percentagem de progenitores endoteliais em circulação nos doentes com linfoma linfocítico em relação aos doentes com LLC. Este resultado juntamente com o aumento da densidade microvascular observada nas biópsias de medula óssea dos mesmos doentes podem ser correlacionados com um fenótipo mais agressivo. Este fenótipo pode também estar
11
relacionado com a maior resistência à apoptose e maior expressão de CD38 observadas.
Entre as duas fases da doença (CLL and SLL) verificou-se diferente expressão de miRNAs e o possível significado biológico desta diferença será explorado em experiências futuras .
Palavras-Chave:
Angiogénese; Vasculogénese; Leucemia Linfocítica Crónica; Linfoma Linfocítico; Progenitores Endoteliais; Densidade microvascular.
12
(EPC) are recruited to circulation and contribute to the neo-vasculature of growing tumors. Although the pathophysiologic role of angiogenesis in solid tumors has been extensively studied, its involvement in hematological malignancies has only recently been recognized. Increased angiogenesis has been documented in patients with Chronic Lymphocytic Leukemia (CLL).
The World Health Organization classification of hematopoietic neoplasias recognizes some lymphomas and corresponding lymphoid leukemias as different phases (solid and circulating, respectively) of the same disease: CLL as a leukemic, lymphocytic lymphoma, only distinguishable from small lymphocytic lymphoma (SLL) by its leukemic presentation and lower aggressiveness. It arises mainly from a slow accumulation of mature-looking malignant B lymphocyte population resistant to apoptosis, in the peripheral blood (PB), BM and/or lymph nodes (LN).
Given the clinical importance of distinguishing leukemic from lymphoma forms of CLL, we characterized the angiogenic and vasculogenic profile of CLL patients to test the hypothesis that there might be differences in angiogenesis-related parameters in circulation (circulating endothelial progenitor cells (CEPC) and vascular endothelial growth factor (VEGF) and incorporated into the affected BM and LN tissues between the two phases of the disease.
Our data shows that patients with SLL under treatment have higher number of circulating EPC and higher levels of circulating VEGF. Importantly, we show that CEPC are functional in CLL and SLL patients, as seen in vitro in endothelial differentiation assays. We also observed increased microvessel density, decreased tumor cell apoptosis and higher CD38 expression by the tumor cells in BM biopsies from SLL patients which could be related with increased aggressiveness and bad prognosis of the disease at this phase.
The miRNAs expression profile showed that there are different miRNAs patterns associated with SLL and CLL phases.
Our study demonstrates for the first time significant differences in angiogenic and vasculogenic factors in circulation and in the affected tissues between leukemia and lymphoma phases, as suggested by a significant higher number of CEPC in SLL patients vs. CLL patients; this result together with increased MVD observed in BM of SLL patients could be related with a more aggressive phenotype.
13
Key-Words:
Angiogenesis; Vasculogenesis; Chronic Lymphocytic Leukemia; Small Lymphocytic Lymphoma; Endothelial Progenitor Cells; Microvessel Density.
14
With the purpose of expanding our knowledge on the importance of the angiogenic/vasculogenic process in hematologic neoplasias, namely in Chronic Lymphocytic Leukemia and given the clinical value of distinguishing leukemic from lymphoma forms/phases of this disease (CLL vs. SLL), the main purpose of this thesis, was the characterization of the angiogenic and vasculogenic profile of CLL
patients. We tested if there were differences in angiogenesis-related parameters in
circulation and incorporated into the affected tissues (BM and LN) between CLL and SLL.
15
1. Lymphoid Neoplasms
1.1. Non-Hodgkin Lymphomas
“The first description of what we now recognize as a lymphoma is
generally attributed to Thomas Hodgkin in 1832”.
1.2. World Health Organization (WHO) Classification
In the last few decades, with the improvements in molecular biology, genetics and immunology, the classification of lymphoid tumors suffered extensive changes. The WHO classification distinguishes tumors primarily by cell lineage defined by immunophenotype and groups together lymphomas and leukemias, recognizing that some solid tumors also pass through circulating leukemic phases (Parkin et al., 2005). Therefore some lymphomas and corresponding lymphoid leukemias are recognized as different phases (solid and circulating, respectively) of the same disease (Morton et
al., 2007).
Lymphoid neoplasms, including lymphoma, myeloma and lymphoid leukemia, arise from the malignant transformation of lymphoid cells at various stages of differentiation and comprise the sixth most common group of malignancies worldwide in men and women (Parkin et al., 2005).
Within the lymphoid neoplasms, the WHO system distinguishes Hodgkin lymphoma from non-Hodgkin lymphomas (NHL) based on morphologic and immunologic characteristics (Morton et al., 2007). The various NHL subtypes are distinguished in B-cell NHL, T-B-cell NHL (including natural killer (NK)-B-cell NHL) and NHL of unknown B-cell lineage (Parkin et al., 2005) based on the stage of differentiation and additional morphologic, phenotypic, genotypic and clinical features (Jaffe et al., 2001). These categories are then classified by stage of differentiation into mature B-cell NHL, mature T-cell NHL and precursor cell NHL. The mature B-cell origin includes Chronic Lymphocytic Leukemia (CLL)/Small Lymphocytic Lymphoma the model study of this thesis.
16
2. Non-Hodgkin Lymphomas2.1. Chronic Lymphocytic Leukemia 2.2. Small Lymphocytic Lymphoma
“One disease at different phases, not two separate entities” (Jaffe et al., 2001)
The first broad characterization of B and T cells soon led to the recognition that CLL is a disease of neoplastic B cells. In the beginning of the 1970s some clinical and pathological classifications began to integrate CLL within the category of diffuse, low-grade, B-cell, non-Hodgkin lymphoma (Bennett et al., 1989).
CLL is the most frequent type of leukemia in the Western world and affects mainly elderly individuals, but about one third of patients are less than 60 years of age at diagnosis (Zwiebel et al., 1998) and the number of cases increases exponentially in the aged.
CLL follows an extremely variable course, with survival ranging from months to decades (Ray et al., 1975) and some patients have none or minimal symptoms during their entire disease course (Dighiero et al., 1991). However, in other cases, the disease may progress or be severe from the onset, necessitating immediate treatment
(Dighiero et al., 1991). Available treatments can often induce disease remission,
though nearly all patients relapse, and there is consensus that CLL remains an incurable disease (Jaffe et al., 2001).
This disease arises mainly from a slow accumulation of mature-looking malignant monoclonal B cells resistant to apoptosis in peripheral blood (PB), bone marrow (BM) and lymph nodes (LN) (Bennett et al., 1989).
The clinical diagnosis requires the presence of lymphocytosis (at least 5000 lymphocytes/μL blood) in the PB during at least 3 months, in part to separate CLL from small lymphocytic non-Hodgkin's lymphoma (SLL). The clonality of the circulating B lymphocytes needs to be confirmed by flow cytometry. The leukemic cells found in the blood smear are characteristically small, mature lymphocytes with a narrow border of cytoplasm and a dense nucleus lacking discernible nucleoli and having partially aggregated chromatin. These cells may be found admixed with larger or atypical cells, cleaved cells or prolymphocytes (Cheson et al., 1996). At an advanced disease stage patients present infections, enlarged nodes (lymphadenopathy), splenomegaly and/or
17
hepatomegaly (with palpable lymph nodes or not), disease-related anemia or thrombocytopenia (Cheson et al., 1996).
Molecular and cellular markers that may be used to predict disease progression have been identified. In particular, the mutational profile of immunoglobulin genes (Hamblin
et al., 1999; Damle et al., 1999) and some cytogenetic abnormalities (Döhner et al.,
2000) show strong prognostic value. However, these biological differences do not
separate CLL into two different disorders; it remains one disease with heterogeneous features (Hamblin, 2002). Consequently, it is clear that patients with CLL share a common and characteristic profile of gene expression despite heterogeneity in presentation and clinical disease course (Rosenwald et al., 2001).
The predominant population found in CLL patients shares B-cell surface antigens (CD19, CD20 and CD23) with the T-cell antigen CD5 and each clone of leukemia cells is restricted to expression of either kappa or lambda immunoglobulin light chains
(Cheson et al., 1996). These B cells also express surface immunoglobulin (slg),
CD79b and CD22 with low density (Ginaldi et al., 1998). The most common deletions are in the long arm of chromosome 13 [del(13q14.1)]. Additional frequent chromosomal aberrations include trisomy of chromosome 12, deletions in the long arm of chromosomes 11 [del(11q)] or 6 [del(6q)], or in the short arm of chromosome 17 [del(17p)] (Döhner et al., 2000). These characteristics are generally adequate for a precise diagnosis of CLL, and they also distinguish this disease from other disorders such as prolymphocytic leukemia, hairy-cell leukemia, mantle-cell lymphoma, and other lymphomas that can mimic CLL (Dighiero, 2003).
When the tumor is confined to LN or other tissues (e.g. spleen and liver) without blood or BM involvement, patients are considered to have SLL; histology and immunophenotype are identical to CLL, and so the recommend management is the same (Jaffe et al., 2001).
The definition of SLL entails the presence of lymphadenopathy and/or splenomegaly, the diagnosis being confirmed by histopathologic evaluation of a LN biopsy whenever possible. Moreover, the number of B lymphocytes in the PB should not exceed 5000 lymphocytes/μL (Jaksic et al., 2001).
Based on their similar morphological and immunophenotypic features, the most recent WHO classification of hematopoietic neoplasias considers CLL and SLL to be different
manifestations of the same disease and combines these entities into one disease category (CLL/SLL) (Jaffe et al., 2001). This classification describes CLL as leukemic,
18
lymphocytic lymphoma, being only distinguishable from SLL by its leukemic presentation and lower aggressiveness (Jaffe et al., 2001).
The prevalence of disease presentation at organ and lymph node level is associated with a less favorable outcome in terms of both response rate and overall survival
(Jaksic et al., 2001), and therefore SLL is considered a more aggressive form of the
disease with a worse prognosis.
2.3. Prognostic factors (Ig VH Gene Mutation Status, CD38 and ZAP-70 expression and cytogenetic abnormalities) and disease progression
New biological prognostic factors have become increasingly important to understand CLL progression. The leukemic cells express Ig that may or not have incurred somatic mutations in the Ig heavy chain variable region genes (Ig VH genes). The outcome of patients with leukemic cells that use an unmutated IgVH gene is worse than that of those patients with leukemic cells that use a mutated IgVH gene. CLL cases with unmutated IgVH have a distinctly more malignant disease, with faster disease progression and shorter survival times than those with somatic mutations
(Hamblin et al., 1999; Damle et al., 1999). CLL cells with trisomy 12 have atypical
morphology and patients have an aggressive clinical course and poorer survival than those with abnormalities at 13q14; this point to an association between clinical status and degree of somatic mutation (Döhner et al., 2000). In addition, patients with tumor cells that express 70-kD zeta-associated protein (ZAP-70) and CD38 appear to have a worse prognosis. CD38+ CLL cells are characterized by a greater proliferative potential and by diminished sensitivity to chemotherapy (Matrai, 2005).
Nevertheless, these molecular features of CLL still do not allow distinguishing lymphoma from leukemic phases of the disease.
19
2.4. Phenotypic features of CLL: ApoptosisIn the majority of patients, CLL cells are predominantly G0 quiescent cells that gradually accumulate throughout the body, not because they are dividing more rapidly than normal, but because they are surviving too long. However, it has been reported that CLL cells have deregulated expression of genes involved in apoptosis, and not in those involved in cell cycle progression. It is currently assumed that CLL cells are characterized by deregulation of the apoptosis pathway, which leads to increased cell survival and chemoresistance, although the aberration is not yet clear (Reed, 1999). The assessment of tumor cell apoptosis and the importance of this cell feature in the distinction between SLL and CLL are still unknown.
3. Phenotypic features of tumors: Blood vessels formation 3.1. Angiogenesis
3.2. Vasculogenesis (Embryonic vasculogenesis)
Development of tumors is a highly complex process in which several molecular events are required for tumor cells to achieve independent growth. One such event is the angiogenic process (Hanahan et al., 2000). The increase in tumor mass during the initial stages of tumor growth results in a reduction of the oxygen levels within the expanding tissue (hypoxia), which leads to the production of pro-angiogenic growth factors, such as vascular endothelial growth factor (VEGF) (Hanahan et al., 1996), by the neoplastic cells.
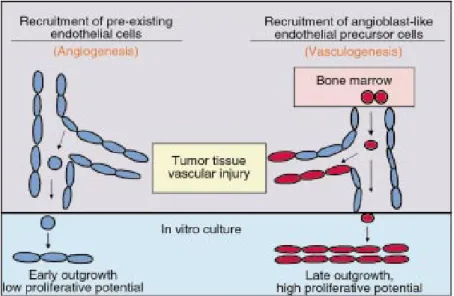
Blood vessels are fundamentally composed of endothelial cells, which interconnect to form the tubes that direct and maintain blood flow and tissue perfusion (Risau, 1995). During embryogenesis, blood vessels develop via two processes: vasculogenesis, which refers to the de novo formation of blood vessels by endothelial cells that arise from progenitor cells (Risau, 1995); and angiogenesis, in which new capillaries sprout from pre-existing vessels and also by the enlargement, separation and fusion of the
20
same vessels due to the proliferation and migration of activated endothelial cells (EC)
(Folkman et al., 1992) (Figure 1).
Figure 1. Blood vessel formation by postnatal vasculogenesis and angiogenesis. Recruitment of endothelial cells from preexisting vessels plays a critical role in the regulation of angiogenesis. BM-derived EPC with high proliferative capacity may have the potential to home and incorporate into sites of vascular injury or in tumor tissue (vasculogenesis). Image from Raffi S. The Journal of Clinical Investigation 2000, 105(1):17-19.
In the adult, new vessels are produced mainly through angiogenesis (Hanahan et al.,
1996) and once the definitive network is established, EC remain quiescent with
neovascularization only occurring during physiological (during growth and in the female reproductive organs during ovulation, menstruation, implantation and pregnancy) or pathological events (tumor growth and wound healing). However, the presence of circulating EC or endothelial progenitor cells in the adult is now well established and lately the role of endothelial precursors has been recognized as essential in certain angiogenic processes (Asahara et al., 1999b; Urbich et al., 2004).
In 1971, Folkman et al. proposed that tumor growth and metastasis are angiogenesis-dependent, and so, that blocking angiogenesis should be considered a strategy to arrest tumor development. Without blood vessels, tumors cannot grow beyond a critical size or metastasize (Folkman et al., 1992). A considerable body of research spanning
21
more than three decades has documented that tumor growth and metastasis formation require new blood vessel growth.
3.3. Postnatal Vasculogenesis (BM-derived EPC)
During embryonic development, there is a close relationship between the development of blood cells and endothelium, indicating that hematopoietic cells (HC) and EC derive from a common progenitor, the hemangioblast, a transient cell stage that develops early and disappears quickly (Flamme et al., 1992).
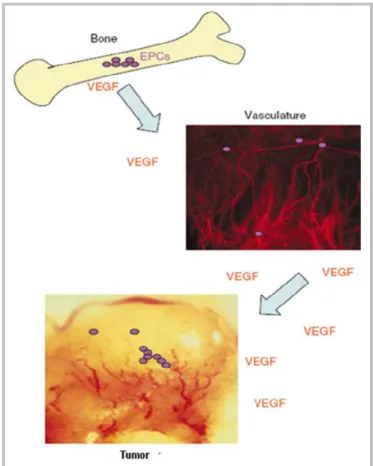
The thought that vasculogenesis is not restricted to embryogenesis, but also plays a role in postnatal physiological and pathological angiogenesis, arose from several studies performed in the first half of the 20th century. During tumor angiogenesis bone marrow (BM)-derived endothelial progenitor cells (EPC) are recruited in to the circulation in response to vascular stresses and contribute to the neo-vasculature of growing tumors (Asahara et al., 1999a; Asahara et al., 1999b). These cells leave the BM and enter the vasculature in response to an increase in the levels of circulating angiogenic factors such as VEGF (Figure 2). Once in the circulation, EPC can arrest at sites of ischemia or growth factor release (such as VEGF release), such as in the tumor periphery. These cells can then participate in new vessel formation by differentiating into branching blood vessels (Asahara et al., 1999a; Garmy-Susini et
22
Figure 2. Bone marrow-derived EPC (purple circles) contribute to tumor angiogenesis. Image from Garmy-Susini B. et al., British Journal of Cancer 2005, 93:855-858.The key regulators of vasculogenesis are VEGF and its receptors, VEGF receptor-1 (VEGFR-1, also known as fms-like, Flt-1) and VEGF receptor-2 (VEGFR-2, also known as kinase insert domain-containing receptor, KDR in humans) with different signaling and biological properties (Neufeld et al., 1999).
3.4. Biology of Endothelial Progenitor Cells
The majority of EPC is thought to reside in the BM in close association with hematopoietic stem cells and the bone marrow stroma where the growth and
23
differentiation of hematopoietic cells and endothelial precursors occurs (Urbich
et al., 2004). Besides their common precursor, hematopoietic stem cells (HSC) and
angioblasts/EPC share certain antigenic determinants that are also endothelial-specific markers, including VEGFR-2 and VEGFR-1, CD31 and CD34 (adhesion molecules), von Willebrand factor (vWf; coagulation factor) and they also have the ability to incorporate acetylated low-density lipoprotein (Ac-LDL) (Asahara et al., 1999b; Raffi
et al., 2003).
EPC are maintained in an undifferentiated and quiescent state in the BM microenvironment and when stimulated they have the capacity to proliferate, migrate and differentiate into EC, but have not yet acquired characteristics of mature EC
(Ribatti, 2004). Angiogenic factors as VEGF and its receptors may regulate the
expression of adhesion molecules on EC and control the recruitment and migration of EPC to sites of vessel repair (Asahara et al., 1999a). Circulating EPC differ from the circulating EC that are randomly detached from the vessel walls and enter the circulation as a result of vascular injury. Moreover, when EPC were exposed to angiogenic factors, they form highly proliferative endothelial colonies, whereas circulating EC only generate endothelial monolayers with limited proliferation capacity because they are mature, terminally differentiated cells (Raffi, 2000; Raffi et al., 2003). EPC were first described in 1997 by Asahara et al. as CD34-enriched mononuclear cells that acquired endothelial surface marker expression in culture. Following studies showed that a subpopulation of circulating CD34+ cells expressing CD34+CD133+VEGFR2+ could form endothelial colonies in vitro (Peichev et al., 2000; Gill et al., 2001). Peichev et al., found that CD133 (a stem cell marker), is also
expressed on subsets of CD34+ cells, its expression being downregulated (CD133-) when EPC differentiate into adherent mature EC; these cells then express endothelial specific markers, such as vWF and VE-cadherin. VEGFR-2 positive EPC were found to be present at low frequencies in human umbilical cord blood, adult BM, human fetal liver cells and cytokine-mobilized peripheral blood. When incubated in vitro with appropriate medium in the presence of specific growth factors, circulating EPC have a high proliferating potential and are able to produce colonies of cells expressing endothelial cell markers, such as CD34, CD133 and VEGFR-2, which this being the most widely used combination of surface markers for identifying human EPC (Asahara
24
4. Angiogenesis and Vasculogenesis in Hematologic NeoplasiasAlthough the pathophysiologic role of angiogenesis in solid tumors has been extensively studied, its involvement in hematological malignancies has been recognized only recently. Because the BM and lymphatic organs are predominant sites for tumor cell accumulation in these malignancies, it was initially believed that angiogenesis would not be relevant in these tumors (Perez-Atayde et al., 1997; Kini
et al., 2000).
However, an early report from Perez-Atayde et al. 1997, showed that BM of children with acute lymphoblastic leukemia (ALL) have higher microvessel density as compared to normal controls. These children had also higher urine levels of the angiogenic peptide basic fibroblast growth factor (bFGF) when compared to normal controls. These results indicate that ALL cells are angiogenic and that angiogenesis plays a role in the pathogenesis of the disease (Perez-Atayde et al., 1997). Increased angiogenesis was also reported in the BM of patients with multiple myeloma. Myeloma cells secrete bFGF and stimulate angiogenesis in in vitro and in vivo angiogenesis assays (Vacca et al., 1999).
In addition, there is increased angiogenesis in B cell non-Hodgkin lymphomas, which has been documented both in BM and LN of CLL patients (Chen et al., 2000; Kini et
al., 2000). Although the role of angiogenesis in CLL remains to be fully elucidated,
experimental data suggest that several angiogenic factors play a role in the pathogenesis and survival of the B-cell clones and consequently in the disease progression. These findings were also supported by the presence of increased neovascularization in the BM and LN and by the expression of angiogenic factors as VEGF and its receptors (VEGFR-1/FLT-1 and VEGFR-2 /KDR) by CLL cells (Chen et
al., 2000; Kini et al., 2000; Molica et al., 2002).
CLL cells produce VEGF which, acting in an autocrine manner has an antiapoptotic effect on the CLL cells. This interplay of cytokines and their function is further elucidated by the active role of nearby stromal cells that produce hematopoietic growth factors under the influence of angiogenic factors. VEGF-based autocrine pathway promotes the survival of CLL B-cells through up-regulation of anti-apoptosis (Kay et
25
The contribution of EPC (vasculogenesis) to the formation of neo-vessels is belived to be particularly relevant in NH lymphoma, the presence of circulating EPC in these patients correlated with angiogenic activity during tumor growth (Peters et al., 2005). Igreja et al. 2007 observed for the first time that the existence of EPC already incorporated into affected LN or in circulation in lymphoma patients may be used to monitor disease progression, tumor aggressiveness or response to treatment.
Therefore, the presence and clinical relevance of EPC in CLL biology, including their possible distinguishing role in CLL and SLL, is the focus of the present thesis.
5. MicroRNA expression profiling in PB 5.1. Implications in CLL
MicroRNAs (miRNAs) are ssRNA (single-strand RNA) of 19–25 nucleotides (nt) in length that are generated from endogenous transcripts harboring local hairpin structures (Kim et al., 2005a). The miRNAs are transcribed from autonomous transcription units into pri-miRNAs (primary precursor miRNAs). The pri-miRNAs are then processed to release the precursor of miRNAs (pre-miRNAs). Following this nuclear processing, the pre-miRNAs are exported to the cytoplasm and again are processed to release the mature miRNA (Lee et al., 2004).
MicroRNAs control several pathways including hematopoiesis, apoptosis, cell proliferation and tumorigenesis. The miRNAs are critical players in tumorigenesis where they can act directly as tumor suppressors or as oncogenes (oncomirs), or indirectly as consequence of the genetic and microenvironment pressures induced by the tumor (Kim 2005a; Kim 2005b). Therefore, miRNAs are involved in cancer initiation and progression and their expression profiling can be exploited for the classification, diagnosis and progression of human malignancies. The first report linking miRNAs and cancer was in CLL (Calin et al., 2002) and recent findings identify miRNAs as key players in pathogenesis of CLL. MiRNA expression profiling by microarrays allowed the identification of differentially expressed miRNA. For instance, a
26
cluster of two miRNAs, miR-15a and miR-16-1 are located in the main deleted region in CLL (13q14.3) and are known to target the anti-apoptotic BCL2 gene (Cimmino et al.,
2005) which have potential for CLL prognosis: patients with good prognosis showed
down-regulation of miR-15a and miR-16, whereas bad prognosis was associated with down-regulation of miR-29 (Calin et al., 2002; Calin et al., 2004).
The miR-155 has been already described as the first miRNA linked to human disease, specifically in B-cell malignancies (Eis et al., 2005). High level of this miRNA is related to aggressive form of CLL (Calin et al., 2005) and its role is to induce polyclonal expansion (Constinean, 2006). The miR-451 is associated with erythroid maturation and may play a role in promoting it´s differentiation (Zhan et al., 2007). Although a signature associated with prognostic factors and CLL progression have been characterized (Cheson et al., 1996), differences in the miRNA expression between the CLL and SLL were not described.
27
Patients ClassificationPatients admitted to the Hematology Department, IPOLFG-EPE, and classified as CLL were divided into 4 groups according to the phase of the disease (leukemia vs. lymphoma presentation) and clinical treatment after the diagnosis (without treatment and under treatment, mostly with chemotherapy). (A detailed description of the patients is given in Supplementary Tables 1, 2, 3, 4).
Samples
From the 60 patients studied (47% female vs. 53% male, mean age 68.5 years) we collected PB samples with a volume of 2-3mL that were analyzed by different techniques. All the primary samples were collected after informed consent of the patients, according to IPOLFG-EPE guidelines. The processing of PB started with the plasma separation by centrifugation. After mononuclear cells (MNC) were separated and purified from PB samples by density gradient centrifugation (Lymphoprep™).
We also obtained 44 paraffin embedded biopsies, 34 BM and 10 LN sections from the patients under study that were used for immunohistochemical staining.
Immunophenotyping by Flow cytometry
To perform flow cytometry analysis by fluorescence-activated cell-sorting (FACS) we used 100μL of PB sample (from a total of 2-3mL) ressuspended in 200μL of FACS buffer (PBS 1x, 2% FBS) and acquired the data corresponding to 50 000 cells in each sample. In order to identify EPC, immunofluorescent staining was performed, with the use of the following fluorescent conjugated antibodies: CD133-PE anti-human monoclonal antibody (Myltenyi Biotec) and anti-human monoclonal antibody KDR-APC
28
(R&D Systems, Inc). We analyzed the presence of circulating EPC (CD133+KDR+ cells) (CEPC) in each patient and we always used another 100μL of PB as control (without any EPC marker). Due to the rarity of this cell population, a patient’s sample was considered CEPC positive if both EPC markers CD133 and KDR were detected with a minimum percentage of 0, 01 events in 50000 cells. We analyzed 44 CLL patients (33 without treatment and 11 under treatment) and 16 SLL patients (8 without treatment and 8 under treatment).
Enzyme-Linked Immunoabsorbent Assay (ELISA)
VEGF levels were measured in plasma of PB samples of 20 CLL patients (14 without treatment and 6 under treatment) and 7 SLL patients (3 without treatment and 4 under treatment), by ELISA (Calbiochem, Dalmstadt, Germany), following the manufacturers’ protocol.
Endothelial Differentiation Assays
After detecting CEPC in PB samples we selected 4 SLL patients (3 without and 1 under treatment) and 4 CLL patients (3 without and 1 under treatment) to perform endothelial differentiation assays. Patients’ selection was based on the percentage of CEPC obtained in FACS analysis: SLL patients with more CEPC vs. CLL patients with more CEPC and SLL patients without CEPC vs. CLL patients without CEPC; without and under treatment. We used total MNC isolated from the same PB samples to perform these assays because of the low percentage of these progenitor cells and we verified the capacity of these cells to differentiate into endothelial cells in vitro.
Endothelial differentiation culture conditions
Isolated total MNC were cultured onto 2% gelatin coated 24 well-plates (5x10⁵
29
Medium-2; Lonza), HEPES-buffered saline 1x (pH=8; GibcoBRL), FBS (Fetal Bovine Serum; Invitrogen), AA (Antibiotic and Antimicotic; Invitrogen), VEGF (Sigma), Heparin (Sigma), and ECGs (Endothelial Cell Growth Supplement, Sigma). Every 2 days, 1μl of VEGF (10μg/mL) and 1μl of Heparin (5000U/μL) were added to the cells. At the end of the differentiation assay, EC markers expression was determined by immunostaining with FVIII-related antigen (FVIII-ra) (1:100, Dako Cytomation M0616, clone F8/86) followed by goat anti-rabbit Alexa Fluor 594 (1:1000, Molecular Probes, Eugene, OR, USA). Cells were examined using a fluorescence microscope (x200 amplification; x 400 amplification, EC-Plan-NEOFLUAR; Axioplan Microscope, Zeiss, Germany).
Immunohistochemical staining of BM and LN sections
Trephine BM (26 from CLL patients and 8 SLL patients) and LN biopsies (5 from CLL patients and 5 SLL patients) were assessed for routine histopathology, microvessel density (MVD) and CD38 tumor cell expression. Tissue samples were fixed in 10% formalin, BM biopsies were further decalcified in rapid bone decalcifier (Perudo00-008; Eurobio, Les Ulis, France), and paraffin embedded. Hematoxilin and eosin-stained sections were characterized for tumor cell distribution pattern in the BM (diffuse/nodular/interstitial) and lymph node (diffuse/proliferation centers). Immunohistochemistry was performed using automated immunohistochemical stainer (Techmate 500 Plus Dako, Dako Cytomation); tissue sections were incubated with mouse anti-human von Willebrand factor (Clone F8/86, 1:20, M0616, Dako Cytomation) and CD38 (Clone SPC32, 1:50, NCL-CD38-290, Novocastra), and immunodetection was performed with the ChemMate Dako EnVision detection kit (Dako Cytomation) employing Peroxidase/Diaminobenzidine. Vessels were counted in five high power fields (“hot spots”) (amplification: 200x) per biopsy and MVD expressed as the mean number of vessels per 0.72mm2. CD38 immunostaining was subjectively characterized by two independent observers according to staining intensity (no staining/staining low/medium/high) and distribution pattern (diffuse/proliferation centers).
30
TUNEL assayTo assess cell apoptosis, analysis of DNA fragmentation by transferase-mediated dUTP nick-end labeling (TUNEL) was determined in the paraffin embedded BM (20 from CLL patients and 7 SLL patients) and LN biopsies (3 from CLL patients and 5 SLL patients) using In Situ Cell Death Detection kit, POD (Roche Diagnostics, NJ, USA) and Histostain® Plus Broad Spectrum, DAB (Cat. No. 85-9643, Zymed Laboratories Inc., California, USA) kits following the manufacturer´s instructions with some modifications. BM and LN sections were analyzed by fluorescence and light microscopy. In both staining, for the quantification of positive cells in stained sections, 5 high power fields (hpf) (400x amplification) with more stained nuclei were analyzed and the average of positive cells per biopsy determined.
RNA Extraction
Total RNA was extracted from the MNC that were previously isolated from the PB samples using the TRIZOL reagent (Invitrogen™) following the manufacturer’s protocol.
miRNA microarrays
Total RNA extracted as above was used for hybridization of miRNA probes (Exiqon). RNA concentrations were verified using the NanoDrop Spectrophotometer ND-1000 (NanoDrop). To characterize and compare the miRNA expression profile of MNC isolated from the PB, a set of 37 RNA samples was divided in two RNA pools (30 samples from CLL patients without treatment and 7 samples from SLL patients without treatment). The miRNA expression profile was performed using the miRCURY LNA (locked nucleic acid) array v.11.0 (Exiqon).
Labeling and hybridization were performed as described by the manufacturers. One μg of total RNA of each sample was labeled (Hy3 or Hy5) using the miRCURY LNA microRNA Power labeling kit (Exiqon): CLL pool was labeled with Hy5 and SLL pool
31
was labeled with Hy3. The hybridized microarrays were washed, dried and scanned using a dual-laser Agilent Technologies scanner.
Scanned images were analyzed using Feature Extraction Software (Agilent Technologies), which converts scanner-generated images into quantitative log ratios. Labeling efficiency was evaluated by the signals from the control spike-in capture probes. Background correction was performed using the Local Nearest Neighbor algorithm, which uses multiple local backgrounds in the neighborhood of a given spot to serve as background signal for that feature. Expression values were presented as log ratio of red signal/green signal. For accuracy of the log ratios calculation, dye normalization was performed using the Feature Extraction Software. Log ratio errors and associated p-values, which determines the probability of that a log ratio is significantly different from zero, were also calculated.
Analysis of the microarrays
Expression values (log ratios) extracted from the Feature Extraction Software were analyzed for 1.8 fold changes in expression. Threshold of miRNAs expression for analysis was calculated using Power 2 average of log ratio. Using this threshold only the differentially expressed microns were analyzed. TIGR Multiple Experiment Viewer software package (MeV version 4.1) was used to perform data analysis and visualize the results.
cDNA synthesis and qRT-PCR
cDNA was synthesized from 1μg of total RNA from CLL and SLL pools, using the NCode™ miRNA first-strand synthesis (Invitrogen™). This method provides the polyadenylation of mature microRNAs of total RNA and synthesis of cDNA from the tailed miRNAs using SuperScript™ III RT and a universal RT Primer provided. MicroRNAs were quantified by quantitative RT-PCR (qPCR) with SYBR Green (Invitrogen™) using a Universal qPCR primer provided and primers to target specific
32
miRNAs in ABI PRISM 7900HT Sequence Detection System (Applied Biosystems). Two μl of diluted cDNA (1:2) was used as template in 20μL qPCR reactions with 10 μM of each primer and 1x Platinum SYBR Green qPCR Super Mix-UDG. Thermocycling parameters were: 50°C for 2 min; 95°C for 10 min; 40 cycles of 95°C for 15 s, 60°C for 1 min; 95°C for 15 s, 60°C for 15 s, and 95°C for 15 s. Negative controls were water (no cDNA). The human 18S rRNA was used as endogenous control to normalize RNA input levels.
Relative expression was calculated using the comparative method 2-ΔΔCt. Primers used in the qRT-PCR reactions are listed on Supplementary Table 5.
Bioinformatic Integration of mRNA and miRNA Expression Data
The predicted targets for each miRNA selected for further analyses were performed using the databases available online: miRanda and miRBase (microrna.sanger.ac.uk), TargetScan (www.targetscan.org), DIANA microT (diana.pcbi.upenn.edu) and PicTar (pictar.bio.nyu.edu).
Statistical analysis
Results are expressed as mean ± standard deviation (SD). Data were analyzed using the GraphPad Prism v. 5.0 (GraphPad Software). Statistical significance of differences was assessed by unpaired two-tailed Student’s t test and Mann Whitney two-tailed test.
Results from the correlation between VEGF plasma levels and the percentage of CEPC were assessed with the nonparametric correlation (Spearman test) and the level
of significance was set at Spearman r ≥ 0.95 and p < 0.05. p values of less than 0.05
33
The patients were divided into 4 groups, according to the phase of the disease (leukemia vs. lymphoma presentation) and clinical treatment after the diagnosis (without treatment and under treatment, mostly with chemotherapy). All the subsequent analysis was performed with the aim of comparing CLL patients vs. SLL patients, without treatment vs. under treatment.
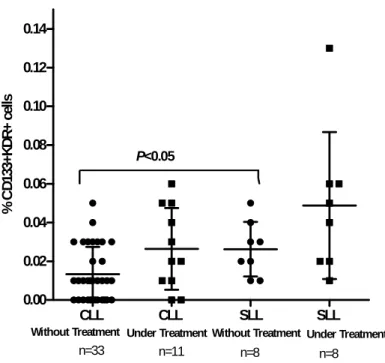
Quantification of EPC in PB samples from CLL and SLL patients
As determined by FACS analysis, performed with the software FlowJo version 7.2.5
(Supplementary Tables 1,2,3,4; Supplementary Figure 1), 46/60 (77%) of the
patients studied had CEPC (CD133+KDR+ cells). CLL patients had more CEPC-positive samples (50%) than SLL patients (27%).
Our results suggest significant differences between the percentage of CEPC in SLL patients without treatment vs. CLL patients without treatment (p<0.05), verified by a higher percentage of EPC in the circulation of SLL patients without treatment (Figure
2). Interestingly, the group of SLL patients under treatment had the highest number of
CEPC in PB. These results show that patients with SLL have higher number of circulating EPC, regardless of their treatment status.
34
CLL CLL SLL SLL 0.00 0.02 0.04 0.06 0.08 0.10 0.12 0.14 n=33 n=11 n=8 n=8 P<0.05Without Treatment Under Treatment Without Treatment Under Treatment
% C D 13 3+ KD R+ ce lls
Figure 2. CEPC in PB of SLL and CLL patients. The percentage of circulating EPC was determined by flow cytometry analysis. Average values are represented and associations between variables (SLL and CLL; without and under treatment) were evaluated by Student’s t test and Mann Whitney test.
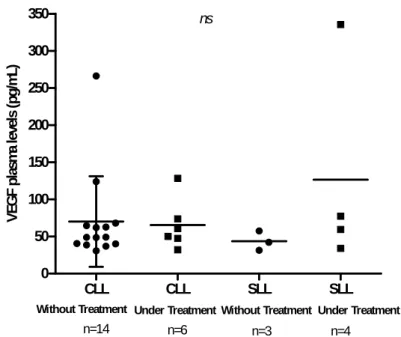
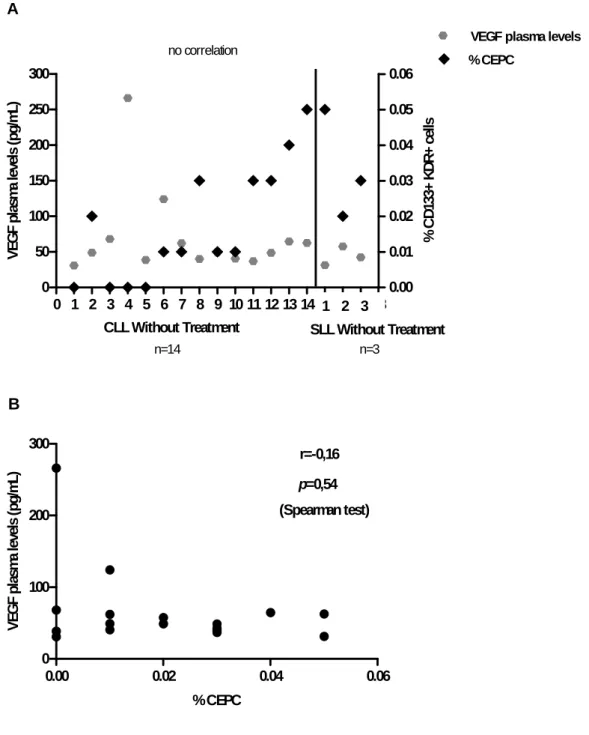
CEPC correlate with VEGF plasma levels
Levels of circulating VEGF, measured in plasma samples, were higher in SLL patients than in CLL patients under treatment (126,6±140,3pg/mL (n=4) vs. 65,38±33,76pg/mL (n=6), respectively), but the opposite occurred in patients without treatment (43,74±13,08pg/mL (n=3) vs. 70,09±60,93pg/mL (n=14), SLL patients vs. CLL patients, respectively) (Figure 3).
These data suggest that in the patients studied, VEGF plasma levels do not vary, regardless of the phase of the disease (SLL vs. CLL) and of the treatment status.
35
Results
CLL CLL SLL SLL 0 50 100 150 200 250 300 350 ns n=14 n=6 n=3 n=4Without Treatment Under TreatmentWithout Treatment Under Treatment
V EG F p lasm a l evel s ( pg /m L)
Figure 3. Circulating VEGF measured in plasma samples from SLL and CLL patients; both without and under treatment. Average values are represented and the comparison between the two groups SLL and CLL in the same clinical situation was evaluated by Mann Whitney test.
A comparison was made between the percentage of CEPC and the VEGF plasma levels both obtained from PB samples. The results indicate no correlation between the two angiogenesis-related parameters and the two phases of the disease (Figure 4B;
Figure 5B), confirmed with the nonparametric Spearman test.
Results suggest that CEPC are increased in SLL patients in both groups (without and under treatment), but no correlation was verified between VEGF plasma levels and CEPC in these patients (Figure 4B; Figure 5B).
36
0 1 2 3 4 5 6 7 8 9 10 11 12 13 14 15 16 17 18 0 50 100 150 200 250 300 0.00 0.01 0.02 0.03 0.04 0.05 0.06VEGF plasma levels % CEPC
CLL Without Treatment SLL Without Treatment
1 2 3 n=14 n=3 no correlation A V EG F p lasm a l evel s ( pg /m L) % C D 133+ KDR+ cel ls
0.00 0.02 0.04 0.06 0 100 200 300 r=-0,16 p=0,54 (Spearman test) B % CEPC V EG F p la sm a levels ( pg /m L)
Figure 4 A, B. Correlation between angiogenic cytokines (VEGF plasma levels) and CEPC in patients without treatment (CLL patients n=14 and SLL patients n=3).
37
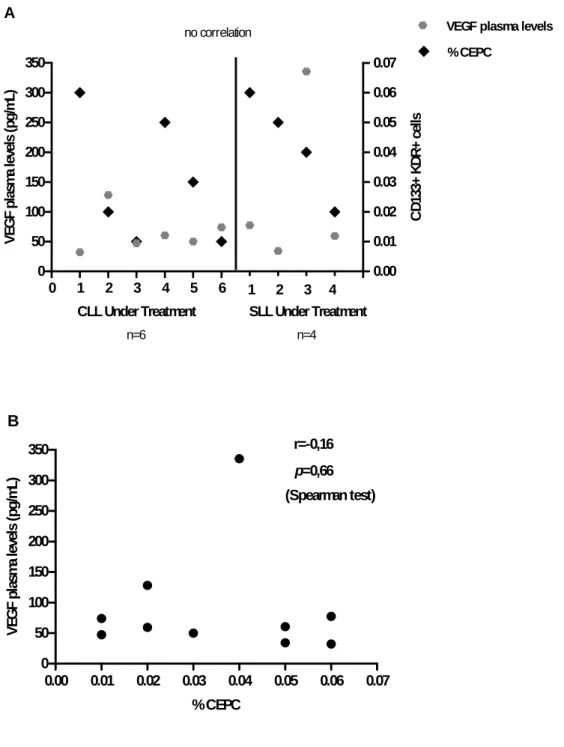
0 1 2 3 4 5 6 7 8 9 10 11 0 50 100 150 200 250 300 350 0.00 0.01 0.02 0.03 0.04 0.05 0.06 0.07 % CEPCVEGF plasma levels
no correlation
CLL Under Treatment SLL Under Treatment
n=6 n=4 1 2 3 4 A V EG F p las m a l evels ( pg /m L) C D 13 3+ K D R + ce lls
0.00 0.01 0.02 0.03 0.04 0.05 0.06 0.07 0 50 100 150 200 250 300 350 r=-0,16 p=0,66 (Spearman test) B % CEPC V EG F p la sm a le ve ls (p g/ m L)
Figure 5 A, B. Correlation between angiogenic cytokines (VEGF plasma levels) and CEPC in patients under treatment (CLL patients n=6 and SLL patients n=4).
38
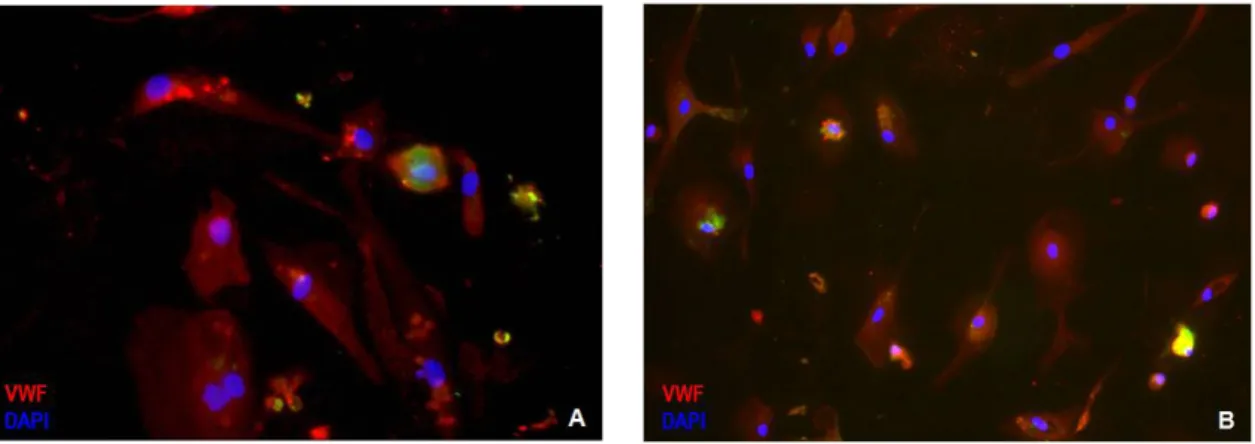
CEPC differentiate into functional endothelial cellsTo validate the importance of circulating EPC in CLL and to prove their endothelial potential we cultured EPC in well established endothelial differentiation assays.
At the end of the endothelial differentiation assay (4 weeks) the differentiated cells show endothelial morphology and express endothelial-specific markers (VWF+ cells). From the 8 patients selected we only observed the differentiation of endothelial cells in 2 patients: one of the CLL patients with more CEPC (under treatment) (Figure 6A) and one of the SLL patients without CEPC (without treatment) (Figure 6B).
Figure 6 A. Endothelial differentiation observed in EPC isolated from CLL patient under treatment (x400 amplification) and in (B) EPC isolated from SLL patient without treatment (x200 amplification).
39
Microvessel density, tumor cell apoptosis and CD38 expression by CLL cells in BM and LN biopsies allows differentiating SLL from CLL phases.Having studied the angiogenesis-related parameters in circulation, we next quantified the angiogenic index (number of vessels per five high power fields). We also evaluated cell apoptosis (number of apoptotic cells per five high power fields) and CD38 tumor cell expression in each BM and LN section.
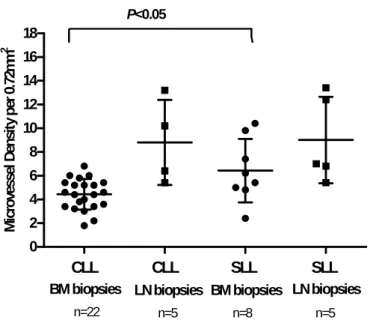
We quantified more vessels in BM biopsies from SLL patients than in BM sections from CLL patients (p<0.05, Unpaired t test). This observation could be related with a more aggressive phenotype (Figure 7).
Taken together, these data suggest that the higher percentage of CEPC quantified in SLL patients could be related with increased microvessel density in BM biopsies observed (Figure 8 A).
CLL CLL SLL SLL 0 2 4 6 8 10 12 14 16 18 n=22 n=5 n=5
BM biopsies LN biopsies BM biopsies LN biopsies
n=8 P<0.05 M icro ves sel D en si ty pe r 0. 72 m m 2
Figure 7. Microvessel density was quantified in SLL and CLL biopsies (BM and LN) after immunohistochemical staining for blood vessels (Factor VIII). Values represent the median vessel score determined as the average number of blood vessels detected in five high power fields (hpf = 400x magnification) per biopsy.
40
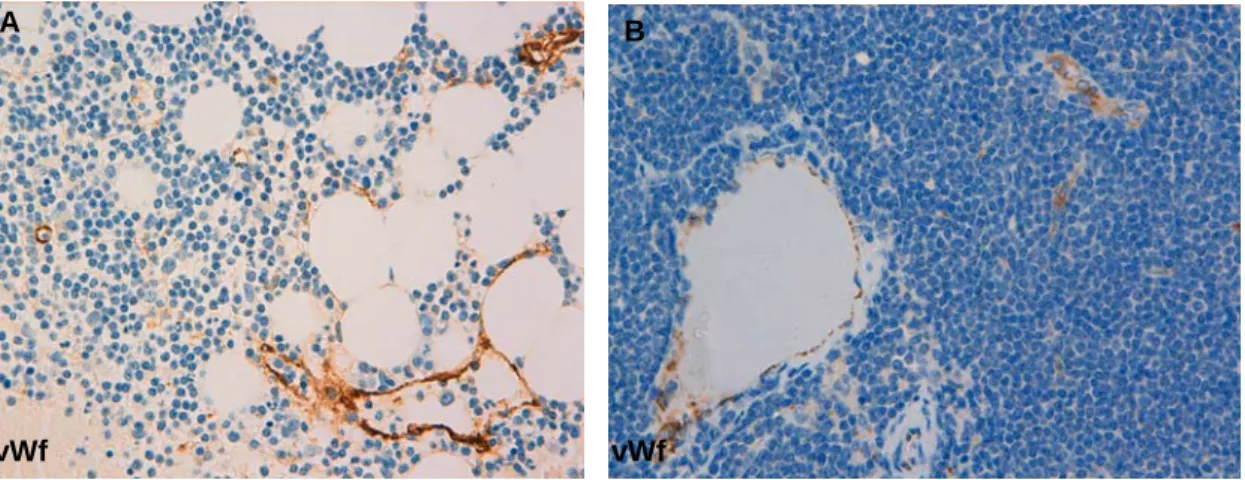
Figure 8. MVD in BM and LN of SLL patients assessed by immunohistochemistry for vWf in paraffin-embedded sections. A) BM trephine biopsy (x400 amplification). B) LN trephine biopsy (x400 amplification).
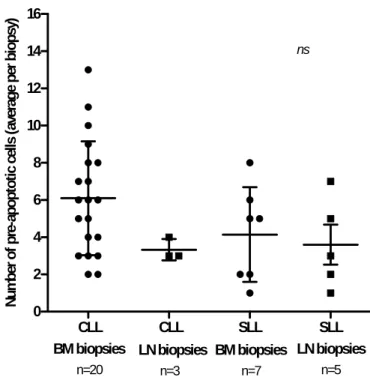
As determined by TUNEL staining, BM biopsies from CLL patients had higher number of tumor cell apoptosis when compared with BM biopsies from SLL patients. LN biopsies from the 2 groups (CLL and SLL) showed a similar average of apoptotic cells per biopsy (Figure 9).
vWf vWf B
41
CLL CLL SLL SLL 0 2 4 6 8 10 12 14 16 n=20 n=3 n=7 n=5 nsBM biopsies LN biopsies BM biopsies LN biopsies
N um be r of pr e-apoptot ic c el ls (aver ag e p er b io psy)
Figure 9. Tumor Cell apoptosis in BM and LN sections assessed by TUNEL staining. Average values per biopsy (BM and LN) are represented.
42
Figure 10. Apoptotic cells (green nuclei) in LN biopsies from CLL and SLL patients (A, C; respectively) and in BM biopsies from CLL and SLL patients (B, D; respectively) (x 400 amplification).The results suggest no differences between the CD38 staining in the distribution pattern observed in LN from SLL vs. CLL patients, but the staining intensity observed in these biopsies were higher in SLL patients (Figure 11A). In the BM biopsies we observed that almost all biopsies from CLL patients were negative for CD38 staining and again the CD38 staining intensity was higher in the BM biopsies of SLL patients
43
LN Biopsy + +/- -Diffus e Proliferati on Ce nters Nega tive LowMedium High
0 20 40 60 80 100 Tumor Cell CD38 Staining CD38 Staining Intensity SLL (n=5) CLL (n=5) Tumor Cell in Proliferation Centers A % P ati en ts
Figure 11 A. Characterization of CD38 tumor cell expression in LN biopsies from SLL and CLL patients. + (positive); +/- (more or less); - (negative).
Diffus e Nodu lar Inters titial + - Low
Medium Hig
h 0 20 40 60 80 100 SLL (n=8)CLL (n=26) Tumor Cell Distribution Pattern Tumor Cell
CD38 Staining CD38 Staining Intensity
BM Biopsy B % P ati en ts
Figure 11 B. Characterization of CD38 tumor cell expression in BM biopsy samples from SLL and CLL patients. + (positive); +/- (more or less); - (negative).
44
Figure 12. CD38 tumor cell expression in BM and LN of SLL patients assessed by immunohistochemistry for CD38 in paraffin-embedded sections. A) BM trephine biopsy (x400 amplification). B) LN trephine biopsy (x400 amplification).
45
MicroRNA profiling of lymphoma and leukemic “stages” of Chronic Lymphocytic LeukemiaThe miRNA expression profile of MNC isolated from the PB of 30 CLL patients and 7 SLL patients, both without treatment, showed that there are different miRNA patterns associated with these two forms of the disease. From a total of 7076 miRNAs probes (including 4 replicates per probe) and using Feature Extraction Software we obtained 1430 miRNAs up-regulated and 1213 miRNAs down-regulated in CLL (Figure 13).
Figure 13. Spatial Distribution of Significantly Up-Regulated and Down-Regulated miRNAs using Feature Extraction Software.
As miRNA probes were replicated four times per array, the average of the signal intensities for each miRNA, expressed as log ratio between Hy5 and Hy3, were calculated and the resulting signal intensities expressed as average of log ratio. The variability between signal intensities for miRNAs replicates, given by standard error of the mean, was low for CLL pool, while the SLL pool generated average of log ratios characterized by higher variability, which may be the result of poor RNA quality and quantity in SLL samples.
From the range of signal intensities obtained, a miRNA was considered up-regulated when expression crosses a threshold of 1.8 fold-variation. Using this cutoff, 39 miRNAs up-regulated in CLL were obtained. The most up-regulated miRNAs in CLL were miR-
(1213) (1430)
46
than in SLL samples (Supplementary Figure 2).
A miRNA was considered down-regulated when expression crosses a threshold of 0.5 fold-variation (half of the expression). Using this cutoff, 15 miRNAs down-regulated in CLL were analyzed. The most down-regulated miRNAs in CLL were 1277, miR-581, miR-548o and miR-942 which were about 0.6 times less expressed in CLL than in SLL samples (Supplementary Figure 3).
MicroRNAs were considered differentially expressed for a threshold of 1.8, where expression values given by the average of log ratio with 1.8 fold-variations were analyzed. Differentially expressed miRNAs using this threshold were clustered using hierarchical unsupervised average linkage and Euclidean distances. Based on the defined threshold, 54 miRNAs were differentially expressed in CLL vs. SLL. In red are listed the miRNAs up-regulated in CLL and in green miRNAs up-regulated in SLL
47
Figure 14. Microarray profiling of 54 miRNAs differentially expressed in CLL and SLL. Unsupervised average linkage hierarchical clustering (Euclidean distance) was performed. The color display encodes the logarithm of the expression changes, where varying shades of red and green indicate up and down regulation in CLL and the opposite in SLL.To validate the results of miRNA microarrays we performed qRT-PCR for 11 miRNAs up-regulated in CLL pool and seven miRNAs down-regulated in SLL pool. From the microarrays expression data we have identified miR-1277 and miR-1202 as the most down-regulated miRNAs in CLL, while miR-142-3p, miR-19a, miR-155 and miR-451 were the most up-regulated miRNAs in CLL (Figure 16).