ADVANCE
–
Centro de Investigação Avançada do ISEG
“
Do Insiders Time Their Trades? Evidence from Euronext Lisbon
”
WORKING PAPER N. 6 /2008
October, 2008
Abstract
In this paper, we examine the existence of insider trading abnormal profits in Euronext Lisbon from January 2001 to December 2005. Using the methodology of event studies, our overall results show that, in spite of existing legislation to regulate transactions, insiders are still able to make abnormal profits. Results also show that insider buying is a stronger indicator than insider selling and that the magnitude and duration of
abnormal profits depend on both firm and transaction-specific factors. These include industry classification, firm size, firm valuation and relative trading volume..
Key words: insider trading; information and market efficiency; event studies;
abnormal return; corporation and securities law; asymmetric and private information.
JEL Classification: G14, K22, D82. _________________
* Corresponding author
** Financial support granted by the Fundação para a Ciência e a Tecnologia (FCT) and the Programa Praxis XXI is gratefully acknowledged.
† We appreciate the helpful suggestions and insightful comments made by Marco Bonomo, Qinglei Dai, Victor Cardoso and Ana Sousa. We would also like to thank Niã, Dinho and Carla for their encouragement throughout this project.
Pedro Gonçalves
Technical University of Lisbon School of Economics and Management
Rua Miguel Lupi, 20 1249-078, Lisbon, Portugal
João Duque
Technical University of Lisbon School of Economics and Management
Rua Miguel Lupi, 20 1249-078, Lisbon, Portugal
1. INTRODUCTION
“Unless […] insiders just happened to possess superior analytical ability, their excess return must be due to the illegal exploitation of insider information”.1
Insider trading literature deals with the following question: do insiders make use of
non-public information to earn profits larger than they would have had if they traded on the
available public-information?
In our study we assume insiders to be those individuals who are compelled to inform the
Portuguese Securities Market Commission (CMVM - Comissão do Mercado de Valores
Mobiliários) about the purchase and disposal of shares from the company with which they are related. CMVM is responsible for the regulation and supervision of the Portuguese
stock market and tries to guarantee its integrity and transparency. Therefore the regulator,
through the Portuguese Securities Code (CVM - Código dos Valores Mobiliários) imposes
a rule set to prevent insiders from using privileged information while trading stocks of their
own firms. The Portuguese Securities Code (article 378, n.°3) describes privileged
information as “all non-public information that, being accurate and with respect to any issuer or securities or other financial instruments, would be capable, if it was given
advertising, of influencing in a sensitive manner its price in the market”.
The reason for all the attention dedicated to insiders´ activities is best summarized in an
article in “Individual Investor” (Feb. 1998, p. 54): “Company executives and directors
know their business more intimately than any Wall Street analyst ever would. They know
when a new product is flying out the door, when inventories are piling up, whether profit
margins are expanding or whether production costs are rising…You always hear about the
smart money. Generally, that is the smart money.” In our paper, we assume this kind of
knowledge as being privileged information as well.
Therefore, our investigation aims to detect and measure the existence of insider trading
abnormal profits in Portugal during the period from January 2001 to December 2005. It
will cover, when available, all insider transactions on companies from Euronext Lisbon.
To decide whether or not insiders time their trades, we use the traditional methodology of
event studies to test the existence of abnormal returns around the days when insiders
purchase or sale their company shares.
Following the literature, we also tested if the magnitude and duration of abnormal profits
depend significantly on firm-specific and transaction-specific factors (such as industry
classification, firm size, firm valuation and relative trading volume of the insider
transactions).
The remainder of this work is organized as follows. Chapter 2 presents the literature
review. Chapter 3 presents the problem identification, where we summarize the legal
framework regarding insider trade activity in Portugal. Chapter 4 describes the data and
provides the summary statistics and chapter 5 the methodology applied. Chapter 6
discusses the empirical results and chapter 7 concludes the study.
2. LITERATURE REVIEW
Many studies conclude that insiders can earn abnormal profits through trading stocks of
their own firms. Nevertheless, the intensity, pattern, duration and significance of those
profits have varied substantially across countries and markets. The magnitude of abnormal
profits depends on firm-specific and transaction-specific factors (such as firm size, trading
volume, etc.), and the conclusions may also depend on whether insiders are purchasing or
selling shares. The conclusions can be affected by modifying the standard event study
methodology assumptions, and the regulation and enforcement of insider trading laws can
also play a major role. This particular aspect turns this research very market dependent
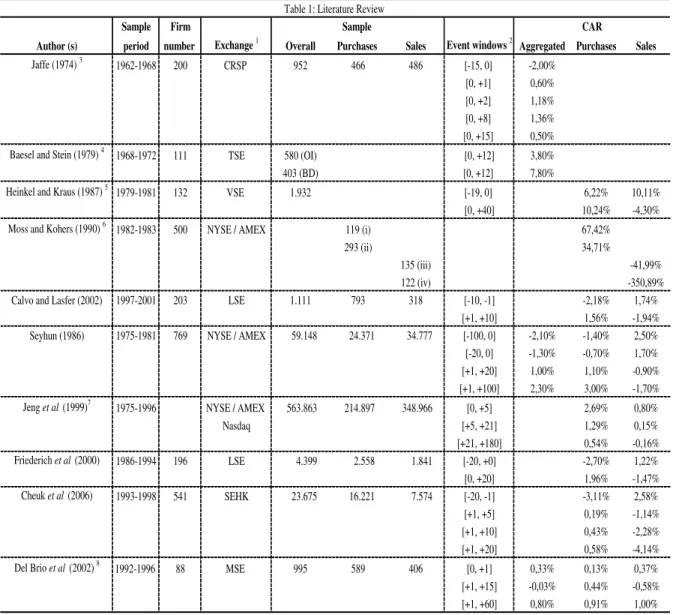
Table 1 summarizes the main results in the literature. There is a common pattern in the
literature: insiders’ purchases (sales) are typically preceded by negative (positive) abnormal
returns before the transaction date and for the event day as well. After the event takes place,
the purchases are followed by positive returns while after the sales share prices usually
decrease.
Sample Firm
Author (s) period number Exchange 1 Overall Purchases Sales Event windows 2 Aggregated Purchases Sales
Jaffe (1974) 3 1962-1968 200 CRSP 952 466 486 [-15, 0] -2,00%
[0, +1] 0,60%
[0, +2] 1,18%
[0, +8] 1,36%
[0, +15] 0,50%
Baesel and Stein (1979) 4 1968-1972 111 TSE 580 (OI) [0, +12] 3,80%
403 (BD) [0, +12] 7,80%
Heinkel and Kraus (1987) 5 1979-1981 132 VSE 1.932 [-19, 0] 6,22% 10,11%
[0, +40] 10,24% -4,30%
Moss and Kohers (1990) 6 1982-1983 500 NYSE / AMEX 119 (i) 67,42%
293 (ii) 34,71%
135 (iii) -41,99%
122 (iv) -350,89%
Calvo and Lasfer (2002) 1997-2001 203 LSE 1.111 793 318 [-10, -1] -2,18% 1,74%
[+1, +10] 1,56% -1,94%
Seyhun (1986) 1975-1981 769 NYSE / AMEX 59.148 24.371 34.777 [-100, 0] -2,10% -1,40% 2,50%
[-20, 0] -1,30% -0,70% 1,70%
[+1, +20] 1,00% 1,10% -0,90%
[+1, +100] 2,30% 3,00% -1,70%
Jeng et al (1999)7
1975-1996 NYSE / AMEX 563.863 214.897 348.966 [0, +5] 2,69% 0,80%
Nasdaq [+5, +21] 1,29% 0,15%
[+21, +180] 0,54% -0,16%
Friederich et al (2000) 1986-1994 196 LSE 4.399 2.558 1.841 [-20, +0] -2,70% 1,22%
[0, +20] 1,96% -1,47%
Cheuk et al (2006) 1993-1998 541 SEHK 23.675 16.221 7.574 [-20, -1] -3,11% 2,58%
[+1, +5] 0,19% -1,14%
[+1, +10] 0,43% -2,28%
[+1, +20] 0,58% -4,14%
Del Brio et al (2002) 8
1992-1996 88 MSE 995 589 406 [0, +1] 0,33% 0,13% 0,37%
[+1, +15] -0,03% 0,44% -0,58%
[+1, +60] 0,80% 0,91% 1,00%
1 - Abbreviations: CRSP (Chicago Research in Security Prices); TSE (Toronto Stock Exchange); VSE (Vancouver Stock Exchange); NYSE (New York Stock Exchange); AMEX (American Stock Exchange); London Stock Exchange (LSE); Stock Exchange of Hong Kong (SEHK); Madrid Stock Exchange (MSE). 2 - Jaffe (1974) and Baesel and Stein (1979)
considered monthly data while the remaining authors dealt with daily security data. 3 - Results from Jaffe (1974) initial sample. 4 - Baesel and Stein (1979) chose to divide the trading activities into two subgroups: ordinary insiders (OI) and bank directors (BD). 5 - The only insider event with even marginally significant abnormal returns after the event was large net trades made in high volume fraction (active) weeks. 6 - The authors used the paired-difference test to compare the means of two variables (mean return to insiders and mean market return) when data are obtained from samples that are related. i) Buying prior to earning greater than expected; ii) Buying prior to dividend increase; iii) Selling prior to earning less than expected; iv) Selling prior to dividend decrease. 7 - Jeng et al (1999) used the CAPM to evaluate the equally weighted returns to all insider trades. The authors have also employed the 4-Factor Model and the
Characteristic-Selectivity (CS) Measure methods. 8 - Del Brio et al (2002) results, using the traditional market model in the return-generating process.
Table 1: Literature Review
3. THE PROBLEM IDENTIFICATION
If an insider trades on privileged information, then one would expect to see insiders
purchase in days before the security price increases and sell them in the days before the
security price declines. This is the main hypothesis on which we have based our
investigation. “If non-informed investors are aware of the wealth transfer induced by insider trading, they refrain from trading, resulting in illiquidity, and therefore inefficiency
in the markets” (Kyle, 1985). Beny (2005) found that “countries with more prohibitive
insider trading laws have more accurate stock prices and more liquid stock markets”.
As a result, regulators tried to “impose a rule set to enhance investor’s confidence about the fairness of trading in the financial market” Bhattacharya and Daouk’s (2002). The
Portuguese Securities Code (article 378, n.°1) imposes that whoever holds and trades based
on privileged information should “be punished by imprisonment for a maximum of three years or by a fine”.
3.1. Legal Framework
Insider trading is regulated in Portugal by the “CMVM Regulation N°. 7/2001 Corporate
Governance (with the amendments introduced and re-published by CMVM Regulation N°.
11/2003)”. According to the article 3 of this regulation, CMVM must be informed of the purchase and disposal of shares admitted for trade in a regulated market involving: a)
Members of the board of directors of the company issuing the shares; b) Members of the
board of management of a parent company of the issuer of the shares; c) A company
controlled by one of the persons mentioned in items a) and b); and d) A person acting on
behalf of the persons mentioned in items a) and b). In our investigation, we assume these
individuals to be insiders.
They are required to notify the invested company of the transactions within seven working
days after the event. The invested company must notify immediately CMVM of the
insider transactions is only available to the public when the company releases its annual
reports.
In spite of the legal framework, CMVM has detected various illegal insiders trading
activities as reported on its annual reports. The activities reported by the regulator are only
related to illegal inside trading, which means the acquisition or disposal of financial
instruments by a person who knows, or should know, that the information possessed is
inside information. The article 3 of the “CMVM Regulation N°.7/2001” came into force on
1 February 2002. Thus, for the financial year commencing on January 2001, all companies
we have included in our sample have already started disclosing their annual reports with
information in appendixes regarding inside trading actions.
In the meantime, Portugal witnessed the first condemnatory sentence for the crime of inside
trading, pronounced by the Criminal Court in Lisbon on 25 July 2003. The Court convicted
a non-executive member of the Board of Directors and shareholder in the company
“Vidago, Melgaço & Pedras Salgadas, SA”, as the mastermind of the crime of insider
trading.
3.2. The Study Hypothesis
In our investigation, we analyse the abnormal return for each company to identify these
(illegal) and other potential insider trading activities.
We have based our investigation on one main hypothesis: that an insider earns abnormal
returns if after purchases (sales) stock prices rise (decline) abnormally. We try to answer
the questions using the traditional event study methodology, where the null hypothesis to
be tested is whether abnormal returns in the event day and for the surrounding period are
Abnormal returns are also analysed for industry classification, as well as for samples
grouped by firm size, relative trading volume, price to book ratio (P/B) and price earnings
ratio (P/E).
Wong (2002) found that when cumulative daily excess returns are separated by firm size
according to each firm’s market capitalization, only the smallest capitalization shows
significant returns within the post event period. Small firms are found to generate the
largest and most persistent abnormal profits. Trading volume is found to be positively
associated with the quality of information. Relative trading volume is therefore used as an
indicator of the quality of information associated with each insider transaction. The sample
is also grouped and ranked by P/B and P/E to examine if insiders take into account their
company valuation while trading shares of their own firms. It is hypothesized that high P/B
may predict bad performance, while low P/B value predicts good performance. 2 The
literature also documented (see Cheuk et al. (2006)) a negative relationship between P/E
and future stock returns. With this valuation hypothesis, we are expecting to see purchases
with high (low) P/B and P/E to perform worse (better). On the other hand, we do expect to
see sales with high (low) P/B and P/E to perform well (poorly).
4. DATA CONSTRUCTION
Our original sample included the 55 shares listed in the Eurolist from Euronext Lisbon at
the end of 2005. The sample period of this study is January 2001 to December 2005,
covering two years of market slump (PSI-20 dropped 24,73% in 2001 and 25,62% in
2002), and three years of market rally (PSI-20 gained 15,84% in 2003; 12,64% in 2004 and
13,40 % in 2005).
Each company’s data was manually collected from their annual reports. Data on daily cash-dividend-adjusted stock returns were obtained from the Bloomberg terminal database. For
each company, as well as for the benchmark index, we have extracted daily closing prices
2 Cheuk et al. (2006) assume this hypothesis, using the book to market ratio. We assume the same hypothesis
to calculate daily returns. Our analysis only considered insider transactions dealing with
shares, which led us to drop all transactions with bonds and other related securities, such as
derivatives. Transactions upon treasury’s stocks were also dropped.
Within the sample period, we initially collected 2.426 insider transactions. Then, following
Del Brio et al. (2002) “we excluded a number of transactions that are not likely to be
driven by privileged information”. Consequently, 1.142 observations were withdrawn from
the sample. We separated the excluded data into eight categories as reported in Table 2.
Increase Decrease Total
(1) Conversions 16 - 16
(2) Capital increase & IPO 134 2 136 (3) Remunerations plans 398 74 472 (4) Transferences 17 12 29 (5) Takeover 1 1 2 (6) Capital change 16 - 16
(7) No date 47 46 93
(8) Corporate insiders 307 71 378
Total 936 206 1.142
Table 2: Transactions Excluded from the Sample
All the above-described screening resulted in 1.284 eligible transactions. “In cases where
an insider has carried out more than one transaction in a particular day, we include only one
transaction”, adding up the shares purchased or sold. This screening reduced the sample to
1.080 observations, with 686 purchases and 394 sales. “There were transactions where
either the same or different directors from the same firm were trading in different
directions” (e.g., a purchase of 25.000 shares and a sale of 201.793 on the same day). “In
this case, net transactions were reported”, (i.e., 176.793 as sale) Calvo et al. (2002). The sample was then reduced to 1.059 trades. Finally, we have also applied the Brown and
Warner (1985) procedure: for a security to be included in the sample, “it must have at least
30 daily returns in the entire period (estimation window plus the event window), and no
missing return data in the last 20 days”. This allows us to reduce the influence of asynchronous trading.
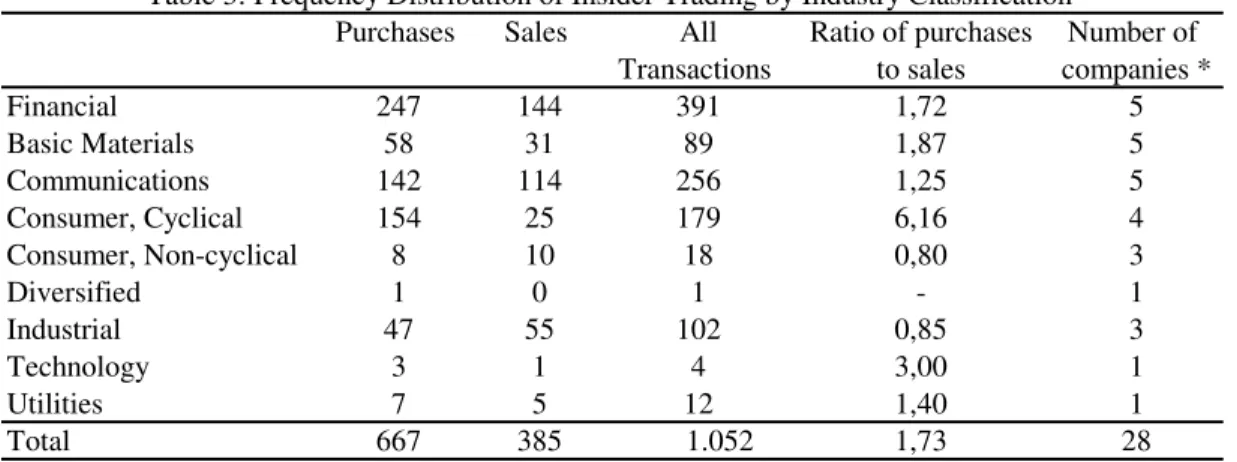
With this last screening our sample was reduced to 1.052 transactions, and the number of
firms dropped to 28. Nevertheless, they cover all the nine industry sectors quoted at
Eurolist (as reported in Table 3) and 95% of the Portuguese market capitalization at the end
of 2005.
Purchases Sales All Ratio of purchases Number of
Transactions to sales companies *
Financial 247 144 391 1,72 5
Basic Materials 58 31 89 1,87 5
Communications 142 114 256 1,25 5
Consumer, Cyclical 154 25 179 6,16 4
Consumer, Non-cyclical 8 10 18 0,80 3
Diversified 1 0 1 - 1
Industrial 47 55 102 0,85 3
Technology 3 1 4 3,00 1
Utilities 7 5 12 1,40 1
Total 667 385 1.052 1,73 28
Note: * The figures in the column refer to the number of companies in that industry classification at the end of December 2005. Industry classification is assigned by the Stock Exchange according to the nature of the business of the company.
Table 3: Frequency Distribution of Insider Trading by Industry Classification
Purchases outnumber sales, split into 667 (63%) purchases and 385 (37%) sales. The ratio
of insider purchases to insider sales is 1,73:1, such that almost two out of three insider
transactions are purchases. Although there are far more purchases than sales in each year of
the sample period, the average number of shares per transaction is larger for sales (64.945)
than for purchases (26.152). The ratio between the average number of shares sold by
transaction and the number of shares purchased by transaction is 2,48, which suggest that
shares are usually sold in larger blocks. Seyhun (1998) also found that insiders in the U.S.
are likely to break up purchases into smaller transactions for fear of insider trading
sanctions. He suggested that an insider purchase provides a stronger signal to both the
authority and the general public than does an insider sale.
Table 4 summarizes inside trading activities cut off by firm size, P/B, P/E and relative
trading volume, following Cheuk et al. (2006) procedure. We use three cutoffs to classify
In order to test for the differences by firm size, companies in the sample are segregated into
three groups according to their market capitalization at the time of the insider transactions
(small, medium and large size firms). The size of an inside trading firm is calculated for
every transaction based on the month-end figures of the month prior to when the insider
trading occurred.
As in Cheuk et al. (2006) and other studies, relative trading volume is given as the ratio between total number of shares traded in the insider transaction and the total number of
outstanding shares of the stock at that moment. Total number of outstanding shares is based
on the month-end figure of the month prior to the month when the insider trade occurred.
Each transaction is then ranked by the relative trading volume (low, medium and high) and
is assigned to one of three groups: low relative trading volume, medium relative trading
The P/B is equal to a stock’s price divided by its book value (i.e., total stockholders’
equity) per share. The book value of the insider-trading firm, for every transaction, is based
on the data from the most recent reporting period before trading (quarterly, semi-annual or
annual). In our sample, each transaction is ranked by the P/B of the stock concerned and is
assigned to one of the three groups: low P/B, medium P/B, and high P/B. In this particular
analysis we have dropped 42 transactions from our sample, since book value information
was not available3.
The P/E is the ratio of the current share price to earnings per share (EPS) of the past year.
The EPS of the inside trading firm for every transaction is based on the fiscal year-end
figure of the year prior to that year when insider trading occurred. Similar to the analysis
with the previous ratio, each transaction is ranked by the P/E of the stock concerned and is
assigned to one of three groups: low P/E, medium P/E, and high P/E. In this examination,
the sample of 1.052 transactions was reduced to 720, since there were 332 transactions
where the respective EPS was negative and therefore P/E was not computed.
4.2. Sample Adjustments
Throughout this research, we have done some sample modifications and adjustments
related to complications arising from violations of the statistical assumptions, being able to
accommodate more specific hypotheses.
The first one was brought forward by MacKinlay (1997) who states that while aggregating
the abnormal returns across firms “it is assumed that there is no clustering, meaning that the event windows of the included securities do not overlap in terms of calendar time. This
assumption allows us to calculate the variance of the aggregated sample cumulative
abnormal returns without concerning about the covariances across securities because they
are assumed to be null”. If this assumption is incorrect, then the parametric tests may be
biased. Therefore, distributional results presented at the section 5 for the aggregated
abnormal returns will no longer be valid. Brown and Warner (1985) point out that, in
3 This is the reason why in Table 4 the number of purchases and sales (N) drops when section C is compared
general, “the use of daily or weekly data makes clustering of events on a single day much less severe than the use of monthly data”. “Diversification across industries also mitigates
the problem”; as stated by Bernard (1987). Since our sample is highly diversified (all
industry sectors are present in our data) we hope to overcome the referred problem.
Following the portfolio approach suggested by MacKinlay (1997), the abnormal returns for
those securities that share the same event day were aggregated into a single portfolio. We
have build up 171 different portfolios, with an average of 2.15 securities per portfolio. As a
result our sample was thereafter reduced to 855 (522 purchases and 333 sales), from the
previous 1.052 transactions.
Following Calvo et al. (2002), we also built a non-overlapping sample in order to guarantee
that the abnormal return calculation of an inside transaction is not influenced by the
abnormal return of an early event. We assume that when insiders purchase or sell on
consecutive days, they are trading with the same privileged bit of information. In order to
prepare our sample, we follow Duque and Pinto’s (2004) procedure to remove overlapping
of event windows. Therefore, when transactions occurred on consecutive days, or within
less than a five-day time interval, it was assumed as a single inside transaction, and the
“event day” was assumed to include the entire time interval between the day of the first
event and the day of the last event. The use of such a procedure reduced our sample even
further. From 855 we came out with 450 transactions (255 purchases and 195 sales).
5. METHODOLOGY
The methodology and notation for the modelling of abnormal returns (ARi) follow largely
MacKinlay (1997) and Campbell et al. (1997). We have done few additional adjustments in
line with the insider trading literature.
The ARi is computed by subtracting expected returns E [RiX] from the actual returns
Ri (the log return of company i at time ),
). | (
R E R X
X stands for the conditioning set of information for the expected return. Event time (a
counter) is denoted by , with the event date corresponding to = 0. Different authors use
different models to estimate expected returns. However, Brown and Warner (1980) after
comparing different methodologies used in event studies showed “that beyond a simple,
one factor market model, there is no evidence that more sophisticated methodologies
convey any benefit”.
The market model is a statistical model, which relates the return of any given security to
the return of the market portfolio. This method takes into account both market-wide factors
and the systematic risk of each sample security. We used the PSI-20 index as a proxy to the
market portfolio. For any security i the market model is
, it mt i i
it R
R (2)
) 0 ( it
E var( ) 2.
i
it
it is the zero mean disturbance term and i, i, and 2i are the parameters of the market
model. Ri and Rm are the log returns in event period for security i and for the market
portfolio, respectively.
Following the Brown and Warner’s (1985) procedure to compute the ARi we have firstly considered an event window of eleven days [-5, +5], which includes five days before the
event, the event day, and five days after insiders’ transactions. Afterwards, and following
inside trading literature, we analysed other event windows as well: [-5, -1], [+1, +5];
[+1, +10]; [+1, +20] and [+1, +80]. The event day ( 0) is taken as the day the insider
transaction actually takes place.
__|_________[estimation window] _______________|__[event window)___|__________________
For each security we use a maximum of 325 daily returns observations for the period
around its respective event, starting at day T0 = -245 and ending at day T2 = -1, + 5, +10,
+20 or +80 relative to the event, depending on which event window we chose to examine.
The first 239 days period (from = T0 + 1 to = T1) is called the estimation window. For
those event periods that include days before the event day, namely [-5, +5] and [-5, -1], the
length of the event window is L2T2T1 (11 or 5 days). For other event windows starting
at day +1, the length of the event window is L2T2.
5.1. Abnormal Return and its Statistical Properties
Given the market model parameter estimates, one can measure and analyse the ARi,
measured as
.
ˆ ˆ
ˆRi Ri i iRm
A (3)
The abnormal return is the disturbance term (it from equation 2) of the market model
calculated on a sample basis.
It is usual to aggregate the individual securities abnormal returns through time and across
securities in order to draw overall inferences for the event under scope.
The individual securities’ abnormal returns can be aggregated using ÂRi from equation (3)
for each event period = T1 + 1,…, T2. Given N events, the sample aggregated abnormal
returns for period is
N
i i
ÂR N
AR
1
, 1
The average abnormal returns can afterwards be aggregated over the event window using
the same approach as that used to calculate the cumulative abnormal return for each
security i. For any interval in the event window4
, ) , ( 2 1 2 1
AR CAR (5)H0 can be tested using the following statistics5
In order to test if our conclusions could be biased as a consequence of an inadequate model,
we also used the mean adjusted return and the market adjusted return models in the
return-generating process. For the mean adjusted return, abnormal return is taken as
. i i
i R R
AR (8)
Mean adjusted returns are computed by subtracting the average return for stock i during the
estimation period from the stock’s return during the event period. This method does not
explicitly takes into account the risk of the stock and the return of the market portfolio. For
the market adjusted return, abnormal return is taken as,
.
i m
i R R
AR (9)
4 For the variance estimators the assumption that the event windows of the N securities do not overlap is used
to set the covariance terms to zero.
5 This distributional result is asymptotic with respect to the number of securities N and the length of
estimation window L1.
), 1 , 0 ( ~ )
var( 12
1 N
AR AR
(6) ~ (0,1).
)) , ( var( ) , ( 2 1 2 1 2 1 2 N CAR CAR
6. EMPIRICAL FINDINGS
We have initially applied the event study methodology described earlier to all the 1.052
transactions reported previously. Following Brown and Warner’s (1985) methodology we
started by considering an event window of eleven days [-5, +5]. We apply the methodology
for the purchases and sales samples, but also for the aggregated transactions. As stated by
Del Brio et al. (2002), if we believe that both purchase and sale returns should be measured
as positive abnormal returns in the overall sample, excess returns for insiders’ sales should
be multiplied by -1 for the purpose of aggregation. The aggregated results we have
obtained analysing 1.052 transactions are largely consistent with the literature providing
evidences that a security return around insiders’ trades follows a pattern, as shown in
Figure 1.
This finding can be confirmed by analysing the statistical test described earlier, with the
Day AR
-5 -0,05% -1,061
-4 -0,20% -4,204 ***
-3 -0,13% -2,832 ***
-2 -0,09% -1,878 *
-1 -0,27% -5,782 ***
0 -0,34% -7,214 ***
1 0,07% 1,409
2 0,13% 2,802 ***
3 0,04% 0,798
4 0,04% 0,890
5 0,03% 0,683
The symbols ***, **, and * indicate two-tail significance at the 1%, 5% and 10% levels, respectively.
Table 5: Results of Tests to Abnormal Return Overall sample
Test 1
The first striking result is that insiders’ transactions are preceded by negative abnormal
returns during the five days before the event and for the event day as well, which means
that insiders wait for a short-run persistent decline (increase) in the stock price to buy (sell)
shares.
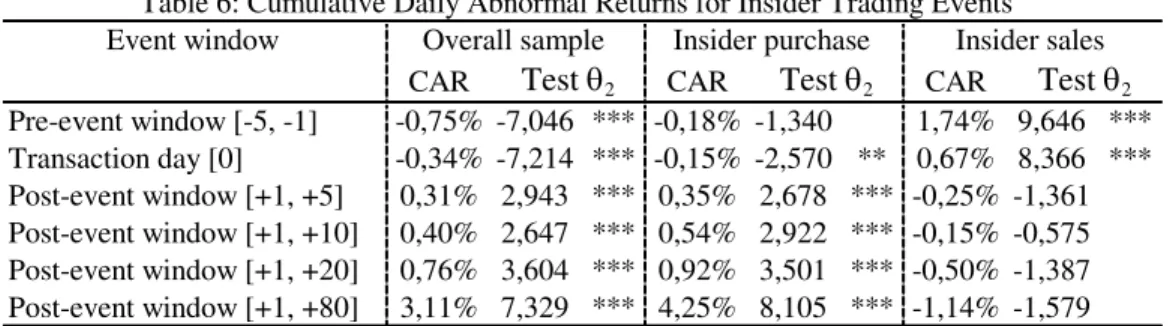
The individual day’s abnormal returns were thereafter added to compute the cumulative abnormal return (CAR), with the results presented in Table 6.
Event window
CAR CAR CAR
Pre-event window [-5, -1] -0,75% -7,046 *** -0,18% -1,340 1,74% 9,646 ***
Transaction day [0] -0,34% -7,214 *** -0,15% -2,570 ** 0,67% 8,366 ***
Post-event window [+1, +5] 0,31% 2,943 *** 0,35% 2,678 *** -0,25% -1,361
Post-event window [+1, +10] 0,40% 2,647 *** 0,54% 2,922 *** -0,15% -0,575
Post-event window [+1, +20] 0,76% 3,604 *** 0,92% 3,501 *** -0,50% -1,387
Post-event window [+1, +80] 3,11% 7,329 *** 4,25% 8,105 *** -1,14% -1,579
Test 2 Test 2 Test 2
The symbols ***, **, and * show two-tail significance at the 1%, 5% and 10% levels, respectively. Table 6: Cumulative Daily Abnormal Returns for Insider Trading Events
Overall sample Insider purchase Insider sales
CAR for pre-event window [-5, -1] confirms that an insider purchases (sales) occur after a
period of low (high) stock price. After the event took place, the overall sample results
(N=1.052) show that prices tend to increase after insider purchases and decrease after
insider sales, for all the four post-event windows analysed. For the aggregated sample, the
and all are statistically significant. The null hypothesis is therefore rejected with a 99%
confidence level.
Breaking up the overall sample between purchases and sales, we found that for the shares
bought (N=667), the patterns and results remain identical to those from the aggregated
sample. Insiders are able to make profits from their purchases, since CAR is significantly
positive within all the event windows analysed. Since the abnormal return lingers for a
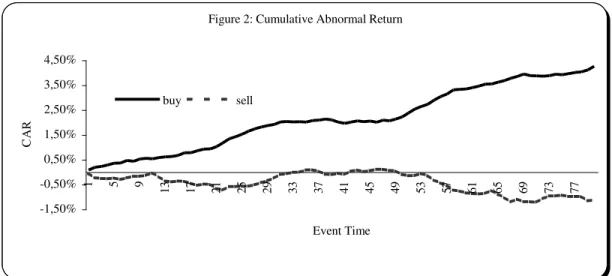
period of at least 80 days (as illustrated in Figure 2), outsiders are capable of making
abnormal profit by following insider purchases. Nevertheless, and according to Portuguese
laws, information regarding insider transactions is only available to the public at the time a
company releases its annual reports. Therefore, although our findings suggest the
possibility of making abnormal profits by mimicking insider purchases, this strategy is not
practicable due to the lack of information immediately after the transactions take place.
Figure 2: Cumulative Abnormal Return
-1,50% -0,50% 0,50% 1,50% 2,50% 3,50% 4,50%
1 5 9 13 17 21 25 29 33 37 41 45 49 53 57 61 65 69 73 77
Event Time
C
AR
buy sell
From the sales sample (N=385), CAR is positive and significant before the insider
transactions happen, which means that insiders wait for a short-run increase in the stock
price to sell shares. After the event day and for all post-event window, although being
always negative, CAR points towards the absence of significant excess return, because the
hypothesis that the variable is null is always accepted. Previous researches suggest insider
elsewhere, to pay off loans, pay off mortgages, etc. Insiders would have little other
incentive to buy unless the thought the stock price would increase in the future.
6.1. Firm and Transaction-Specific Factors
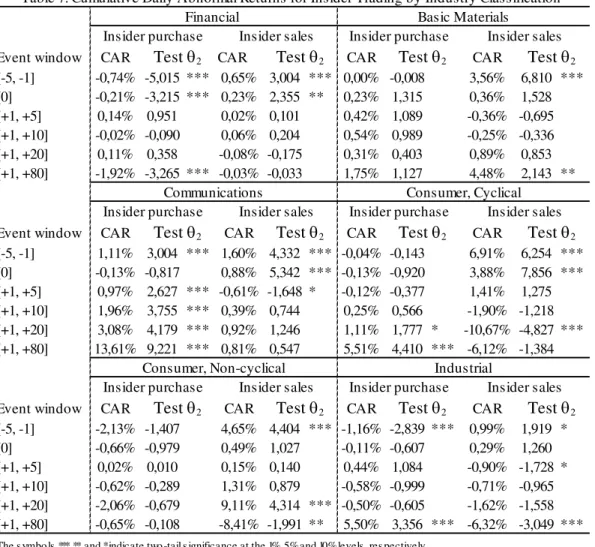
In order to study any industry specific effect, we split the sample into industries. Table 7
presents CAR according to industry classifications for the entire sample.
Event window CAR CAR CAR CAR
[-5, -1] -0,74% -5,015 *** 0,65% 3,004 *** 0,00% -0,008 3,56% 6,810 ***
[0] -0,21% -3,215 *** 0,23% 2,355 ** 0,23% 1,315 0,36% 1,528
[+1, +5] 0,14% 0,951 0,02% 0,101 0,42% 1,089 -0,36% -0,695
[+1, +10] -0,02% -0,090 0,06% 0,204 0,54% 0,989 -0,25% -0,336
[+1, +20] 0,11% 0,358 -0,08% -0,175 0,31% 0,403 0,89% 0,853
[+1, +80] -1,92% -3,265 *** -0,03% -0,033 1,75% 1,127 4,48% 2,143 **
Event window CAR CAR CAR CAR
[-5, -1] 1,11% 3,004 *** 1,60% 4,332 *** -0,04% -0,143 6,91% 6,254 ***
[0] -0,13% -0,817 0,88% 5,342 *** -0,13% -0,920 3,88% 7,856 ***
[+1, +5] 0,97% 2,627 *** -0,61% -1,648 * -0,12% -0,377 1,41% 1,275
[+1, +10] 1,96% 3,755 *** 0,39% 0,744 0,25% 0,566 -1,90% -1,218
[+1, +20] 3,08% 4,179 *** 0,92% 1,246 1,11% 1,777 * -10,67% -4,827 ***
[+1, +80] 13,61% 9,221 *** 0,81% 0,547 5,51% 4,410 *** -6,12% -1,384
Event window CAR CAR CAR CAR
[-5, -1] -2,13% -1,407 4,65% 4,404 *** -1,16% -2,839 *** 0,99% 1,919 *
[0] -0,66% -0,979 0,49% 1,027 -0,11% -0,607 0,29% 1,260
[+1, +5] 0,02% 0,010 0,15% 0,140 0,44% 1,084 -0,90% -1,728 *
[+1, +10] -0,62% -0,289 1,31% 0,879 -0,58% -0,999 -0,71% -0,965
[+1, +20] -2,06% -0,679 9,11% 4,314 *** -0,50% -0,605 -1,62% -1,558
[+1, +80] -0,65% -0,108 -8,41% -1,991 ** 5,50% 3,356 *** -6,32% -3,049 ***
The s ymbo ls ***, **, and * indicate two -tail s ignificance at the 1%, 5% and 10% levels , res pectively.
Test 2 Test 2 Test 2 Test 2
Consumer, Non-cyclical Industrial
Insider purchase Insider sales Insider purchase Insider sales
Test 2 Test 2 Test 2 Test 2
Communications Consumer, Cyclical
Insider purchase Insider sales Insider purchase Insider sales
Test 2 Test 2 Test 2 Test 2
Table 7: Cumulative Daily Abnormal Returns for Insider Trading by Industry Classification
Financial Basic Materials
Insider purchase Insider sales Insider purchase Insider sales
We refrain from analysing diversified, technology and utility industries, since each one had
only one company (as shown in Table 3). The analysis of the six remaining sectors shows
that only insiders from communications industry are able to make significant profits
from the financial sector have the worst performance among the industries analysed. This
contrasts with the conclusion of Baesel and Stein (1979) who found that bank directors
earn larger premiums than ordinary insiders. In terms of sale transactions, insiders of the
consumer (cyclical) and industrial sectors tend to perform much better.
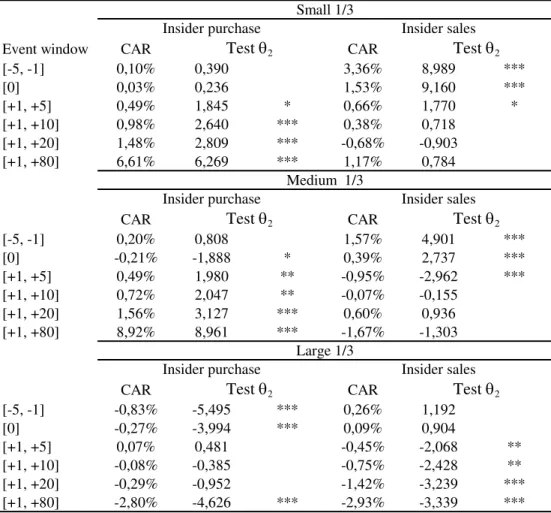
As observed before, Wong (2002) and Seyhun (1998) noticed that insiders’ benefit might
well be a result of some size effect. Having this in mind we started by testing the inside
trades split up by firm size. Table 8 shows the CAR grouped by the firm size.
Event window CAR CAR
[-5, -1] 0,10% 0,390 3,36% 8,989 ***
[0] 0,03% 0,236 1,53% 9,160 ***
[+1, +5] 0,49% 1,845 * 0,66% 1,770 *
[+1, +10] 0,98% 2,640 *** 0,38% 0,718
[+1, +20] 1,48% 2,809 *** -0,68% -0,903
[+1, +80] 6,61% 6,269 *** 1,17% 0,784
CAR CAR
[-5, -1] 0,20% 0,808 1,57% 4,901 ***
[0] -0,21% -1,888 * 0,39% 2,737 ***
[+1, +5] 0,49% 1,980 ** -0,95% -2,962 ***
[+1, +10] 0,72% 2,047 ** -0,07% -0,155
[+1, +20] 1,56% 3,127 *** 0,60% 0,936
[+1, +80] 8,92% 8,961 *** -1,67% -1,303
CAR CAR
[-5, -1] -0,83% -5,495 *** 0,26% 1,192
[0] -0,27% -3,994 *** 0,09% 0,904
[+1, +5] 0,07% 0,481 -0,45% -2,068 **
[+1, +10] -0,08% -0,385 -0,75% -2,428 **
[+1, +20] -0,29% -0,952 -1,42% -3,239 ***
[+1, +80] -2,80% -4,626 *** -2,93% -3,339 ***
Test 2 Test 2
The symbols ***, **, and * indicate two-tail significance at the 1%, 5% and 10% levels, respectively.
Test 2 Test 2
Large 1/3
Insider purchase Insider sales
Test 2 Test 2
Medium 1/3
Insider purchase Insider sales
Table 8: Cumulative Daily Abnormal returns for Insider Trading Events by Firm Size Small 1/3
Insider purchase Insider sales
For insider purchases, only the small and medium capitalisations show significantly
positive post-event CAR. Cheuk et al. (2006) argue that in many cases, especially in small
general, more informed about the business prospects of their own firms, insider trading
which involves the directors of small corporations is likely to be the most profitable.
Relating firm size to insider sales, the results show that only large firms insiders are taking
any abnormal benefit from selling their stocks. The CAR for all the four post-event
windows is negative and statistically significant.
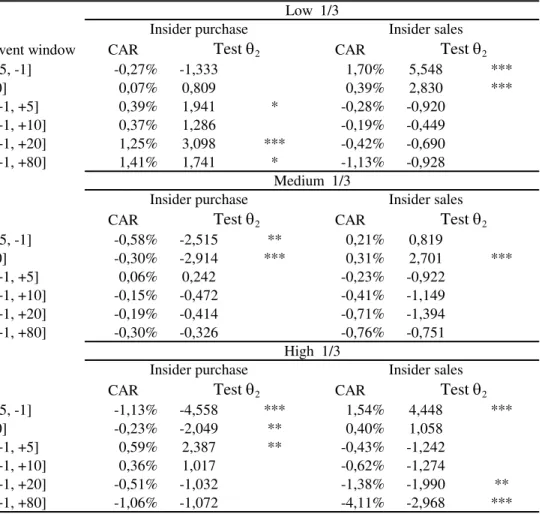
Following the conclusions of Jeng et al. (1999) we wonder whether insider trades are
anyhow related to trade volume. Table 9 shows the CAR grouped by the relative trading
volume of the transactions.
Event window CAR CAR
[-5, -1] -0,17% -0,774 1,18% 4,038 ***
[0] -0,04% -0,430 0,35% 2,702 ***
[+1, +5] 0,17% 0,767 -0,75% -2,549 **
[+1, +10] 0,22% 0,684 -0,73% -1,756 *
[+1, +20] 0,76% 1,689 * -1,53% -2,608 ***
[+1, +80] 4,04% 4,510 *** -3,58% -3,060 ***
CAR CAR
[-5, -1] -0,26% -1,212 2,07% 6,991 ***
[0] -0,14% -1,462 0,83% 6,243 ***
[+1, +5] 0,10% 0,457 -0,05% -0,177
[+1, +10] 1,01% 2,401 ** 0,25% 0,594
[+1, +20] 1,01% 2,401 ** 0,34% 0,581
[+1, +80] 2,56% 3,032 *** 0,43% 0,364
CAR CAR
[-5, -1] -0,10% -0,397 1,96% 5,696 ***
[0] -0,27% -2,481 ** 0,84% 5,470 ***
[+1, +5] 0,78% 3,214 *** 0,07% 0,193
[+1, +10] 1,00% 2,907 *** 0,04% 0,086
[+1, +20] 0,98% 2,008 ** -0,31% -0,450
[+1, +80] 6,13% 6,283 *** -0,25% -0,179
Test 2 Test 2
The symbols ***, **, and * indicate two-tail significance at the 1%, 5% and 10% levels, respectively.
Test 2 Test 2
High 1/3
Insider purchase Insider sales
Test 2 Test 2
Medium 1/3
Insider purchase Insider sales
Table 9: Cumulative Daily Abnormal Returns for Insider Trading Events by Relative Trading Volume
Low 1/3
Insider purchase Insider sales
Purchases in the high relative trading volume group predict better performance for all the
small relative trading volume. This means that larger abnormal profits are achieved when
insiders purchase in larger blocks or when they sell shares in smaller lots. Previously we
showed that insiders in Portuguese market usually sell shares in larger blocks, and now we
found that only shares sold in small lots bring the greatest profits. This result is in line with
findings that insiders may sell shares not to avoid losses through the exploitation of private
information, but to invest the money elsewhere or to supply any consumptions need. Jeng
et al. (1999) also argue that “insiders with sizeable corporate holding may undertake high
volume sales to diversification or liquidity purposes”.
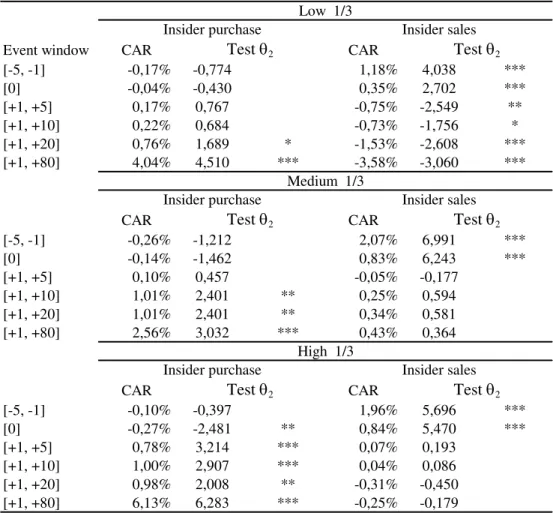
The relationship between the two valuation ratios and abnormal return is examined next.
As noticed before, inside trading benefits may well be related to P/B and P/E ratios (see see
low P/E and sell at periods of high P/B and high P/E. Table 10 shows that stocks bought by
insiders with the lowest P/B perform better than the stocks bought with medium and high
ratio. Contrarily, for stocks sold by insiders, the CAR is significantly negative only for
those shares with the highest P/B. This is consistent with the hypothesis that a high P/B
predicts bad future performance.
A low P/E ratio is also associated with a high future stock return, while high P/E is
associated with a low future stock return. Table 11 illustrates this relationship.
Event window CAR CAR
[-5, -1] -0,27% -1,333 1,70% 5,548 ***
[0] 0,07% 0,809 0,39% 2,830 ***
[+1, +5] 0,39% 1,941 * -0,28% -0,920
[+1, +10] 0,37% 1,286 -0,19% -0,449
[+1, +20] 1,25% 3,098 *** -0,42% -0,690
[+1, +80] 1,41% 1,741 * -1,13% -0,928
CAR CAR
[-5, -1] -0,58% -2,515 ** 0,21% 0,819
[0] -0,30% -2,914 *** 0,31% 2,701 ***
[+1, +5] 0,06% 0,242 -0,23% -0,922
[+1, +10] -0,15% -0,472 -0,41% -1,149
[+1, +20] -0,19% -0,414 -0,71% -1,394
[+1, +80] -0,30% -0,326 -0,76% -0,751
CAR CAR
[-5, -1] -1,13% -4,558 *** 1,54% 4,448 ***
[0] -0,23% -2,049 ** 0,40% 1,058
[+1, +5] 0,59% 2,387 ** -0,43% -1,242
[+1, +10] 0,36% 1,017 -0,62% -1,274
[+1, +20] -0,51% -1,032 -1,38% -1,990 **
[+1, +80] -1,06% -1,072 -4,11% -2,968 ***
Test 2 Test 2
The symbols ***, **, and * indicate two-tail significance at the 1%, 5% and 10% levels, respectively.
Test 2 Test 2
High 1/3
Insider purchase Insider sales
Test 2 Test 2
Medium 1/3
Insider purchase Insider sales
Table 11: Cumulative Daily Abnormal Returns for Insider Trading Events by Price Earnings Ratio
Low 1/3
Insider purchase Insider sales
Therefore, as stated by Cheuk et al. (2006), it is likely that insiders, who are more able to
assess the value of their firms, buy when the P/E of the stock is low, and sell when the P/E
found in the low P/E group. Contrarily, for the sales transactions, post-event CAR is
significantly negative only for the high P/E group. Both results are significant only for [+1,
+20] and [+1, +80] event windows.
Overall, our results confirm that insiders take into account their company valuation before
buying or selling stocks of their own firms.
6.2. Methodology Adjustments
As explained before, we also used two alternative strategies in order to control the results.
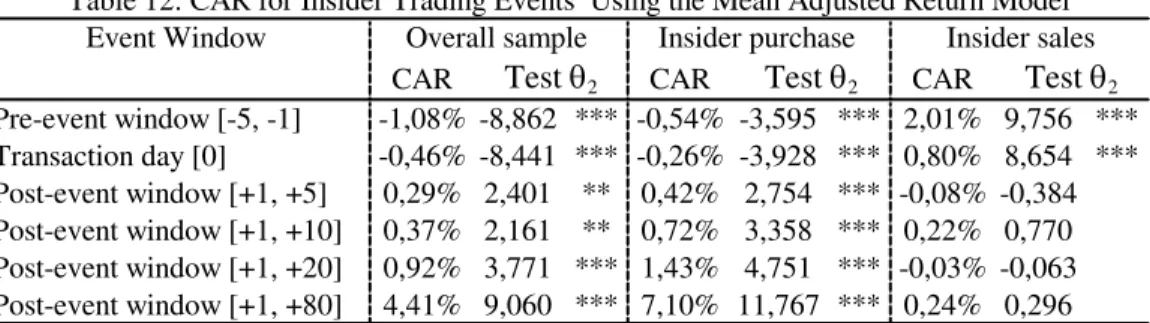
Abnormal returns were also computed using the mean adjusted return (equation 8) and the
market adjusted return (equation 9). For the mean adjusted return, the patterns remain
identical, as shown in Table 12 (which compares with the results from Table 6).
Event Window
CAR CAR CAR
Pre-event window [-5, -1] -1,08% -8,862 *** -0,54% -3,595 *** 2,01% 9,756 ***
Transaction day [0] -0,46% -8,441 *** -0,26% -3,928 *** 0,80% 8,654 ***
Post-event window [+1, +5] 0,29% 2,401 ** 0,42% 2,754 *** -0,08% -0,384
Post-event window [+1, +10] 0,37% 2,161 ** 0,72% 3,358 *** 0,22% 0,770
Post-event window [+1, +20] 0,92% 3,771 *** 1,43% 4,751 *** -0,03% -0,063
Post-event window [+1, +80] 4,41% 9,060 *** 7,10% 11,767 *** 0,24% 0,296
Test 2 Test 2 Test 2
The symbols ***, **, and * indicate two-tail significance at the 1%, 5% and 10% levels, respectively. Table 12: CAR for Insider Trading Events Using the Mean Adjusted Return Model
Overall sample Insider purchase Insider sales
Previously, we have done some sample modifications and adjustments related to
complications arising from violations of the statistical assumptions. These complications
arise when event windows of the included securities overlap in terms of calendar time or
when abnormal return calculation is influenced by the abnormal return of an early event.
These adjustments, however, did not modify our main conclusions and findings.
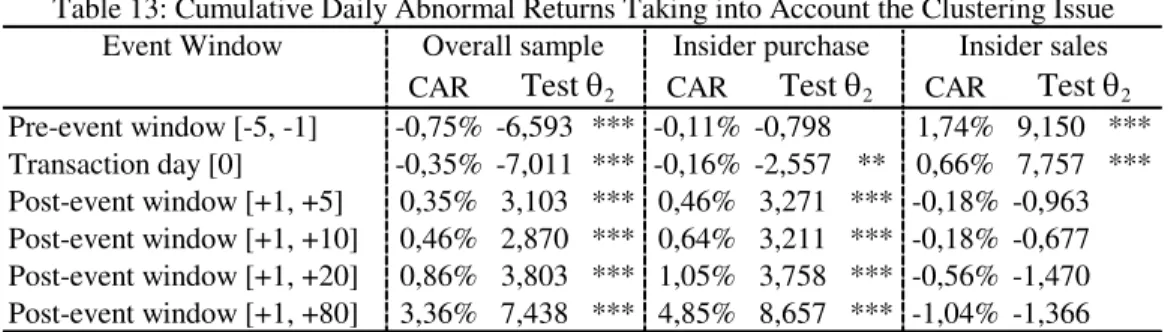
Table 13 reports the results, already taking into account the clustering issue. We have go
Event Window
CAR CAR CAR
Pre-event window [-5, -1] -0,75% -6,593 *** -0,11% -0,798 1,74% 9,150 ***
Transaction day [0] -0,35% -7,011 *** -0,16% -2,557 ** 0,66% 7,757 ***
Post-event window [+1, +5] 0,35% 3,103 *** 0,46% 3,271 *** -0,18% -0,963
Post-event window [+1, +10] 0,46% 2,870 *** 0,64% 3,211 *** -0,18% -0,677
Post-event window [+1, +20] 0,86% 3,803 *** 1,05% 3,758 *** -0,56% -1,470
Post-event window [+1, +80] 3,36% 7,438 *** 4,85% 8,657 *** -1,04% -1,366
Test 2 Test 2 Test 2
The symbols ***, **, and * indicate two-tail significance at the 1%, 5% and 10% levels, respectively. Table 13: Cumulative Daily Abnormal Returns Taking into Account the Clustering Issue
Overall sample Insider purchase Insider sales
Although we have reduced the sample size and chosen a new approach for those
transactions where the clustering was noticeable in the event dates, the results remain
mostly identical, and for the three samples, the statistical significant regions remain
unchanged. Friederich et al. (2000) argue that “although event clustering can affect the
results through cross-sectional correlation of the excess returns, this is not necessarily a
strong limitation when different industries and daily data are used because the probability
of events being clustered decreases under those circumstances”.
This portfolio approach allows us also to achieve a better fitting for the market model
parameters. Using the initial sample (N=1.052), the average value for the coefficient of
determination R2 is 0,20, higher than the estimation found by Duque and Pinto (2004)6. The
authors have used the PSI Geral index to compute the market return parameters, rather than
the PSI-20 index that we use in our research. After the portfolio approach, R2 coefficient
average was slightly improved to 0,22. The average i (0,70 for the 1.052 sample or 0,72
for the 855 sample) differ substantially from 1, but the average beta was computed as a
non-weight average of 28 securities (only 17 belonged to PSI-20 index at the end of the
sample period, although they count for 98% of the benchmark value).
Table 14 reports the results taking into account the clustering issue and the non-overlapping
approach simultaneously.
Event Window
CAR CAR CAR
Pre-event window [-5, -1] -0,71% -4,702 *** -0,21% -1,087 1,37% 5,633 ***
Transaction day [0] -0,74% -10,888 *** -0,46% -5,370 *** 1,10% 10,111 ***
Post-event window [+1, +5] 0,47% 3,143 *** 0,50% 2,601 *** -0,45% -1,838 *
Post-event window [+1, +10] 0,49% 2,286 ** 0,67% 2,484 ** -0,25% -0,730
Post-event window [+1, +20] 0,51% 1,681 * 0,74% 1,942 * -0,20% -0,417
Post-event window [+1, +80] 0,49% 0,807 0,70% 0,921 -0,21% -0,212
Test 2 Test 2 Test 2
The symbols ***, **, and * indicate two-tail significance at the 1%, 5% and 10% levels, respectively. Table 14: CAR Taking into Account the Clustering Issue and a Non-Overlapping Approach
Overall sample Insider purchase Insider sales
The CAR for the significant test for the first three shorter post-event windows and the AR
for the event day remain robust and practically identical. CAR for both [-5, -1] and [+1, +5]
windows, where we have completely eliminated the overlapping, are -0,71% (2 = -4,702)
and 0,47% (2 = 3,143). In the previous sample, CAR for [-5, -1] and [+1, +5] event
windows were -0,75% (2 = -6,593) and 0,35% (2 = 3,103). For longer periods, namely for
the [+1, +80] event window, the test 2 cease from being significant. Larger event windows
could reflect other factors that lead shares to rally or slump that is external and outside the
firm control, and news or events that are unknown by insider at the time the transaction is
executed.
One potential problem that can arise from using both the mean adjusted return and market
model is that the results can be sensitive to the inclusion (or exclusion) of other event
periods into the estimation period. Brown and Warner (1980) argue that if high levels of
abnormal performance are present, then including observations from around the time of the
event gives more weight to apparent “outliers”, tending to increase the variance of the
security-specific performance measures, and lowering the power of the tests. To cope with
this potential problem, we have redone the analysis using the market adjusted return model.
This method allows for abnormal return not to be contaminated by other events taking
place during the estimation period.
Event Window
CAR CAR CAR
Pre-event window [-5, -1] -0,58% -3,548 *** 0,02% 0,097 1,36% 5,246 ***
Transaction day [0] -0,82% -11,226 *** -0,66% -7,087 *** 1,02% 8,836 ***
Post-event window [+1, +5] 0,37% 2,255 ** 0,42% 2,010 ** -0,30% -1,159
Post-event window [+1, +10] 0,25% 1,101 0,49% 1,684 * 0,06% 0,171
Post-event window [+1, +20] 0,28% 0,860 0,73% 1,761 * 0,31% 0,602
Post-event window [+1, +80] -0,51% -0,789 0,72% 0,872 2,13% 2,060 **
Test 2 Test 2 Test 2
The symbols ***, **, and * indicate two-tail significance at the 1%, 5% and 10% levels, respectively. Table 15: Cumulative Daily Abnormal Returns Using the Market Adjusted Return
Overall sample Insider purchase Insider sales
For the aggregate sample, the pattern and significance of the abnormal returns persist until
the [+1, +5] event window, but we loose the effect for the remaining post-event windows.
7. CONCLUSIONS
Although there exist other studies on the subject using similar methodologies and data
treatment, this type of research is particularly sensitive to differences in jurisdiction. As
noticed by Bhattacharya and Daouk’s (2002) and Beny (2005), inside trading legislation
varies widely around the world with different impact on trading activity and information
release. Even within the European Union, that issued the “Directive 2003/6/EC”, the rules
and regulations do not provide a completely uniform set of practices, resulting on a country
dependent effect. This is why the results for the Portuguese market become relevant.
Our overall results show that, although there is legislation to regulate insiders’ transactions
in Portugal, they still seem to be able to make abnormal profits when trading shares of their
own firms. The patterns we found “in abnormal returns are consistent with directors
engaging in short-term market timing: they sell (buy) after an increase (decline) in prices,
and their trades are followed by a partial price reversal”, a result similar to Friederich et al.
(2000). But our results suggest that insider buying is a stronger indicator than insider
selling.
Although our findings suggest the possibility of making abnormal profits by mimicking
insider purchases (since the abnormal return lingers for a period of at least 80 days), this
strategy is not practicable due to the lack of information immediately after the transactions
value. The “Directive 2003/6/EC” of the European Parliament regarding the release of
insider trading information recommends that issuers in member states inform the public of
inside information as soon as possible7. In Portugal, this recommendation has yet to be
enforced.
Our results also suggest that some insiders’ transactions may comprise more information
than others.
For the shares bought, we find that the largest and persistent abnormal returns are found in
purchases that have some common denominators: the firm belongs preferentially to the
communication industry; the firm is small or medium in terms of market capitalization; the
relative trading volume of the purchase is high and the price to book ratio and the price
earnings ratio of the security is small.
For the shares sold, although the results from analysing the entire sample point towards the
absence of significant negative excess returns, there are some firm and transaction-specific
factors that lead abnormal returns to fall within the statistical significant regions. These
sales have some common features: the firm is usually a consumer (cyclical) or an industrial
company; the firm is large in terms of market value; the relative trading volume of the sales
is low and the price to book ratio and the price earnings ratio of the shares sold are
typically high.
8. REFERENCES
Baesel, J. B. and Stein, G. R. (1979), The Value of Information: Inferences from the Profitability of Insider Trading, Journal of Financial and Quantitative Analysis, 14, pp. 553-571.
Beny, L. N. (2005), Do Insider Trading Laws Matter? Some Preliminary Comparative Evidence, Working Paper, The University of Michigan Business School.
Bernard, V. L. (1987), Cross-Sectional Dependence and Problems in Inference in Market- Based Accounting Research, Journal of Accounting Research, 25, pp. 1-48.
Bhattacharya, U., and Daouk, H. (2002), The World Price of Insider Trading, Journal of Finance, 57, pp. 75-108.
Brown, S. and Warner J. (1980), Measuring Security Price Performance, Journal of Financial Economics, 8, pp. 205-258.
Brown, S. and Warner, J. (1985), Using Daily Stock Returns: The Case of Event Studies, Journal of Financial Economics, 14, pp. 3-31.
Calvo, E. and Lasfer, M. (2002), Why do Corporate Insiders Trade? The UK Evidence, Working Paper, Cass Business School.
Campbell, J. Y., Lo, A. and MacKinlay A. C. (1997), The Econometrics of Financial Markets, Princeton: Princeton University Press.
Cheuk, M.-Y., Dennis, K. F. and Raymond, W. (2006), Insider trading in Hong Kong: Some Stylized Facts,
Pacific-Basin Finance Journal, 14, pp. 73-90.
Del Brio, E. B., Miguel, A., Perote, J. (2002), An Investigation of Insider Trading Profits in the Spanish Stock Market, The Quarterly Review of Economics and Finance, 42, pp. 73-94.
Duque, J. and Pinto, I. (2004), How Sensitive are Price Sensitive Events, Working Paper, Departamento de Gestão do ISEG.
Elton, E. J. and Gruber, M. J. (1995), Modern Portfolio Theory and Investment Analysis, New York: John Wiley & Sons.
Friederich, S., Gregory, A., Matatko, J. and Tonks, I. (2000), Stock Price Patterns around Directors’ Trades on the London Stock Exchange, Working Paper, London School of Economics.
Heinkel, R. and Kraus, A. (1987), The Effect of Insider Trading on Average Rates of Return, The Canadian Journal of Economics, 20, pp. 588-611.
Jaffe, J. (1974), Special Information and Insider Trading, Journal of Business, 47, pp. 163-193.
Jeng, L. A., Metrick, A., and Zeckhauser, R. (1999). The Profits to Insider Trading: A Performance-Evaluation Perspective, NBER Working Paper, No. 6913.
Kyle, A.S. (1985), Continous Auctions And Insider Trading, Econometrica, 53, pp. 1315-1335.
MacKinlay, A. C. (1997), Event Studies in Economics and Finance, Journal of Economic Literature, 35, pp. 13-39.
Moss, J. D. and Kohers, T. (1990), Abnormal Gains for Insiders Trading Prior to Unexpected Corporate Earnings and Dividend Announcements, Akron Business and Economic Review, 21, pp. 63-74.
Seyhun, N. (1986), Insiders’ Profits, Costs of Trading and Market Efficiency, Journal of Financial Economics, 16, pp. 189-212.
Seyhun, N. (1988), The Information Content of Aggregate Insider Trading, Journal of Business, 61, pp. 1-23.