Do insiders get abnormal returns?: Event studies on the trades of insiders of the firms with differentiated corporate governance of the São Paulo Stock Exchange
William Eid Junior [email protected]
Ricardo Ratner Rochman [email protected]
Key words
Insider trading, Brazil, Corporate Governance
November 2006
Abstract: The subject insider trading is controversial. This paper presents series of event studies carried through on the trades with stocks of the firm carried by insiders with the objective to detect abnormal returns, based on the access to privileged information. The sample is composed by trades performed by insiders of the companies with stocks negotiated in the São Paulo Stock Exchange, that are classified as firms with differentiated corporate governance. Indication that trades performed by insiders resulted in abnormal returns compared to the statistically significant expected ones, as in the purchases of common shares; or for selling of preferred stocks.
1. Introduction
The use of privileged information for stock trading is subject of great interest by academics and practitioners, mainly in result of frauds and scandals that question the models of corporate governance and incentives as in the case firms like Enron in 2001 (Palepu and Healy, 2003), and of the TV presenter Martha Stewart that was taken the arrest due her stock trades of the firm ImClone in 2001, by means of information received directly from the CEO of the firm Samuel Waksal (Heminway, 2004). With the development of the Brazilian capital market, the inquiries on the use of privileged information also grew as in the case of the Ambev under inquiry of the CVM – the Brazilian Securities Exchange Commission – (Proença, 2005) regarding the trades carried through by the control block shareholders and executive direction of the firm, before the merger of the firm with the Belgian brewery Interbrew in 2004. Many definitions exist of insider, here we will consider insider in relation to the certain firm all the person who have access relative the privileged information to the businesses and situation of the firm. It is understood as privileged information those that can influence in way in the prices of the securities of the firm, affecting the decision of the investors to sell, buy or to keep these securities. Thus being, insider trading is all trades carried through by insider with securities of the firm to achieve a personal advantage. The practice of insider trading is not illicit. In this paper we presented a set of event studies carried through on the trades with stocks of the firm performed by these agents (insiders) with the objective to detect excess returns (abnormal) to the expected ones, due to access to privileged information. The definition of insider in this paper will be the same used by instruction 358 from 2002 of the CVM, that it will be presented later. The work is structured on the following way: section 2 shows the related literature with the subject of insider trading, section 3 presents the Brazilian law on the subject, section 4 describes the sample, section 5 presents the methodology of event studies, section 6 shows the results, section 7 has conclusions and final comments, section 8 lists the references.
2. Related Literature
Beny (2004) argues that there is two main categories of theories that approach the use of privileged information (to insider trading):
Electronic copy available at: http://ssrn.com/abstract=1435295 Electronic copy available at: http://ssrn.com/abstract=1435295
2
• Theories of Market, as of Bhattacharya and Daouk (2002), evaluate the implications of the insider trading in the efficiency and integrity of the market as a whole, and its consequences in the prices and liquidity of the securities. In the same work, Beny (2004) examines empirically the related laws and punishments of insider trading in a sample of 36 countries, amongst them Brazil, and concludes that countries with more severe laws on insider trading possess a bigger dispersion of the stock ownership, the markets has more liquid stocks, and the stock prices are more informative, thus confirming the theories of agency and market.
Some authors, as Georgakopoulos (1993), acts as a lawyer that the prohibition of insider trading reduces the operation costs, while others, as Haddock and Macey (1986) argue that if the trades of insiders harmed the liquidity, the firms would forbid such practice. Fishman and Hagerty (1992) demonstrate that insider trading cause a small number of investors informed in the market, and a different distribution of the information in the market. Coast (2002) analyzes the model of regulation of the trades with privileged information in the Brazilian market, through the analysis of the impact law 7.913 from 1989 on the returns of the trades registered in the CVM in the period of 1989 the 1991. The paper, that was carried through before instruction 358/02 of the CVM, concluded that the corporative investors had not gotten statistically significant excess returns based on the monopoly of the privileged information. Mellone (2003) develops a model on the interaction between insiders and outsiders regarding the determination of the structure of control of a firm, and the spreading of information on investment projects. Medeiros and Matsumoto (2004) had performed an event study to examine the related to stock returns of IPOs for firms listed in the São Paulo Stock Exchange, in the period from 1992 to 2003. The authors had inferred that there is presence of investors with privileged information.
3. Brazilian Law
The information of relevant facts of the firm and the use of privileged information appeared in laws 6.404 and 6.385 from 1976 in the Brazilian market. With the new law 10.303 of the capital markets from 2001, the use of privileged information passed to be considered crime with the following punishment: “… reclusion, of 1 (one) the 5 (five) years, and fine of up to 3 (three) times the sum of the illicit advantage in result of the crime."
Concern with transparency in trades and fairness of rights made CVM to issue the instruction 358 in 2002, that forces the communication of the trades made by the management of the firm that possess or have access to the privileged information, as described in article 11 to follow:
"Art.11, … directors, the members of the board, the audit committee and any advisors are obliged to communicate to the CVM, the firm and, it will be the case, to the stock exchange and the over-the-counter market the trades, the amount, the characteristics of the purchase or selling of securities … the communication will have to contain, at the very least, the following information: I - name and qualification of the trader; II - amount and stock class; III - price and date of the trade … The directors, the members of the board, the audit committee, advisors, and their family members will have to communicate this information."
It must be noticed that instruction 358 of the CVM enforces that family of the management and the board also are obliged to disclose the trades performed with securities of the firm, thus contributing for the increase of the transparency of the firm, and improvement of its corporate governance. The regulating agencies of the Brazilian stock market try to restrain and to punish the use of privileged information by insiders.
4. Sample
The initial sample is composed by firms with stocks negotiated in the São Paulo Stock Exchange, and that they are classified as of differentiated corporate governance according to levels 1, 2, and the new market. The regulation and detailing of the characteristics and requirements of these levels of corporate governance of the São Paulo Stock Exchange can be found in the internet site of the São Paulo Stock Exchange (http://www.bovespa.com.br). The period of analysis starts in 2002 (with the release of instruction 358) until December of 2004. The data on the trades with securities carried through by the members of the board, committees, executives, control block shareholders, and family of all these agents were raised from the monthly forms of trades, as prescribed by article 11 of instruction CVM 358 from 2002. The companies that composed the initial sample, classified according to level of differentiated corporate governance of the São Paulo Stock Exchange, are:
• Level 1: Aracruz, Bradesco, Banco Itaú, Bradespar, Brasil Telecom Participações, Brasil Telecom, Braskem, Pão de Açúcar (CBD), Cemig, Cedro Cachoeira, Hering, Cia. Transmissão Energia Elétrica Paulista, Vale do Rio Doce, Confab, Gerdau, Itausa, Klabin, Mangels, Metalúrgica Gerdau, Perdigão, Randon, Ripasa, Rossi Residencial, Vigor, Sadia, Alpargatas, Suzano Bahia Sul, Unibanco Holding, Unibanco, Votorantim Celulose e Papel (VCP), Weg;
• Level 2: All Logística, Celesc, Gol, Marcopolo, Net, Eletropaulo, Eternit, Suzano Petroquímica;
• New Market: CCR Rodovias, Sabesp, Natura, CPFL Energia, Dasa, Grendene, Porto Seguro, Submarino, Renar Maçãs
3
• Braskem, Eternit, Submarino, Renar Maçãs e Vigor.
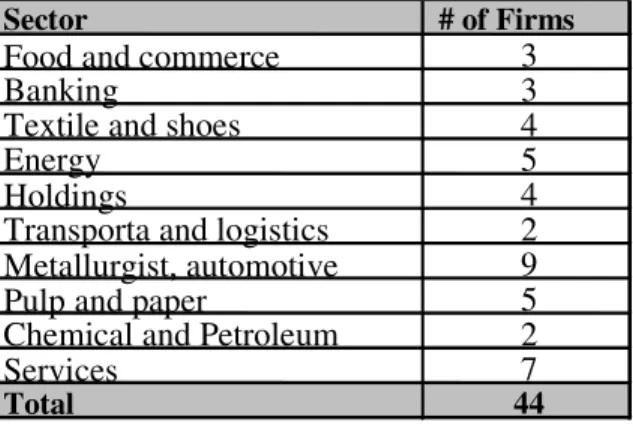
Sectorially the companies in the sample are distributed almost uniformly, with concentration in the sectors of services, metallurgist, and automotive in the following way:
Table 1. Number of companies in the sample by sector
The data base raised for this work has the following data: level of differentiated corporate governance of the firm, name of the firm, insider code, name of the insider, qualification of insider, traded security, type of trade, date of the trade, number of securities, unit price, financial volume, and business sector.
5. Event Studies
The technique of event study has the hypothesis that one determined fact, or event, affects the value of the firm, and that this change in the value is reflected through an abnormal return in the stocks of the firm. In this way, the concept of abnormal return is one of most important in the study of the event. Considering that at each moment the stock price of the firm and the market are influenced by a great variety of factors, we need to choose an appropriated benchmark to control the effect of the facts not related to the event in study. We can define the empirical model of the returns of the stock of the firm, for periods where the event did not occur by the following form:
t i t it
B
R
=
.
β
+
ε
where
mean.
zero
error with
r
i;
stock
of
beta
instance,
for
,
parameters
of
vector
t;
date
on
portfolio
market
the
of
return
the
instance
for
s,
t variable
independen
of
vector
t;
date
on
i
stock
of
r
andom
B
eturn
R
t i t it
=
=
=
=
ε
β
For periods where the event did occur the empirical model of the returns of the stock of the firmis represented by the following way:
t i
t
it
B
FG
R
=
.
β
+
+
ε
where
event. the of ocurrence in the
F of influence the
measuring parameters
of vector
stics; characteri firm
of vector
= =
G F
To capture the change of the empirical models of returns, we use the procedure developed by Campbell, Lo and MacKinlay (1997), that describe the main steps of the process of the study of the impact of the event in the returns of the stock of the firm as: definition of the event, selection of the sample, measurement of the return, empirical test procedure, interpretation of the results and conclusions. In this work we define as event the date of trades of purchase or selling of common or preferred shares of the firm, by insiders of the organization. The period of the sample starts in 2002 until the end of 2004. Inside of the period of the sample and considering the companies with differentiated corporate governance according to the São Paulo Stock Exchange, we find 44 companies in the Brazilian market who are affected by the definition of the event. However, we limit the study to those companies with insiders that have performed the biggest number of trades, and their stocks have liquidity in the period of the sample. Thus the final sample of this work is formed by the 10 following companies, negotiated in the São Paulo Stock Exchange, and its respective common share (ON) or preferred share (PN): Gerdau (ON and PN), Itau Bank Holding (ON and PN), Bradesco Bank (ON and PN), Metalurgica Gerdau (ON and PN), Itaúsa (ON and PN), Healthy (ON and PN), Ccr Highways (ON), Randon (ON and PN), Ripasa (ON), Weg (ON and PN). These 10 firms in the period of the sample had been totalized 5,683 insider trades, which correspond to 81.5% of the total of trades carried through by insiders of the 44 companies with differentiated corporate governance of the São Paulo Stock Exchange. The source of data of
Sector # of Firms
Food and commerce
3
Banking
3
Textile and shoes
4
Energy
5
Holdings
4
Transporta and logistics
2
Metallurgist, automotive
9
Pulp and paper
5
Chemical and Petroleum
2
Services
7
4
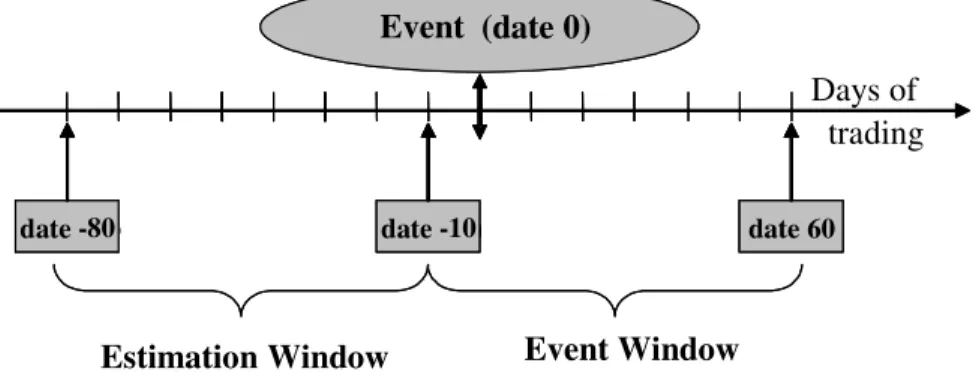
rights distribution and revenues of the firms, facts, mergers, etc.; quotations of closing prices of the common and preferred shares, as well as of the stock indexes Ibovespa and IBrX-100 were the Economatica system. The events of purchases and selling of the stocks by insiders have been extracted on the monthly reports in internet site of the CVM - http://www.cvm.gov.br. In an event study we need to define a period of time, where the data is used to estimate parameters to the chosen models, which we call estimation window. Beyond this, we define a period for test around the event, that we call event window. We adopt an estimation window of 70 daily observations of stock returns. To the event window we adopted a window with 10 previous daily observations, and 60 subsequent daily observations from the event date as illustrated in the figure below:Figure 1. Estimation and event windows.
It is desired to test the significance of the abnormal returns in a window around the date of the event, or to test the null hypothesis that the expected value of the cumulative abnormal returns in the window of the event is equal the zero. First we estimate the abnormal, ex-post returns, that can be obtained through the difference between the observed stock returns of the firm in the window of the event, and the expected stock returns of the firm supplied by a reference model. The models of estimation of the abnormal returns can be divided in two categories: statistical models, that do not depend on economic theories; and economic models. Brown and Warner (1980, 1985) cite the main statistical models of estimation of abnormal returns: models adjusted to the average; models adjusted to the market; e models adjusted to the risk and market. Kloeckner (1995) shows that the three statistical models present similar results in the estimation of the abnormal returns. Campbell, Lo and MacKinlay (1997) present the main financial economic models, that are based on models like the CAPM (Capital Asset Pricing Model) or APT (Arbitrage Pricing Theory). In this work we will estimate the abnormal returns using the model adjusted to the market, and the model adjusted to the risk and the market, that we will call model adjusted to the risk. The Brazilian stock market in this study will be represented by two market indexes: (a) Index of the São Paulo Stock Exchange (Ibovespa); and (b) Index Brazil (IBrX-100), calculated by the São Paulo Stock Exchange, and composed by the 100 most liquid stocks of the market. In the model of returns adjusted to the market, the abnormal returns are estimated by the difference between the stock return and the market return in the same period. Thus, the abnormal stock return of firm "i" in a date "t" is given by:
t. date on return m
t; date on i firm of return stock
t; date on i firm of return stock abnormal where
arket R
R AR
R R AR
mt it
it
mt it it
= =
=
− =
The daily log-returns are obtained through the daily stock closing prices, and calculated as shown below:
( )
(
)
t. date on i firm of price closing stock
; t; date on i firm of return stock where
ln ln
1
= =
−
= −
it it
it it
it
P R
P P
R
The model of returns adjusted to the risk and the market has the assumption that the abnormal returns of the stocks are observed by the difference between the observed individual stock returns, and the returns estimated through a simple factor model. This model is estimated using the data in the estimation window, and a linear regression (ordinary least squares). The abnormal returns are given by:
Days of
Evento
(data 0)
–
compra
ou venda de a
ções
data -
80
data -
10
Event Window
trading
Event (date 0)
data -
80
date -80
data -
date -10
10 date 605
(
)
t. date on return ; regression OLS the of te coefficien angular ; regression OLS the of t coefficien linear t; date on i firm of return tock t; date on i firm of return tock abnormal where market R s R s AR R R AR mt i i it it mt i i it it = = = = = + − =β
α
β
α
The excess returns, or abnormal returns, then are cumulative in the event window, in the cumulative average abnormal return (CAR) in the following way:
date. window final date; window initial sample; in the stocks of number t; date on i firm of return tock abnormal where 1 CAR 2 1 1 2 t t 1 t a t 2 1 2 1 = = = = + − = = = t t N s AR t t N AR it t N i it
To test the average abnormal return we use the following statistics:
= = =
=
=
t t N i i t N i i t N i itN
N
N
AR
1 2 t 1 2 1ˆ
1
AR
ˆ
1
Test
σ
σ
period.
estimation
the
inside
firm
each
of
residuals
the
of
variance
estimated
ˆ
period;
event
in the
t
date
each
for
events
of
number
sample;
in the
stocks
of
number
t;
date
on
return
tock
abnormal
average
t;
date
on
i
firm
of
return
tock
abnormal
where
2=
=
=
=
=
i t t itN
N
s
AR
s
AR
σ
To test the cumulative abnormal the return we use the following statistics:
.
t
to
t
from
period
the
inside
firm
each
of
residuals
the
of
variance
estimated
~
period;
event
in the
t
date
each
for
events
of
number
sample;
in the
stocks
of
number
t;
date
on
return
tock
abnormal
average
return;
abnormal
cumulative
average
where
~
1
CAR
Test
2 1 2 1 2 2 t a
t1 2
=
=
=
=
=
=
= i t t N i i tN
N
s
AR
CAR
N
tσ
σ
6
Analysis Buy ON SellON Buy PN
Sell PN
More than one
trade a day
Directors, board members,
and Advisors
Controllers, Family, and Investment
Clubs
Dates that do not match with rights distributio
n
Dates that do not match with events in
the firm
Exclusion of trades with a period of at least 66
days between each other
1 X X X X
2 X X
3 X X
4 X
5 X
6 X
7 X
8 X X
9 X X
10 X X
11 X X
12 X X
13 X X
14 X X
15 X X
16 X X
17 X X
18 X X
19 X X
20 X X
21 X X
22 X X
23 X X
24 X X
25 X X
26 X X
27 X X
28 X X X
29 X X X
30 X X X
31 X X X
32 X X X X
33 X X X X
34 X X X X
35 X X X X
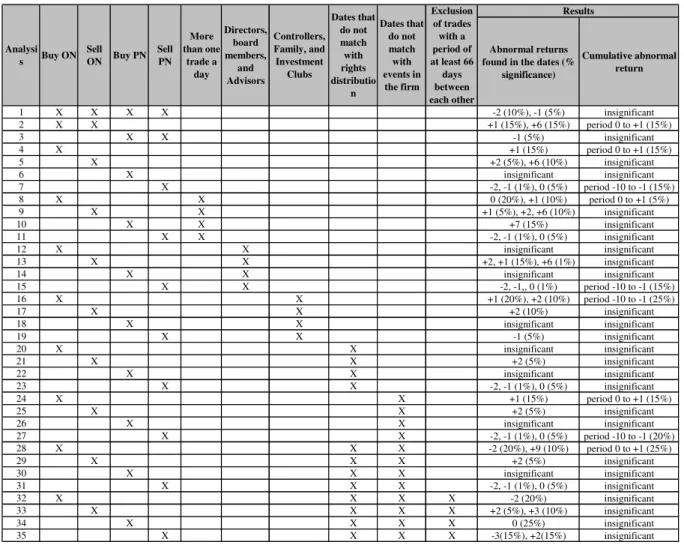
Table 2. Event studies and analysis performed.
Through these tests we try to identify if the event of purchase or selling of stocks by insiders generate excess or abnormal return in the companies of the sample. The analysis 20 to 31 exclude from the sample revenues and rights distribution on the stocks of the firm, or the announcement of relevant facts, shareholders’ meetings, mergers and acquisitions, partnerships, change of management that can affect the results of the event studies of trades of insiders. The analises 32 to 35 exclude from the sample revenues and rights distribution on the stocks of the firm, the announcement of relevant facts, and also the trades that did not have 66 days (approximately 3 months) of distance between each other. This exclusion is necessary to isolate the studied event, and to reduce the impact of events that can confuse ones with the others, as noted by Foster (1980).
6. Results
7
Abnormal returns found in the dates (%
significance)
Cumulative abnormal return
1 X X X X -2 (10%), -1 (5%) insignificant
2 X X +1 (15%), +6 (15%) period 0 to +1 (15%)
3 X X -1 (5%) insignificant
4 X +1 (15%) period 0 to +1 (15%)
5 X +2 (5%), +6 (10%) insignificant
6 X insignificant insignificant
7 X -2, -1 (1%), 0 (5%) period -10 to -1 (15%)
8 X X 0 (20%), +1 (10%) period 0 to +1 (5%)
9 X X +1 (5%), +2, +6 (10%) insignificant
10 X X +7 (15%) insignificant
11 X X -2, -1 (1%), 0 (5%) insignificant
12 X X insignificant insignificant
13 X X +2, +1 (15%), +6 (1%) insignificant
14 X X insignificant insignificant
15 X X -2, -1,, 0 (1%) period -10 to -1 (15%)
16 X X +1 (20%), +2 (10%) period -10 to -1 (25%)
17 X X +2 (10%) insignificant
18 X X insignificant insignificant
19 X X -1 (5%) insignificant
20 X X insignificant insignificant
21 X X +2 (5%) insignificant
22 X X insignificant insignificant
23 X X -2, -1 (1%), 0 (5%) insignificant
24 X X +1 (15%) period 0 to +1 (15%)
25 X X +2 (5%) insignificant
26 X X insignificant insignificant
27 X X -2, -1 (1%), 0 (5%) period -10 to -1 (20%)
28 X X X -2 (20%), +9 (10%) period 0 to +1 (25%)
29 X X X +2 (5%) insignificant
30 X X X insignificant insignificant
31 X X X -2, -1 (1%), 0 (5%) insignificant
32 X X X X -2 (20%) insignificant
33 X X X X +2 (5%), +3 (10%) insignificant
34 X X X X 0 (25%) insignificant
35 X X X X -3(15%), +2(15%) insignificant
Buy PN Sell ON Buy ON Analysi
s
Controllers, Family, and Investment
Clubs Directors,
board members,
and Advisors More than one
trade a day Sell PN
Results Exclusion
of trades with a period of at least 66
days between each other Dates that
do not match with events in
the firm Dates that
do not match with rights distributio
n
Table 3. Summary of the event studies results.
9
Date related to the rights and revenues
distribution
Daily average of purchase trades of
stock
Daily average of selling trades of
stock
-22 5,56 3,50
-21 4,11 2,22
-20 4,67 2,06
-19 3,06 0,72
-18 4,61 1,44
-17 3,89 3,94
-16 3,61 2,72
-15 1,89 1,78
-14 4,61 1,50
-13 4,44 1,50
-12 4,72 3,33
-11 2,94 2,17
-10 1,56 4,06
-9 2,56 4,11
-8 2,78 0,94
-7 3,33 2,56
-6 3,39 2,44
-5 2,72 3,50
-4 2,78 1,28
-3 5,17 1,22
-2 3,56 0,44
-1 2,44 0,56
0 3,94 1,33
1 8,61 1,44
2 5,39 3,61
3 4,44 4,89
4 3,28 2,56
5 2,39 5,00
6 3,78 1,22
7 5,33 1,56
8 4,28 5,11
9 3,94 5,67
10 3,33 7,22
11 2,06 4,83
12 2,00 2,22
13 2,50 5,50
14 2,56 3,22
15 3,67 2,50
16 3,94 2,28
17 3,50 2,56
18 2,72 3,33
19 3,00 1,33
20 5,56 0,67
21 4,94 2,28
22 6,22 2,78
Average 3,77 2,69
Standard Deviation 1,33 1,56
Highest daily average 8,61 7,22
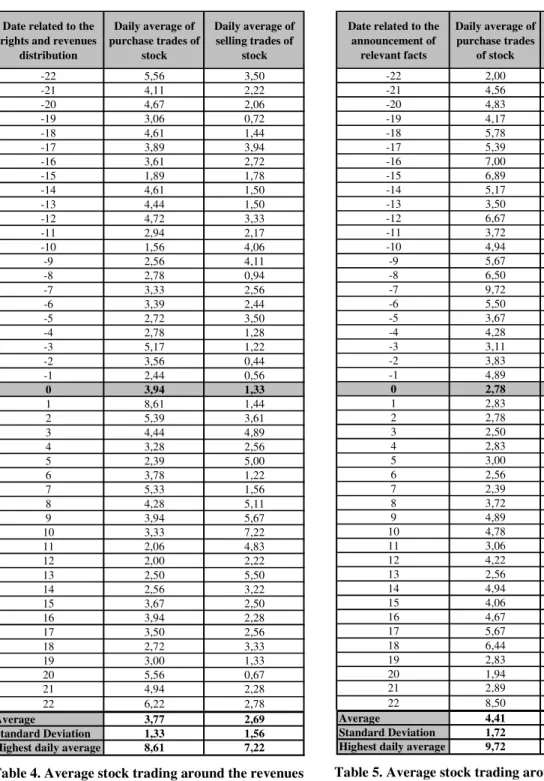
Table 4. Average stock trading around the revenues or rights distribution
Date related to the announcement of
relevant facts
Daily average of purchase trades
of stock
Daily average of selling trades of
stock
-22 2,00 2,72
-21 4,56 3,17
-20 4,83 2,44
-19 4,17 5,00
-18 5,78 4,50
-17 5,39 5,22
-16 7,00 8,06
-15 6,89 3,00
-14 5,17 2,11
-13 3,50 2,89
-12 6,67 3,17
-11 3,72 1,22
-10 4,94 1,11
-9 5,67 0,72
-8 6,50 1,39
-7 9,72 2,89
-6 5,50 0,94
-5 3,67 0,94
-4 4,28 3,89
-3 3,11 2,28
-2 3,83 0,67
-1 4,89 2,17
0 2,78 5,56
1 2,83 2,33
2 2,78 4,44
3 2,50 2,61
4 2,83 2,50
5 3,00 0,94
6 2,56 2,11
7 2,39 3,89
8 3,72 4,67
9 4,89 2,61
10 4,78 3,56
11 3,06 2,39
12 4,22 4,11
13 2,56 2,72
14 4,94 4,06
15 4,06 4,28
16 4,67 3,50
17 5,67 3,44
18 6,44 2,22
19 2,83 1,83
20 1,94 1,67
21 2,89 2,11
22 8,50 1,94
Average 4,41 2,89
Standard Deviation 1,72 1,48
Highest daily average 9,72 8,06
Table 5. Average stock trading around the date of relevant fact announcements
10
Daily average of purchase trades of
stock
Daily average of selling trades of
stock
Daily average of purchase trades of
stock
Daily average of selling trades of stock Daily average of
purchase trades of stock
average of purchases greater than selling
(t=3,53)
average of facts greater than the distribution (t=1,97)
average of distribution greater than the facts
(t=2,97)
Daily average of selling trades of stock
average of purchases greater than selling
(t=3,53)
average of facts greater than the distribution (t=4,97)
averages not significantly differents
(t=0,61)
Daily average of purchase trades of
stock
average of facts greater than the distribution (t=1,97)
average of facts greater than the distribution (t=4,97)
average of purchases greater than selling
(t=4,49)
Daily average of selling trades of stock
average of distribution greater
than the facts (t=2,97)
averages not significantly differents (t=0,61)
average of purchases greater than selling
(t=4,49)
Date related to the rights and revenues distribution
Date related to the announcement of relevant facts
Date related to the rights and
revenues distribution
Date related to the announcement of
relevant facts
Comparison of daily averages of stock trades (t-estatística)
Table 6. Comparison of the daily average trades performed around the rights distribution and news announcements
Pratt and DeVere (1970), Nunn et al. (1983), and Rozeff and Zaman (1988) conclude that the trades of purchases of insiders possess greater informational content than of that of selling. While the research of Lin and Howe (1990), Eckbo and Smith (1998), and Bel Brio et al. (2001) arrive at contrary results. In this paper we see that the purchases of common shares of insiders related the controllers possess more informational content, as well as the trades of selling of preferred stocks of the executives of the firm.
7. Conclusion
The subject to insider trading is very controversial and it is present nowadays with cases as of the Ambev and the Martha Stewart in 2004. This paper presents a series of event studies on the trades performed by insiders of the firms with stocks negotiated in the São Paulo Stock Exchange, that are classified as of differentiated corporate governance. The data presented here show that insiders, as defined by the instruction CVM 358 from 2002, are active agents in the Brazilian stock market. The profile of the trades with securities made by the insiders infers that the directors sell more securities than purchase, in contrast with the controllers and board members; that insiders of the companies that belong to the of level 1 of differentiated corporate governance, that have less governance requirements and restrictions, are more active in trades in the market than firms in higher levels of differentiated corporate governance. We also show that the trades of purchase of common shares, and of selling of preferred stocks, carried through by insiders have presented significant average abnormal return, thus providing indication that the trades may have used privileged information. That is seen by the significant average abnormal return in the first day following the dates of the trades of purchases of common shares by the Controllers, Family, and Investments Clubs; or for selling of preferred stocks by the Directors, board members, and Advisors that had significant average abnormal return in the 10 previous days of the trades. As consequence of these results we can refute the strong hypothesis of market efficiency.
8. Bibliography
BENY, L.N. A comparative empirical investigation of agency and market theories of insider trading. John M. Olin Center form Law & Economics, Research Paper, n.04-004, feb. 2004. . Disponível em <http://ssrn.com/abstract=193070>. Acesso em: 05 dez. 2004.
BHATTACHARYA, U.; DAOUK, H. The World Price of Insider Trading. Journal of Finance, v.57, n.1, p.75-108, 2002.
BROWN, S.; WARNER, J. Using Daily Stock Returns: The case of Event Studies, Journal of Financial Economics, v. 4, p.3-31, 1985.
CAMPBELL, J.; LO, A W.; MACKINLAY, A. The Econometrics of Financial Markets. New Jersey: Princeton University Press, 1997.
11
DEL BRIO, E.B.; MIGUEL, A.; PEROTE, J. Insider trading in the spanish stock market. EFMA 2001 LuganoMeetings. http://ssrn.com/abstract=267011, 2001.
ECKBO, B.; SMITH, D.C. The conditional performance of insider trades. Journal of Finance, v.53, n.2, p.467-498, 1998.FISHMAN, M.; HAGERTY, K. Insider Trading and the Efficiency of Stock Prices. Rand Journal of Economics, v.23, p.106, 1992.
FOSTER, G. Accounting Policy Decisions and Capital Market Research. Journal of Accounting and Economics, v.2, p.29-62, 1980.
GEORGAKOPOULOS, N. Insider Trading as a Transactional Cost: A Market Microstructure Justification and Optimization of Insider Trading Regulation, v.26, n.1, 1993.
HADDOCK, D.; MACEY, J. A Coasian Model of Insider Trading. Northwestern University Law Review, v. 80, p.1449, 1986.
HEMINWAY, J.M. Save Martha Stewart? Observations about equal justice in U.S. insider trading regulation. Texas Journal of Women and the Law, v. 12, p.247-285, 2003. Disponível em <http://ssrn.com/abstract=489005>. Acesso em: 10 dez. 2004.
Instrução 31 de 1984 da CVM. Disponível em
<http://www.cvm.gov.br/asp/cvmwww/atos/exiato.asp?Tipo=I&File=\inst\inst031.htm>. Acesso em: 08 jan. 2004.
Instrução 358 de 2002 da CVM. Disponível em
<http://www.cvm.gov.br/asp/cvmwww/atos/exiato.asp?Tipo=I&File=\inst\inst358.htm#consolid>. Acesso em: 08 jan. 2004.
JENSEN, M.C.; MECKLING, W.H. Theory of the Firm: Managerial Behavior, Agency Costs and Ownership Structure. Journal of Financial Economics, v.3, p.305-360, 1976.
KLOECKNER, G. Estudos de Evento: A análise de um método, Revista Brasileira de Administração Contemporânea. v.1, n.2, set., p.261-270, 1995.
LIN, J.; HOWE, J.S. Insider trading in the OTC market. Journal of Finance, v.55, n.4, p.1273-1284, 1990. MANNE, G. Insider Trading and the Stock Market. New York: The Free Press, 1966.
MEDEIROS, O.R. de; MATSUMOTO, A.S. Emissões públicas de ações, volatilidade e insider information na Bovespa. In: ASSOCIAÇÃO NACIONAL DE PROGRAMAS DE PÓS-GRADUAÇÃO EM ADMINISTRAÇÃO, 2004. Anais eletrônicos...Curitiba: ANPAD, 2004, 1 CD-ROM.
MELLONE JR., G. Interação entre insiders e outsiders e a determinação da estrutura de controle. In: ASSOCIAÇÃO NACIONAL DE PROGRAMAS DE PÓS-GRADUAÇÃO EM ADMINISTRAÇÃO, 2003. Anais eletrônicos...Atibaia: ANPAD, 2003, 1 CD-ROM.
NUNN, K.; MADDEN, G; GOMBOLA, M. Are some insiders more ”inside” than others? Journal of Portfolio Management, v.9, p.18-22, 1983.
Níveis de Governance da Bovespa. Disponível em <http://www.bovespa.com.br>. Acesso em: 02 mar. 2005.
PALEPU, K.; HEALY, P.M. The Fall of Enron. Journal of Economic Perspectives, v.17, n.2, spring 2003. Disponível em <http://ssrn.com/abstract=417840>. Acesso em: 10 dez. 2004.
PRATT, S.P.; DeVERE, C.W. Relationship between insider trading and rates of return for NYSE common stocks, 1960-1966. in LORIE, J.H.; BREALEY, R. ed. Modern Developments in Investment Management. New York: Praeger Publishers, 1970.
PROENÇA, J.M.M. Insider Trading – Regime Jurídico do Uso de Informações Privilegiadas no Mercado de Capitais. São Paulo: Editora Quartier Latin, 2005.