Sensitivity and specifi city of the body mass
index for the diagnosis of overweight/
obesity in elderly
Sensibilidade e especifi cidade do índice de massa
corporal no diagnóstico de sobrepeso/
obesidade em idosos
1 Departamento de Nutrição, Universidade Federal de Santa Catarina, Florianópolis, Brasil. 2 Curso de Nutrição, Universidade Estácio de Sá, Florianópolis, Brasil. 3 Programa de Pós-graduação em Nutrição,Universidade Federal de Santa Catarina, Florianópolis, Brasil. 4 Departamento de Educação Física, Universidade Estadual de Ponta Grossa, Ponta Grossa, Brasil.
5 Programa de Pós-graduação em Educação Física, Universidade Federal de Santa Catarina, Florianópolis, Brasil.
Correspondence F. A. G. Vasconcelos Departamento de Nutrição, Universidade Federal de Santa Catarina. Rua Cap. Romualdo de Barros 997, bloco B1 203, Florianópolis, SC 88040-600, Brasil. fguedes@floripa.com.br
Francisco de Assis Guedes de Vasconcelos 1 Braian Alves Cordeiro 2,3
Cassiano Ricardo Rech 4 Edio Luiz Petroski 5
Abstract
The aim of this article was to verify the sensitiv-ity and specificsensitiv-ity of the body mass index (BMI) cut-off points proposed by the World Health Or-ganization (WHO) and the Nutrition Screening Initiative (NSI) for the diagnosis of obesity in the elderly. A cross-sectional study was made with 180 healthy elderly subjects from Florianópolis, Santa Catarina State, Brazil. Body fat percentage (%BF) was determined using DEXA (dual energy X-ray absorptiometry). The BMI cut-off point of the NSI offers better sensitivity and specificity for men (73.7% and 72.5% respectively). For women, the lower the cut-off point the better the sensitiv-ity, with a BMI of 25kg/m2 (sensitivity of 76.3% and specificity of 100%) being the most accurate for diagnosing obesity in elderly women. The WHO cut-off point offered very low sensitivity (28.9%). The results of this investigation lead to the conclusion that the cut-off points proposed by the WHO and the ones adopted by the NSI and by Lipschitz are not good indicators of obesity for the elderly of either sex, since they offer low sen-sitivity.
Body Mass Index; Sensitivity and Specificity; Overweight; Obesity; Aged
Introduction
The aging process causes nutritional, morpho-logical and physiomorpho-logical modifications, such as reductions in height and body weight, reduction of fat-free mass and increase in fat mass 1,2,3.
The increase in fat mass, particularly in the trunk region, occurs especially after the age of 45. It is related to the redistribution of fat mass, with a reduction of fat in the limbs being followed by an increase in trunk fat, due to hormonal factors 4,5.
The aging process also affects men differently to women. Men have a smaller absolute loss of muscle mass when compared with elderly wom-en. Elderly women, on the other hand, exhibit an increase in fat mass and a reduction in bone mass 6,7.
Excessive fat mass may be defined as obesity, a chronic disease directly or indirectly related to other pathological situations which contribute to morbidity and mortality, such as cardiovascular, bone-muscular and neoplastic diseases 8.
Nevertheless, the methods available for diag-nosing obesity in the elderly are still not specific, considering the modifications in body composi-tion which occur during the aging process. The most widely used method is the one proposed by the World Health Organization (WHO) 8 based on
when having a BMI equal to or above 30kg/m2, regardless of age or sex. It is worth emphasizing that these cut-off points for BMI were originally established based on the risk of developing asso-ciated morbidities or chronic diseases such as hy-pertension, high blood cholesterol, type 2 diabe-tes, coronary heart disease, and other diseases 8.
In the 1990s, another classification based on BMI was proposed for the diagnosis of obesity, adapted to the elderly population. This classifi-cation is used by the Nutrition Screening Initia-tive (NSI) 9 and adopted by Lipschitz 10, in which seniors with a BMI above 27kg/m2 are classified as overweight, while those with a BMI below 22kg/m2 are classified as thin. Lipschitz 10 says
that the use of these values from the lesser mor-tality of the elderly in this BMI range, however, does not refer to changes of aging.
Some limitations, however, have been iden-tified when using these diagnostic procedures with the elderly population, including studies conducted in Brazil 11,12,13. Lohman 14 points out that BMI can be influenced by muscle mass, or-gans, bone structure and fat mass. Therefore, an individual with great quantities of fat free mass could exhibit the BMI of an obese person, but not have excessive fat mass. Similarly, an individual with small bone structure or reduced muscular mass, but with a great quantity of fat mass, could be misclassified as normal (eutrofic) when actu-ally overweight 14.
Therefore, when the distinct changes to the body that occur in aging are taken into consid-eration, it is possible that two people with the same BMI may actually have different percentage fat mass 15. This is why BMI should be specific for age groups and differentiated among popula-tions and ethnic groups 16.
On the other hand, Lohman 14 states that the
cut-off points for the diagnosis of obesity based on percentage body fat for adult population, which places an individual at risk is above 25% of body fat for men and 32% for women.
Considering the changes in body composi-tion during aging and the importance of an accu-rate diagnosis of obesity in the elderly, the objec-tive of this study was to verify the sensitivity and specificity of the BMI cut-off points proposed by WHO 8 and NSI 9 for diagnosing obesity in the elderly.
Materials and methods
This was a cross-sectional study. The sample was composed of 180 elderly subjects (60 men and 120 women), considered healthy or without evidence of serious chronic diseases, all of them
living in the municipality of Florianópolis in the State of Santa Catarina, Southern Brazil, in 2005. Details about the development and design of the study have been described elsewhere 17,18. Briefly, the subjects were selected by invitation among participants of four elderly leisure groups. These groups were selected among people living close to the places where the measurements were carried out, thus avoiding major discomfort for the subjects.
A total of 266 elderly subjects (115 men and 151 women) were contacted by telephone and interviewed. 86 subjects (57 men and 29 women) did not fulfill the criteria for inclusion in the sam-ple since they presented symptoms of high blood pressure, had some type of cancer, amputation and pacemaker, were younger than 60 years, were taking diuretics, had a fixed prosthesis or were not interested in participating in the study. During the telephone contact, the subjects also responded to a questionnaire regarding demo-graphic and socioeconomic data and the dates for the anthropometric, dietetic, bioelectrical im-pedance and dual energy X-ray absorptiometry (DEXA) measurements were also scheduled 17,18.
Research was conducted according to the ethical principles regarding an individual’s au-tonomy, as per Resolution nº. 196/96 of the Na-tional Health Council. The project was approved by the Human Research Ethics Committee at the Federal University of Santa Catarina (UFSC), un-der protocol nº. 063/05.
Anthropometric measures (weight and height) were taken during the morning (between 8 and 10am), at the Physical Effort Laboratory, part of the UFSC Sports Center. All data were col-lected by one person, (with error of measurement of between 0.24% and 2.62% 19), who had been given appropriate training in the techniques and standards employed 20. The BMI [weight (kg)/ height (m2)] was classified by using two criteria: (1) the WHO cut-off points 8, considering pre-obese those subjects with BMI above 25kg/m2
and below 30kg/m2; and obese those with BMI above 30 kg/m2; (2) the cut-off point adapted for the elderly and used by the NSI 9, whereby over-weight individuals were considered to be those with a BMI above 27kg/m2.
the body. Each examination took around 10-15 minutes. The equipment was calibrated daily, ac-cording to the manufacturer’s instructions. Eval-uations were conducted by a technician in medi-cal radiology, at the Diagnostic Imaging Center (SONITEC), in the city of Florianópolis, during the afternoon, between 4pm and 6.30pm.
Both anthropometric and DEXA data were collected in two different hours on the same day, due to the distance between the places for data collection and the schedules offered by the clinic. This does not generate a bias, since there is no comparison between different methods of body fat percentage and there is no significant change in body composition in a few hours.
Data were analyzed using the SPSS, version 11.5 (SPSS Inc., Chicago, USA), adopting a level of significance of p < 0.05.
Student’s t test for independent variables was used to compare age, weight, height, BMI and percentage of body fat between men and women and between obese and non-obese groups.
The sensitivity and specificity of the differ-ent cut-off points for obesity diagnosis using BMI were estimated. These tests are described as methods that are theoretically capable of indicat-ing the presence or absence of a given disease, with a certain chance of error. The probability of a diagnostic test producing a positive result, when the individual does indeed have a given disease, is called test sensitivity; and the prob-ability of the test producing a negative result, when the individual does not have the disease, is called specificity 21.
In order to estimate sensitivity and specific-ity, it was necessary to create tables of crossed tabulation comparing the different cut-off points to reference values, based on percentage of body fat. For this procedure the percentage of body fat obtained by DEXA was adopted as gold standard for the diagnosis of obesity, according to various investigations made with the elderly population
1,6,15,22,23. The values proposed by Lohman 14 for
adult population, of 25% of body fat for men and 32% of body fat for women, was adopted as refer-ence cut-offs.
To determine the most adequate BMI cut-off points for the diagnosis of obesity in the elderly, a statistic procedure known as ROC (receiver oper-ating characteristic) curve was employed. In this procedure, the area under the curve (AUC) can be used to quantify how well a predictor discrimi-nates between individuals with and without a disease 24, with the disease in this case being obe-sity. The AUC was then calculated to determine the most sensitive and specific cut-off points for obesity in the population studied.
Results
Table 1 lists the physical characteristics of the elderly subjects in the form of descriptive statis-tics. The sample consisted of 180 healthy elderly subjects (60 men and 120 women) ranging in age from 60 to 81 years. Men had greater mean age, weight and height. The men and women had similar BMI values, but the difference between them was significant (p < 0.05). Women had high-er phigh-ercentages of body fat and had lowhigh-er fat free mass than men, suggesting that sex can be an important variable in determining obesity cut-off points.
Table 1
Descriptive values (means and standard deviations – SD) of the physical characteristics of the elderly people investigated, by sex. Florianópolis, Santa Catarina State, Brazil, 2005.
Variables Men (n = 60) Women (n = 120)
Mean ± SD Mean ± SD
Age (years) * 69.14 ± 5.6 67.2 ± 5.2 Weight (kg) * 74.3 ± 10.7 65.7 ± 11.1 Height (cm) * 167.2 ± 7.4 154.5 ± 5.7 BMI (kg/m2) * 26.5 ± 2.8 27.4 ± 3.9
Fat free mass [DEXA] (kg) * 54.9 ± 6.8 38.9 ± 4.5 Percentage of body fat [DEXA] * 23.02 ± 5.8 37.3 ± 6.9
BMI: body mass index; DEXA: dual energy X-ray absorptiometry.
* Signifi cant difference between sexes (p < 0.05), Student’s t test for independent variables.
According to a previous article 17, an inter-esting socioeconomic demographic character-istic was that 60% (n = 108) of the subjects were between 60 and 70 years of age, characterizing the sample as a young elderly population. Re-garding marital status, 88.3% (n = 53) of men and 65% (n = 78) of women were married. The educational level was considered to be above national standards: 42.8% of the elderly subjects had completed middle school or completed high school, and 57.2% had completed elementary school (until 8th grade). Most elderly subjects (84.3%) performed some type of physical activ-ity (more than twice a week). Men were found to be less active than women (p < 0.05, χ2 = 2.35). The main activities reported by subjects prac-ticing physical exercise were walking, localized gymnastics, working out, water gymnastics and dancing.
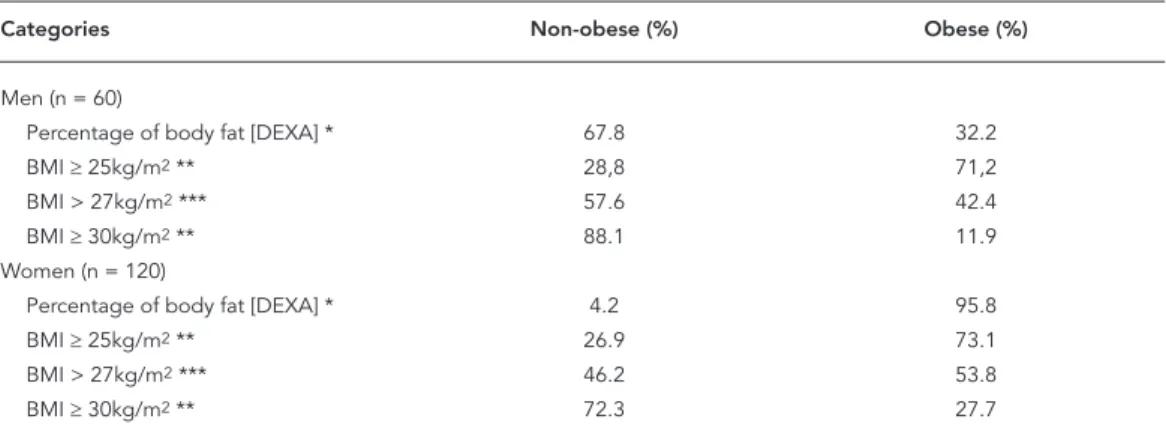
body fat. When determined by percentage of body fat measured by DEXA, 32.2% of the men were obese, against 95.8% of the women. When the WHO 8 cut-off point (BMI ≥ 30kg/m2) was
used, 11.9% of the men and 27.7% of the women were considered obese. A total of 42.4% of the men were classified as obese when the NSI 9 cut-off point (BMI > 27kg/m2) was used; for women,
this percentage was 53.8%. This shows that the prevalence of obesity was higher with the lower BMI cut-off points.
When different BMI cut-off points proposed by WHO 8 for diagnosing obesity were used, there was a difference between sexes only for those elderly with BMI less than 25kg/m2. When percentage of body fat was compared between sexes, the difference was not significant for any BMI category, but when mean of percentage of body fat values were compared in different cat-egories for the same sex, a significant difference was detected (p < 0.001). For the women, con-sidering percentage of body fat by BMI catego-ries, even those women whose BMI was between 25kg/m2 and 30kg/m2 had mean percentage of
body fat above 32%, classified as obesity for this sex. In contrast, only those men whose BMI was above 30kg/m2 were classified as obese by their percentage of body fat (data not shown).
Table 3 presents the sensitivity and specific-ity values for BMI cut-off points, according to fat mass measurement (DEXA) in elderly sub-jects of both sexes. For the men, the BMI values used by NSI 9 and by Lipschitz 10 offered better sensitivity and specificity and can be considered
the most accurate. The BMI value of 25kg/m2
offers high sensitivity (94.7%), but low specific-ity (40%), which translates into an increase in the amount of false-positives, that is, a higher prevalence of individuals wrongly diagnosed with obesity. A BMI of 30kg/m2 had low sensitiv-ity (31.6%), but high specificsensitiv-ity (97.5%), which translates into a high number of false-negatives, that is, a higher prevalence of individuals be-ing misdiagnosed as normal (eutrofic) when in fact they are obese. With women, the lower the cut-off point, the better the sensitivity, bearing in mind that specificity did not change. In this case, a BMI of 25kg/m2 would be more accurate for diagnosing obesity in elderly women when compared to other values, exactly because it is the lowest value. The cut-off point for BMI of 30kg/m2 proposed by WHO 8 had very low sensi-tivity (28.9%), causing a great number of people to be diagnosed as normal when they had exces-sive fat mass, or were obese, according to the DEXA gold standard.
The ROC curve is presented in Figures 1 and 2, as well as the corresponding AUC values.
In this study, the value of BMI with better sen-sitivity and specificity for men was 27.58kg/m2. This cut-off point provides a sensitivity of 73.7 (95% confidence interval – 95%CI: 48.8-90.8) and a specificity of 85.0 (95%CI: 70.2-94.3). The value of BMI with better sensitivity and specificity for women was 22.89kg/m2. This cut-off point pro-vides a sensitivity of 88.6 (95%CI: 81.3-93.8) and a specificity of 100.0 (95%CI: 48.0-100.0) (data not shown).
Table 2
Prevalence of obese and non-obese elderly people in the sample according to percentage of body fat and different body mass index (BMI) cut-off points, by sex. Florianópolis, Santa Catarina State, Brazil, 2005.
Categories Non-obese (%) Obese (%)
Men (n = 60)
Percentage of body fat [DEXA] * 67.8 32.2
BMI ≥ 25kg/m2 ** 28,8 71,2
BMI > 27kg/m2 *** 57.6 42.4
BMI ≥ 30kg/m2 ** 88.1 11.9
Women (n = 120)
Percentage of body fat [DEXA] * 4.2 95.8
BMI ≥ 25kg/m2 ** 26.9 73.1
BMI > 27kg/m2 *** 46.2 53.8
BMI ≥ 30kg/m2 ** 72.3 27.7
DEXA: dual energy X-ray absorptiometry.
* Considering the cut-off points proposed by Lohman 14 for diagnosis of obesity (25% for men and 32% for women); ** According to the World Health Organization 8;
Figure 1
Receiver operating characteristic (ROC) curve of body mass index (BMI) by percentage of body fat using dual energy X-ray absorptiometry (DEXA) of the elderly men investigated, 95% confi dence interval (95%CI) for the area under the curve (AUC). Florianópolis, Santa Catarina State, Brazil, 2005.
Table 3
Sensitivity and specifi city of body mass index (BMI) cut-off points in relation to fat mass measured by dual energy X-ray absorptiometry (DEXA) * in elderly of both sexes. Florianópolis, Santa Catarina State, Brazil, 2005.
Categories Sensitivity (%) Specificity (%) False-positives False-negatives
Men (n = 60)
BMI ≥ 25kg/m2 ** 94.7 40 24 1
BMI > 27kg/m2 *** 73.7 72.5 11 5
BMI ≥ 30kg/m2 ** 31.6 97.5 1 13
Women (n = 120)
BMI ≥ 25kg/m2 ** 76.3 100.0 0 27
BMI > 27kg/m2 *** 56.1 100.0 0 50
BMI ≥ 30kg/m2 ** 28.9 100.0 0 81
* Considering the cut-off points proposed by Lohman 14 (25% for men and 32% for women) as the gold standard for the diagnosis of obesity;
** According to the World Health Organization 8;
*** According to the Nutrition Screening Initiative 9.
0.25 0.50 0.75 1.00 1 - Specificity
Area under ROC curve = 0.8275 1.00
Sensitivity
0.75
0.50
0.25
0.00
Discussion
In this study, significant differences in physical variables were observed between elderly men and women. Men had higher mean age, weight, height and fat free mass, and lower percentage of body fat, demonstrating that sex can be an im-portant variable in the determination of cut-off points for obesity. Such differentiation between men and women, during aging, is common in the literature 6,7,11,12.
There was a significant difference (p < 0.05) between the BMI values of the men and the wom-en. The results of this study differ from those of Sampaio & Figueiredo 25. In their study, conduct-ed with 316 elderly subjects agconduct-ed 70.5 ± 7.5 years (men) and 69.9 ± 6.3 years (women), they stated that there was no significant difference between the mean BMI values of elderly men and women.
Conversely, Santos et al. 26, in a study con-ducted in Chile with 1,220 men and women aged between 60 and 99 years old, showed that men were heavier than women, but that the latter had higher BMI. Perissinotto et al. 2 conducted a study with 3,356 elderly Italians and found that BMI
was significantly higher among the women than the men (27.6 ± 5.7kg/m2 and 26.4 ± 3.7kg/m2
respectively, p < 0.001). There was a high preva-lence of obesity, and higher values were observed among the women (28% against 16% in men, re-spectively).
In this investigation, the prevalence of obese women was higher when compared to men, ac-cording to the BMI classification, in common with other authors’ findings 2,26. Similar results
were observed for the percentage of body fat measured by DEXA, comparable with findings published by Perissinotto et al. 2.
Several studies have found evidence of the association of mortality with increased BMI val-ues. For instance, Ajani et al. 27 reported (through multivariate analyses adjusted for age, alcohol intake and physical activity), that the relative risk for mortality directly increases when BMI values escalate. They claimed that, for all age strata ana-lyzed (40-54, 55-69 and 70-84 years), even those who never smoked but had a BMI higher than 30kg/m2 had a death risk of approximately 70% when compared with groups with a BMI between 22.5 and 24.9kg/m2.
Figure 2
Receiver operating characteristic (ROC) curve of body mass index (BMI) by percentage of body fat using dual energy X-ray absorptiometry (DEXA) of the elderly women investigated, 95% confi dence interval (95%CI) for the area under the curve (AUC). Florianópolis, Santa Catarina State, Brazil, 2005.
0.25 0.50 0.75 1.00 1 - Specificity
Area under ROC curve = 0.9003 1.00
Sensitivity
0.75
0.50
0.25
0.00
Increased BMI values are also directly related to increased risk of developing cardiovascular diseases and mortality 28,29.
Several authors have discussed the diagnosis of obesity based either on percentage of body fat or BMI. In a study by Kontogianni et al. 30, con-ducted with post-menopausal women, the BMI cut-off point for obesity (> 30kg/m2) detected a prevalence of 30.6%, while all participants (n = 115) were classified as obese when the per-centage of body fat criterion was used (> 32%). These results are similar to those presented in this article, where the prevalence of obese women, according to percentage of body fat was 95.8%.
Regarding the possible variation of percent-age of body fat among individuals with the same BMI values, Svendsen 31 compared subjects with BMI values of 25kg/m2 and observed that they exhibited a variation in percentage of body fat from 20% to 50%.
Hortobágyi et al. 32, in a study that analyzed BMI’s sensitivity and specificity in the diagnosis of obesity in men and women with mean ages of 39.3 ± 10.16 and 38.8 ± 10.54 years of age, re-spectively, detected that only 28% of men were classified as obese according to BMI, but 42% ac-cording to percentage of body fat. In women, 12% were diagnosed as obese by the BMI, and 40% according to percentage of body fat.
Sardinha & Teixeira 15, in a study conducted with women aged 60.5 ± 7.1 years and using as cut-off points values above 35% of body fat to determine obesity, showed that mean BMI was of 27.8 ± 4.2kg/m2 and the mean percentage of body fat was 42.6%. If we consider the sample used by these authors, the mean BMI would classify this population as pre-obese, while the percentage of body fat would define it as obese.
The data presented in this article show that mean BMI of the men was 26.5 ± 2.8kg/m2 and for the women it was 27.4 ± 3.9kg/m2. These BMI val-ues would classify this population as pre-obese, according to the WHO 8 criterion, but when
ana-lyzed by percentage of body fat 14, men would be diagnosed as non-obese (23.02 ± 5.8%), while the women would be classed as obese (37.3 ± 6.9%).
In this study, when the cut-off point for BMI > 30kg/m2 proposed by the WHO 8 for the diagno-sis of obesity was used, a sensitivity of 28.9% was obtained for women. Similar results were found by Sardinha & Teixeira 15, where the same point
presented a sensitivity of 26.8%, considered low by the authors, since it represented a high pro-portion of false-negatives (73.2%). That study dif-fered from this one in terms of the population studied and the percentage of body fat adopted (35%), and it is probably because of this that their sensitivity values were not even more similar.
Smalley et al. 33, in 1990, had already stated that the problem with BMI rests in the sensitivity of the method, since only 55.4% of women and 44.3% of men studied were correctly diagnosed as obese according to BMI, when compared to percentage of body fat. Their study comprised 213 women and 150 men aged 15-68 and 18-82 years old, respectively.
According to Goh et al. 16, the cut-off point for BMI proposed by the WHO 8 should be spe-cific for each age group and population, since it presents low sensitivity (6.7%) and specificity (13.4%) indexes for diagnosing obesity in Asian populations.
Sensitivity and specificity were also analyzed by Blew et al. 22 According to these authors, in a study conducted with a population of post-menopausal women aged 54.8 ± 4.8 years, the most accurate BMI cut-off point for the diagno-sis of obesity was 24.9kg/m2. In this study, the values of BMI with better sensitivity and speci-ficity for women and men were 22.89kg/m2 and 27.58kg/m2, respectively.
Other authors have observed that the percent-ages of body fat to define overweight and obesity vary with age, being necessary to establish specif-ic cut-off points for different stages of life 34.
Be-sides this, ethnic and cultural differences should also be considered, since they can be associated with BMI and percentage of body fat variables and may lead to misclassification of obesity and, consequently, of health prognosis 35.
The results of this investigation allow for the conclusion that the cut-off points proposed by the WHO 8 and the ones adopted by NSI 9 and
by Lipschitz 10 are not good indicators of obesity for the elderly of either sex, since they offer low sensitivity. Such low sensitivity would not classify as obese a great number of individuals with el-evated percentage of body fat and, consequently, at risk of developing the pathologies associated.
In Brazil, the cut-off points for BMI estab-lished by the Ministry of Health for the elderly population are based on values recommended by Lipschitz 10. The results of this research, although similar to those recommended by Ministry of Health, indicate that caution is needed in the use of diagnostic criteria of obesity in the elderly pop-ulation. Thus, from the viewpoint of public poli-cies aimed at meeting the nutritional needs of the elderly population, we suggest a revision of such criteria, particularly in relation to the difference observed between the sexes.
Resumo
O objetivo foi verificar a sensibilidade e especificidade dos pontos de corte do índice de massa corporal (IMC) propostos pela Organização Mundial da Saúde (OMS) e Nutrition Screening Initiative (NSI) no diagnóstico da obesidade em idosos. O estudo foi realizado com 180 idosos de Florianópolis, Santa Catarina, Brasil. O percentual de gordura corporal foi mensurado por absortometria radiológica de dupla energia. O IMC da NSI apresenta melhores valores de sensibilidade e especificidade para homens (73,7% e 72,5% respectiva-mente). Para os homens o IMC de 25kg/m2 apresentou
elevada sensibilidade (94,7%) e baixa especificidade (40%), enquanto o IMC de 30kg/m2 possui baixa
sensi-bilidade (31,6%) e elevada especificidade (97,5%). Nas mulheres, o IMC de 25kg/m2 (sensibilidade de 76,3% e
especificidade de 100%) foi o mais acurado. O ponto de corte da OMS mostrou sensibilidade muito baixa (28,9%). Os resultados desta investigação permitem concluir que os pontos de corte propostos pela OMS e NSI não são bons indicadores de sobrepeso/obesidade para idosos de ambos os sexos.
Índice de Massa Corporal; Sensibilidade e Especifici-dade; Sobrepeso; ObesiEspecifici-dade; Idoso
Contributors
F. A. G. Vasconcelos and E. L. Petroski took the lead in planning the study, participated in designing the study and critically reviewed all parts of the paper. B. A. Cor-deiro and C. R. Rech participated in designing the study, protocol execution, and interpretation of the results, besides writing the paper.
Acknowledgments
We are grateful to the elderly people who took part in this investigation, to the Santa Catarina State Science and Technology Research Support Foundation (FAPESC) for financial support and to the Diagnostic Imaging Center (SONITEC) for material support and to Professors Ma-ria de Fátima Nunes Marucci and Tânia Bertoldo Bene-detti, for their relevant criticism and contributions.
References
1. Barbosa AL, Santarém JM, Jacob Filho W, Meirelles ES, Marucci MFN. Comparação da gordura cor-poral de mulheres idosas segundo antropometria, bioimpedância e DEXA. Arch Latinoam Nutr 2001; 51:49-56.
2. Perissinotto E, Pisent C, Sergi G, Grigolettol F, Enzi G. Anthropometric measurements in the el-derly: age and gender differences. Br J Nutr 2002; 87:177-86.
3. França AP, Aldrighi JM, Marucci MFN. Fatores as-sociados à obesidade global e à obesidade abdo-minal em mulheres na pós-menopausa.Rev Bras Saúde Matern Infant 2008; 8:65-73.
4. Horani MHE, Mooradian AD. Management of obe-sity in the elderly. Treat Endocrinol 2002; 1:387-98. 5. Steen B. Body composition and aging. Nutr Res
1988; 46:18-23.
6. Kyle UG, Genton L, Hans D, Pichard C. Valida-tion of a bioelectrical impedance analysis equa-tion to predict appendicular skeletal muscle mass (ASMM). Clin Nutr 2003; 22:537-43.
7. Barrera G, Salazar G, Albala C, Vio F, Yañez M, Aicardi V, et al. Métodos de estimación de la com-posición corporal en ancianos: análisis crítico. Rev Méd Chile 1996; 124:1232-9.
8. World Health Organization. Obesity: prevent-ing and managprevent-ing the global epidemic. Report of a WHO Consultation on Obesity. Geneva: World Health Organization; 1998.
10. Lipschitz DA. Screening for nutritional status in the elderly. Prim Care 1994; 21:55-67.
11. Santos DM, Sichieri R. Índice de massa corporal e indicadores antropométricos de adiposidade em idosos.Rev Saúde Pública 2005; 39:163-8.
12. Silveira EA, Kac G, Barbosa LS. Prevalência e fato-res associados à obesidade em idosos fato-residentes em Pelotas, Rio Grande do Sul, Brasil: classificação da obesidade segundo dois pontos de corte do ín-dice de massa corporal. Cad Saúde Pública 2009; 25:1569-77.
13. Garcia ANM, Romani SAM, Lira PIC. Indicado-res antropométricos na avaliação nutricional de idosos: um estudo comparativo. Rev Nutr 2007; 20:371-8.
14. Lohman TG. Advances in body composition as-sessment. Champaign: Human Kinetics Books; 1992. (Current Issues in Exercise Science Series. Monograph, 3).
15. Sardinha LB, Teixeira PJ. Obesity screening in older women with body mass index: a receiver operat-ing characteristic (ROC) analysis.Sci Sports 2000; 15:212-9.
16. Goh VHH, Tain CF, Tong TYY, Mok HPP, Wong T. Are BMI and other anthropometric measures appro-priate as indices for obesity? A study in an Asian population. J Lipid Res 2004; 45:1892-8.
17. Rech CR, Cordeiro BA, Petroski EL, Vasconcelos FAG. Validation of bioelectrical impedance for the prediction of fat-free mass in Brazilian elderly sub-jects. Arq Bras Endocrinol Metab 2008; 52:1163-71. 18. Rech CR, Cordeiro BA, Petroski EL, Vasconcelos
FAG. Utilização da espessura de dobras cutâneas para a estimativa da gordura corporal em idosos. Rev Nutr 2010; 23:17-26.
19. Norton K, Olds T. Antropométrica. Porto Alegre: Editora Artmed; 2005.
20. Gordon CC, Chumlea WC, Roche AF. Stature, re-cumbent length, weight. In: Lohman T, Roche A, Martorell R, editors. Anthropometric standardiz-ing reference manual. Champaign: Human Kinet-ics Books; 1988. p. 3-8.
21. Martinez EZ, Louzada-Neto FL, Pereira BB. A cur-va ROC para testes diagnósticos. Cad Saúde Colet (Rio J.) 2003; 11:7-31.
22. Blew RM, Sardinha LB, Milliken LA, Teixeira PJ, Going SB, Ferreira DL, et al. Assessing the validity of body mass index standards in early postmeno-pausal women. Obes Res 2002; 10:799-808. 23. Salamone LM, Fuerst T, Visser M, Kern M, Lang T,
Dockrell M, et al. Measurements of fat mass using DEXA: a validation study in elderly adults. J Appl Physiol 2000; 89:345-52.
24. Kirkwood BR, Sterne JAC. Medical statistics. 2nd
Ed. Malden: Blackwell Science; 2003.
25. Sampaio LR, Figueiredo VC. Correlação entre o ín-dice de massa corporal e os indicadores antropo-métricos de distribuição de gordura corporal em adultos e idosos. Rev Nutr 2005; 18:53-61.
26. Santos JL, Albala C, Lera L, García C, Arroyo P, Pér-ez-Bravo F, et al. Anthropometric measurements in the elderly population of Santiago, Chile. Nutrition 2004; 20:452-7.
27. Ajani UA, Lotufo PA, Gaziano JM, Lee IM, Spels-berg A, Buring JE, et al. Body mass index and mor-tality among US male physicians. Ann Epidemiol 2004; 14:731-9.
28. Harris TB, Ballard-Barbasch R, Madans J, Makuc DM, Feldman JJ. Overweight, weight loss and risk of coronary heart disease in older women. The NHANES I Epidemiologic Follow-up Study. Am J Epidemiol 1993; 137:1318-27.
29. Harris TB, Launer LJ, Madans J, Feldman JJ. Cohort study of effect of being overweight and change in weight on risk of coronary artery disease in old age. BMJ 1997; 314:1791-4.
30. Kontogianni MD, Panagiotakos DB, Skopouli FN. Does body mass index reflect adequately the body fat content in perimenopausal women? Maturitas 2005; 51:307-13.
31. Svendsen OL. Should measurement of body com-position influence therapy for obesity? Acta Diabe-tol 2003; 40:250-3.
32. Hortobágyi T, Israel RG, O’Brien KF. Sensitivity and specificity of the Quetelet Index to assess obesi-ty in men and women. Eur J Clin Nutr 1994; 48: 369-75.
33. Smalley KJ, Knerr AN, Kendrick ZV, Colliver JA, Owen OE. Reassessment ob body mass indices. Am J Clin Nutr 1990; 52:405-8.
34. Movsesyan L, Laszlo B, Philip JL, Christiansen C, Svendsen OL. Variations in percentage of body fat within different BMI groups in young, middle-aged and old women. Clin Physiol Funct Imaging 2003; 23:130-3.
35. Gallagher D, Ruts E, Visser M, Heshka S, Baumgar-tner RN, Wang J, et al. Weight stability masks sar-copenia in elderly men and women. Am J Physiol Endocrinol Metab 2000; 279:E366-75.
Submitted on 17/Sep/2009