Andreia Camila Monteiro Oliveira
Development of a non-invasive approach
for oral squamous cell carcinoma
diagnosis
Dissertação de Mestrado
Mestrado em Genética Molecular
Trabalho efetuado sob a orientação de
Professora Doutora Isabel Maria Marques Carreira
Professora Doutora Ana Arminda Lopes Preto Almeida
iii
Agradecimentos
À Professora Doutora Isabel Carreira, em primeiro lugar, por possibilitar a realização deste projeto no laboratório pelo qual é responsável. Agradeço, ainda, a sua orientação, os seus conselhos e incentivos. Obrigada pela amabilidade e disponibilidade que sempre demonstrou. À Professora Doutora Ana Preto, por ter aceite ser minha orientadora institucional e pela disponibilidade demonstrada. Obrigada por me ter recebido de forma tão acolhedora na Universidade do Minho no meu primeiro ano de mestrado
À Ilda Ribeiro, o meu profundo agradecimento por todos os ensinamentos laboratoriais e pelas dicas de análise e interpretação dos resultados. Obrigada por toda a paciência que teve comigo, por todos os “Ildaaa” aos quais sempre socorreu. Não posso deixar de agradecer pelo tempo que dispensou ao ajudar-me na realização deste projeto, deixando muitas vezes o seu trabalho. Obrigada, também, por todas as vezes em que não deixou de acreditar em mim, mesmo quando as coisas não corriam da melhor forma e por me ter incentivado sempre a continuar e a melhorar. Ao serviço de Cirurgia Maxilo-Facial do Centro Hospitalar e Universitário de Coimbra, e em especial ao Dr. Francisco Marques, pela recolha das amostras e pela disponibilidade demonstrada em ajudar na realização deste projeto.
A toda a equipa do laboratório de Citogenética e Genómica, pela simpatia com que me receberam e pelo bom ambiente que me proporcionaram ao longo deste ano. Um agradecimento especial ao Miguel pela disponibilidade que sempre demonstrou e por todos os ensinamentos. Obrigada por todas as vezes que me ajudou a solucionar problemas ou a interpretar os resultados. Agradeço também à Joana Rodrigues por me ter ajudado na integração no laboratório, pelos conselhos e dicas que tanto me ajudaram e ainda pela transmissão de conhecimentos em cultura de células. Obrigado por todos os bons momentos passados e pela amizade de longa data. Aos meus colegas de mestrado por me fazerem sentir integrada desde o inicio do mestrado. Obrigada pela amizade e pelos bons momentos vividos. Obrigada, também, pela ajuda, por toda a partilha de conhecimentos e pela união que carateriza a nossa “colheita”. Trago todos comigo no coração.
Às minhas “miguitas” Joana, Luísa, Mariana e Nicole, que rapidamente deixaram de ser apenas colegas de laboratório para se tornaram amigas. Obrigada por partilharem esta experiência
iv
por todas as vezes em que nos esquecíamos que os cafés são locais públicos e por tudo o que passamos juntas. Não poderia deixar também de lhes agradecer toda a ajuda e disponibilidade que sempre demonstraram na realização deste projeto. Sem elas esta experiência não seria a mesma.
À Carolina, por ser a melhor amiga, ouvinte e colega de casa. Obrigada pela companhia ao fim do dia que tanto me ajudou a suportar as dificuldades sentidas ao longo deste ano, por todas as vezes em que ouviu as minhas queixas e frustrações sem nunca pestanejar, apoiando-me sempre e encorajando-me a continuar. Obrigada, ainda, pelos pequenos-almoços juntas que nos faziam sempre atrasar, mas que melhoravam o meu humor matinal. Como diz a sua avó, somos mesmo amigas.
Ao Tiago, pela paciência e apoio incondicional. Obrigada por estar sempre a meu lado, por me enxugar as lágrimas todas as vezes que desanimava e por suportar o meu mau feitio. Obrigada por todo o amor e carinho que sempre me deu e que tantas vezes me reconfortaram. Agradeço-lhe, ainda, pela ajuda na construção/edição de imagens e por todas as vezes em que parou o seu trabalho para dar prioridade ao meu.
Ao meu pai, o meu pilar, por nunca duvidar de mim e por me apoiar sempre em todas minhas decisões académicas. Não posso deixar de lhe agradecer pela formação e educação que me deu e por fazer de mim sempre a sua primeira, senão única, prioridade. Obrigada por todo o afeto e carinho que tanto contribuiu para a minha integridade emocional. Em suma, obrigada por ser um verdadeiro “Super Pai”!
Development of a non-invasive approach for oral squamous cell carcinoma diagnosis
v
Abstract
Oral cancer is considered the sixth most common cancer worldwide. It is reported that 90% of the cases corresponds to oral squamous cell carcinoma (OSCC). Despite the progress in cancer research, the five-year survival rate remains low, mostly due to advanced stages of diagnosis and development of loco-regional recurrence. OSCC results from accumulation of numerous genetic and epigenetic changes, followed by clonal expansion. Therefore, one goal of this project was to characterize OSCC genetic and epigenetic profiles in order to find potential biomarkers that can be used to detect OSCC in early stages and also predict the disease progression. Moreover, since biopsy is an invasive and painful method, it is mostly used when there is a suspicion of malignancy. Consequently, it was also aimed to try to validate a non-invasive method for OSCC diagnosis and to follow up the patients. Taking into account the aims of this project, 65 samples from tumour tissues were acquired and analysed by MS-MLPA in order to detect the genetic and epigenetic alterations that can be associated with OSCC initiation and progression. Furthermore, 12 of this 65 samples were also analysed by aCGH. Regarding genetic events, the most frequent copy number variations (CNVs) detected by MS-MLPA were gains at chromosomes 16p and 19p, and losses at 3p, 9p and 11q. Additionally, the main rearrangements detected through aCGH were gains at chromosomes 3q, 8q and Xq, and losses at 3p,18q Yp and Yq. The methylation status of 25 genes was assessed and the results revealed that gene promotor methylation of WT1, PAX5, GATA5, MSH6 and RARβ represent good epigenetic biomarkers for OSCC. After the OSCC characterization, 59 samples acquired by scraping the tumour surface from the patients were also analysed by MS-MLPA. The results from this non-invasive method were compared with tumour tissue results and it was found agreement between the two samples in 60% and 72% of the genes analysed, as respects to CNVs and methylation status, respectively. These results were truly promising in an attempt to validate this non-invasive approach for screening the oral cavity and to follow up the patients diagnosed with OSCC.
In order to discovery some potential genetic and epigenetic alterations that can be associated with early stages of disease and risk of develop tumour relapses or metastasis, 49 samples of the surgery resection margin were analysed by MS-MLPA. It was suggested that deletion of CDKN2A and methylation of TP53 and WT1 are initial alterations in the OSCC carcinogenesis process.
Desenvolvimento de uma metodologia não invasiva para o diagnóstico do Carcinoma epidermoide da cavidade oral
vii
Resumo
O cancro oral é considerado a sexta neoplasia mais comum a nível mundial, sendo que mais de 90 % dos casos correspondem a carcinomas do tipo epidermoide. Apesar dos avanços a nível tecnológico e clínico, a taxa de sobrevivência a cinco anos não melhorou significativamente nos últimos anos devido, essencialmente, ao diagnóstico tardio e à elevada taxa de recidivas locais ou metástases. Atualmente, sabe-se que o carcinoma epidermoide da cavidade oral (CECO) resulta da acumulação de alterações genéticas e epigenéticas, seguida de expansão clonal. Assim sendo, este trabalho teve como objetivo a caracterização molecular do CECO na tentativa de encontrar potenciais biomarcardores que possam vir a ser úteis no diagnóstico precoce e na previsão da progressão da doença. Além disso, tendo em conta que a biopsia é um método invasivo e que causa desconforto, apenas é usado quando existe suspeita de malignidade. Consequentemente, através da realização deste projeto, pretendeu-se também validar uma metodologia não invasiva para diagnosticar o CECO e acompanhar os doentes. Tendo em conta os principais objetivos deste estudo foram inicialmente analisadas 65 amostras de tecido tumoral, recorrendo à metodologia MS-MLPA, na tentativa de encontrar as principais alterações genéticas e epigenéticas associadas com o CECO. Além disso, 12 dessas amostras foram também analisadas por aCGH. Considerando as variações genéticas, as alterações mais frequentes detetadas por MS-MLPA dizem respeito a ganhos localizados nos cromossomas 16p e 19p e perdas nos localizadas nos cromossomas 3p, 9p e 11q. Os resultados obtidos com a técnica aCGH demostraram maioritariamente ganhos nos cromossomas 3q, 8q e Xq e perdas nos cromossomas 3p, 18q, Yp e Yq. A metodologia MS-MLPA permitiu inferir o estado de metilação de 25 genes, levando a concluir que a metilação dos genes WT1, PAX5, GATA5, MSH6 e RARβ podem funcionar como biomarcadores para o CECO. Após a caracterização molecular do tumor foram analisadas, por MS-MLPA, 59 amostras provenientes da raspagem de células na região tumoral. A comparação destes resultados com os obtidos no tecido tumoral revelou que 60% dos genes analisados para o número de variação de cópias eram concordantes entre as duas amostras e, ainda, que o estado de metilação de 72% dos genes analisados também era concordante. Estes resultados demonstram ser promissores na tentativa de validação desta metodologia não invasiva. A análise de 49 amostras de tecido macroscopicamente não tumoral, contíguo ao tumor, permitiu sugerir que a deleção do gene CDKN2A e a metilação dos genes TP53 e WT1 são alterações iniciais no processo de carcinogénese do CECO.
ix Contents
Agradecimentos ... iii
Abstract ... v
Resumo ... vii
List of acronyms and abbreviations ... xiii
List of figures ... xvii
List of tables ... xix
1. Introduction ... 1
1.1. Cancer ... 1
1.2. Oral cancer ... 2
1.3. Epidemiology ... 3
1.4. Oral squamous cell carcinoma histology and progression ... 4
1.5. Staging... 5
1.6. Risk factors ... 7
1.6.1. Tobacco ... 7
1.6.2. Alcohol ... 8
1.6.3. Nutritional factors and other lifestyle behaviours ... 8
1.6.4. Virus ... 9
1.6.4.1. Human papillomavirus ... 9
1.6.4.2. Epstein - Barr virus ... 9
1.7. Detection and diagnosis... 10
1.8. Therapy for oral cancer... 12
1.8.1. Surgery... 12
1.8.2. Radiotherapy ... 12
1.8.3. Chemotherapy ... 13
x
1.9. Genetic and cytogenetic alterations in oral squamous cell carcinoma... 14
1.9.1. Region 3p ... 16 1.9.2. Region 3q ... 16 1.9.3. Region 7p ... 17 1.9.4. Region 8p ... 17 1.9.5. Region 8q ... 17 1.9.6. Region 9p ... 18 1.9.7. Region 9q ... 18 1.9.8. Region 11q ... 19 1.9.9. Region 13q ... 20 1.9.10. Region 17p ... 20 1.9.11. Region 18q ... 21 1.10. Epigenetic alterations ... 21 1.10.1. DNA methylation ... 21 1.11. Laboratory techniques ... 24
1.11.1. Array Comparative Genomic Hybridization ... 24
1.11.2. Methylation Specific Multiple Ligation-dependent Probe Amplification ... 25
2. Aims ... 29
3. Materials and Methods ... 31
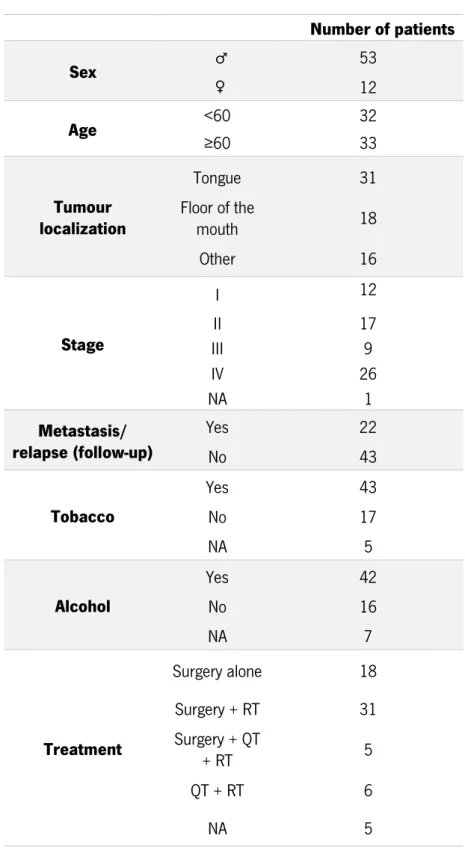
3.1. Samples and patients ... 31
3.3. DNA extraction ... 33
3.4. DNA quantification and assessment of DNA purity ... 33
3.5. Array Comparative Genomic Hybridization ... 33
3.6. Methylation-Specific Multiplex Ligation-dependent Probe Amplification Assay ... 34
3.7. Statistical analysis ... 37
xi
4.1. Array Comparative Genomic Hybridization ... 39
4.2. Methylation-Specific Multiplex Ligation-dependent Probe Amplification ... 41
4.2.1. Tumour samples characterization ... 41
4.2.1.1. Copy number variations ... 42
4.2.1.2. Methylation profile ... 48
4.2.2. Non-tumour samples characterization ... 53
4.2.2.1. Copy number variations ... 53
4.2.2.2. Methylations profile ... 57
4.2.3. Comparison between biopsies samples and exfoliated cells ... 62
5. Discussion ... 67
5.1. Genetic and epigenetic characterization of oral cancer tissue samples ... 67
5.1.1. Copy number variation ... 67
5.1.1.1. Chromosome 3 ... 67 5.1.1.2. Chromosome 8 ... 68 5.1.1.3. Chromosome 9 ... 69 5.1.1.4. Chromosome 11 ... 70 5.1.1.5. Chromosome 16 ... 71 5.1.1.6. Chromosome 18 ... 71 5.1.1.7. Chromosome 19 ... 72 5.1.1.8. Chromosome Y ... 73 5.1.2. Methylation profile ... 73 5.1.2.1. WT1 ... 73 5.1.2.2. PAX5 ... 74 5.1.2.3. GATA5 ... 75 5.1.2.4. MSH6 ... 75 5.1.2.5. RARβ ... 76
xii
5.2. Non-tumour tissue ... 76
5.3. Exfoliated cells: a viable tool for oral squamous cell carcinoma screening? ... 78
5.4. Comparison between MS-MLPA and aCGH ... 79
6. Conclusions ... 81
7. Future perspectives ... 83
xiii
List of acronyms and abbreviations
5-FU 5-fluorouracil
aCGH Array Comparative Genomic Hybridization
AKT Protein Kinase B
APC Adenomatous polyposis coli
ASR Age-standardised rate
ATM ATM serine/threonine kinase
BCL2 BCL2, apoptosis regulator
BFB Breakage-fusion-bridges
BRCA1 Breast cancer1
BRCA2 Breast cancer 2
CADM1 Cell adhesion molecule 1
CASR Calcium-sensing receptor
CCDN1 Cyclin D1 CD44 CD44 molecule CDH1 Cadherin 1 CDH13 Cadherin 13 CDH2 Cadherin 2 CDK Cyclin-dependent kinase CDK6 Cyclin-dependent kinase 6
CDKN2A Cyclin-dependent kinase inhibitor 2A
cfDNA Cell free DNA
CFTR Cystic fibrosis transmembrane conductance regulator
CHEK1 Checkpoint kinase 1
CHFR Checkpoint with forkhead and ring finger domains
cm Centimeters
CNV copy number variation
CREM cAMP responsive element modulator
CSMD1 CUB and Sushi multiple domains 1
DAPK Death-Associated Protein Kinase 1
xiv
DCUN1D1 DCN1, defective in cullin neddylation 1, domain containing 1) DDR DNA damage responsive
DNMT DNA methyltransferase
DSB Double-strand breaks EBV Epstein-Barr virus
EGFR Epidermal Growth Factor
ErbB Epidermal growth factor receptor
ESR1 Estrogen receptor 1
FDA Food and Drug Administration
FHIT Fragile histidine triad
FISH Fluorescence in Situ Hybridization
GALR1 Galanin receptor 1
GATA4 GATA binding protein 4
GATA5 GATA binding protein 5
GSTP1 Glutathione S-transferase pi 1
H2AFX H2A histone family, member X
HIF Hypoxia inducible factor HNC Head and neck cancer
HNSCC Head and neck squamous cell carcinomas
HPV Human papillomavirus
hsr homogeneously staining region
IL12A Interleukin 12A
IL2 Interleukin 2
ING1 Inhibitor of growth family, member 1
JAK Janus kinase
KLK3 Kallikren-related peptidase 3
KLLN Killin
LOH Loss of heterozygosity
LRP12 Low density lipoprotein receptor-related protein 12
MAPK Mitogen-activated protein kinases
MGMT O-6-methylguanine-DNA methyltranferase
xv
MLH3 mutL homolog 3
MLPA Multiplex Ligation-dependent Probe Amplification
MME Membrane metallo-endopeptidase
MRE11A MRE11 homolog A, double strand break repair nuclease
mRNA Messenger ribonucleic acid
MSH6 mutS homolg 6
MS-MLPA Methylation Specific Multiple Ligation-dependent Probe Amplification
MTAP Methylthioadenosine phosphorylase
mTOR Mechanistic target of rapamycin
MTUS1 Microtubule associated tumour suppressor 1
MVD Mevalonate diphospho-decarboxylase
MYC V-myc avian myelocytomatosis viral oncogene homolog
NOTCH1 notch1
OSCC Oral squamous cell carcinoma
PAH Phenylalanine hydroxylase
PARD6G Par-6 family cell polarity regulator gamma
PAX5 Paired box 5
PAX6 Paired box 6
PCR Polymerase Chain Reaction
PI3K Phosphatidylinositol 3-kinase
PIK3CA Phosphatidylinositol-4,5-bisphosphate 3-kinase, catalytic subunit alpha
PMP22 Peripheral myelin protein 22
pRb Phosphorylated Retinoblastoma
PTCH1 Patched 1
PTEN Phosphatase and tensin homolog
PTK2 Protein tyrosine kinase 2
PTPRD Protein tyrosine phosphatase, receptor type, D
PYCARD PYD and CARD domain containing
QT Chemotherapy
RARβ Retinoic acid receptor, beta
RAS Rat sarcoma viral oncogene RB1 RB transcriptional corepressor 1
xvi
RT Radiotherapy
SCC Squamous cell carcinoma
SOX2 Sex determining region Y-box 2
SPSS Statistical Package for Social Sciences
STAT3 Signal transducer and activator of transcription 3
STK11 Serine/threonine kinase 11
Tblue Toluidine Blue
THBS1 Thrombospondin 1
TM4SF1 Transmembrane 4 L six family member 1
TNM Tumour-node-metastasis
TP53 Tumour protein p53
TP63 Tumour protein p63
TP73 Tumor protein p73
TSC2 Tuberous sclerosis 2
TSG Tumour suppressor gene
TUSC3 Tumour suppressor candidate 3
VHL von Hippel-Lindau tumor supressor
WHSC1L1 Wolf-Hirschhorn syndrome candidate 1-like 1
WNT1 Wingless-type MMTV integration site family, member 1
xvii
List of figures
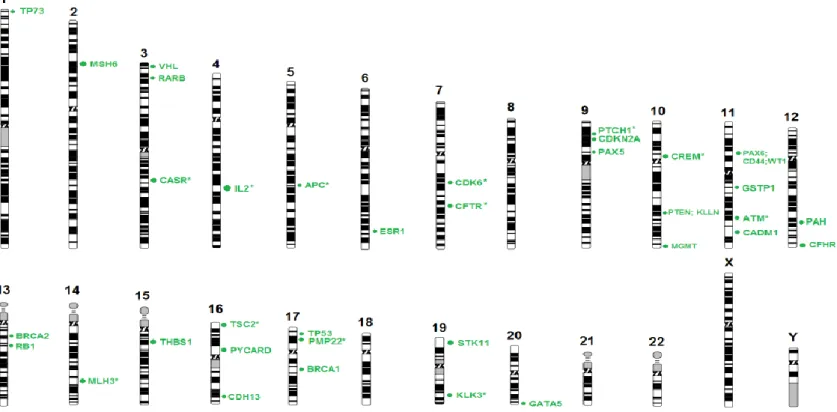
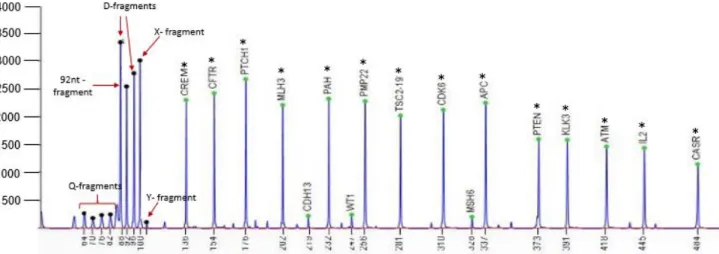
Figure 1- The hallmarks of cancer.. ... 2 Figure 2- Anatomy of the oral cavity ... 2 Figure 3- Incidence of lip and oral cavity worldwide, in both genders ... 3 Figure 4- Genetic progression model of OSCC tumourigenesis. Clinical and histologic progression from benign squamous hyperplasia through more advanced stages of squamous dysplasia to invasive squamous cell carcinoma in situ. ... 4 Figure 5- DNA methylation in cancer. CpG islands hypermethylated, resultant in gene silencing and hypomethylation of CpG-poor oncogene promoters, resultant in genomic instability and abnormal gene expression ... 22 Figure 6- Principles of aCGH. a) Reference DNA is labelled with a green fluorescence dye (Cy3) and the DNA of the sample to be tested is labelled with red (Cy5). The two samples are mixed and co-hybridized to an array containing genomic DNA targets. The fluorescence intensity is measured and it is proportional to the ratio of the copy numbers of DNA sequences in the test and reference genomes. The green areas on the slides correspond to less DNA in the test sample (deletion) and red areas indicate extra DNA copies in the test sample (duplication) A Scanner is responsible for the conversion of the results into images. b) Example of an array profile. ... 25 Figure 7- Schematic representation of MS-MLPA assay ... 26 Figure 8- Chromosomal distribution of the genes studied using SALSA MS-MLPA ME002-C1 tumour suppressor-2 probemix ... 35 Figure 9- Summary of the more significant chromosomal gains and losses detected by aCGH in 12 OSCC samples ... 40 Figure 10- CNVs electropherogram of a male control sample analysed by MS-MLPA using SALSA MLPA probemix ME002. ... 42 Figure 11- Methylation electropherogram of a male control sample analysed by MS-MLPA using SALSA MLPA probemix ME002. ... 42 Figure 12- The most frequent gains detected in 65 OSCC samples using SALSA MLPA probemix ME002. ... 47 Figure 13- The most frequent deletions detected in 65 OSCC samples sing SALSA MLPA probemix ME002. ... 48
xviii
Figure 14- The most frequent methylated genes detected in 65 OSCC samples using SALSA MLPA probemix ME002 ... 52 Figure 15- The most frequent CNVs detected in 48 non tumour samples using SALSA MLPA probemix ME002. ... 57 Figure 16- The most frequent methylated genes detected in 48 non-tumour samples using SALSA MLPA probemix ME002. ... 58 Figure 17- Five of the 22 genes that showed agreement between the tumour tissue and exfoliated cells in 59 samples analysed by MS-MLPA, regarding CNV. ... 63 Figure 18- Five of the 18 genes that showed agreement between the tumour tissue and exfoliated cells in 59 samples analysed by MS-MLPA, regarding methylation. ... 65
xix
List of tables
Table 1- TNM Staging of oral cancer ... 6
Table 2- Oral cavity stages based on TNM classification ... 7
Table 3- Most frequent altered genes in OSCC. ... 15
Table 4- Frequent hypermethylated genes in OSCC. ... 23
Table 5- Clinical-pathologic features of the patients ... 32
Table 6- Interpretation of Copy Number Status obtained from Coffalyser.Net. ... 37
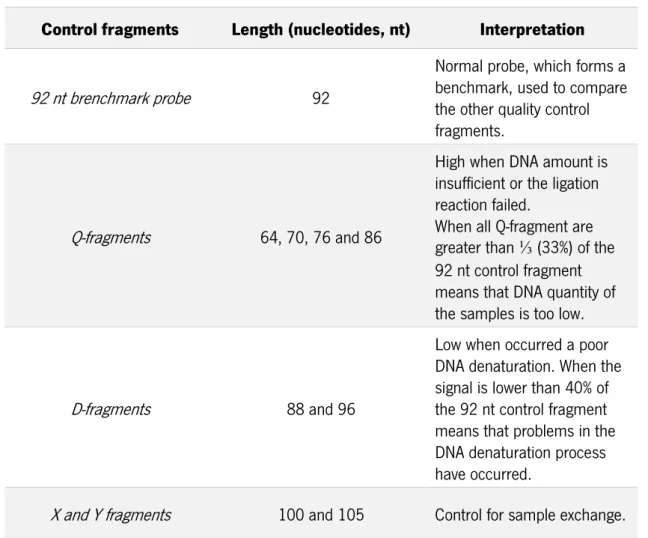
Table 7- Quality control fragments of MS-MLPA ... 41
Table 8- Genetic imbalances detected by MS- MLPA in tumour tissue samples. ... 43
Table 9- Methylation profile of tumour tissue samples analysed by MS-MLPA samples. ... 49
Table 10- Genetic imbalances detected by MS- MLPA in non-tumour samples ... 54
Table 11- Methylation profile of non-tumour tissue samples analysed by MS-MLPA samples ... 59
Table 12- Genes that showed agreement between tumour tissue and exfoliated cells samples, regarding CNVs ... 62
Table 13- Genes that showed agreement between tumour tissue and exfoliated cells samples, regarding methylation profile ... 64
1
1. Introduction
1.1. Cancer
Cancer is one of the leading causes of death worldwide. According to GLOBOCAN, in 2012, 14.1 million new cancer cases were estimated and 8.2 million people died due to this disease (GLOBOCAN, 2012). It is predicted that this number is increasing, mainly, due to the growth and aging of population, allied to some lifestyle behaviours, such as smoking, inappropriate nutrition and physical inactivity (Torre et al., 2015).
Cancer is a disease characterized by genomic instability, known as “disease of the genome” (Garraway and Lander, 2013). This idea was supported by Boveri after observing chromosomal aberrations (Boveri, 2008). Over the years, as regards the genomic instability of cancer, researchers showed that some mutated genes were directly related to cancer, which can be divided in two classes: the oncogenes (that are derived from proto-oncogenes that suffer mutations with dominant gain of function) and the tumour suppressors genes (in which mutations lead to a recessive loss of function) (Garraway and Lander, 2013). The mechanisms that lead to mutated genes involve several genomic alterations such as deletion or nucleotide substitution, alterations in the copy number of chromosomes and DNA rearrangements (Macconaill and Garraway, 2010).
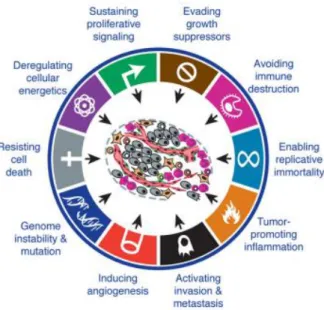
Although there are several types of cancer, it was suggested that all cancer cells shared some characteristics that make them a complex disease. Thus, cancer cells are: insensitive to anti-growth signals; capable of inducing angiogenesis and sustaining proliferative signalling; able to evade apoptosis. Furthermore, they have the potential of invasion and metastasis and possess limitless replicative potential (Hanahan and Weinberg, 2000). More recently, it was suggested that they are able to evade immune responses and to promote local inflammation. It was also suggested that they possess deregulated cell metabolism (Hanahan and Weinberg, 2011) (Figure 1).
2
Figure 1- The hallmarks of cancer. (Adapted from Hanahan and Weinberg, 2011).
1.2. Oral cancer
Head and neck cancer (HNC) involves several subtypes of cancer, including tumours that arise from nasal cavity, thyroid, trachea, nasopharynx, oropharynx, hypopharynx, larynx and oral cavity (Stadler et al., 2008).
The oral cavity comprises lip, tongue, floor of the mouth, salivary glands, buccal mucosa, gingiva and palate (Figure 2). Actually, oral cancer refers to tumour malignancies that may arise in any of these anatomic sites (Warnakulasuriya, 2009; Rhodus, 2009), being the tongue cancer the most common (Rhodus, 2009).
3 Along with pharyngeal, oral cancer is the six most common cancer worldwide (Warnakulasuriya, 2009). It is suggested that oral cancer is a result of accumulation of numerous genetic and epigenetic alterations, followed by clonal expansion. The development and progression of this disease involves several interacting pathways that are deregulated (Tan et al., 2013).
It is reported that more than 90% of oral malignancies correspond to squamous cell carcinomas (SCC) (Tsantoulis et al., 2007). The oral squamous cell carcinoma (OSCC) is proved to be a heterogeneous disease, meaning that oral tumours are composed by a heterogeneous cell population, like many other cancers (Chiou et al., 2008).
Although therapies to treat oral cancer have been improved, the five-year survival rate did not suffer substantial alterations in the past decades, remaining only about 50% (Noorlag et al., 2014). The main reason for this is, probably, related to the advanced stage of diagnosis and the frequent development of secondary tumours (Smeets et al., 2006). Accordingly, in order to overcome this problem, improved diagnostic methods must be developed and therefore the pathways involved in the development of oral cancer should be better understood (Rajmohan et al., 2012).
1.3. Epidemiology
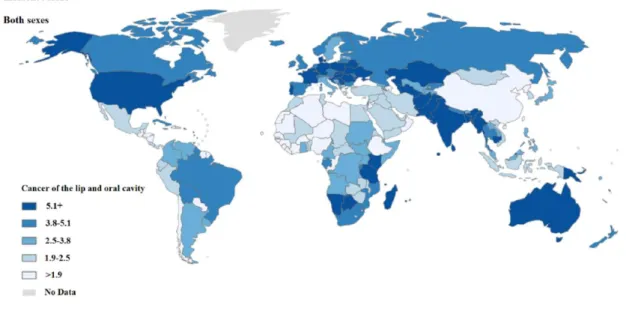
Oral cavity cancer shows high incidence rates worldwide, especially in some developed countries (Figure 3). In 2012, 300.400 new cases were estimated with an age-standardized rate (ASR) of 4 per 100.000. This disease is more frequently in men than women, (198.975 new cases in men comparatively with 101398 in women) (GLOBOCAN, 2012).
4
Despite the fact that the incidence of this malignancy is higher in developed countries, India presents the highest rate of oral cancer with 77.003 new cases in 2012, mainly due to the Indian lifestyle (Nagpal and Das, 2003).
Portugal has also a high incidence rate of oral cancer, being reported 1294 new cases in the last GLOBOCAN analysis. As in the great majority of the countries, this disease is also more frequent in males, being considered the 7th neoplasia more common in Portuguese men
(GLOBOCAN, 2012).
Oral cancer is an unusual disease in young people (Warnakulasuriya et al., 2007), being the average of detection at 62 years old. However, it is revealed that more than a quarter of patients that develop this disease are younger than 55 (Society, 2015).
1.4. Oral squamous cell carcinoma histology and progression
The oral cavity is lined by a protective mucous membrane, namely oral mucosa. The squamous epithelium that lines the oral cavity is characterized to be stratified and varies in terms of keratinization and thickness (Pai and Westra, 2009).
Oral cancer is considered to be an epithelial neoplasia. The development of a carcinoma is dependent of a multi-step process involving the transition from pre-malignant lesion to metastatic tumour. The progression of neoplasia evolves from benign hyperplasia, to dysplasia to carcinoma in situ and, finally, to invasive carcinoma (Rhodus, 2009; Nagpal and Das, 2003) (Figure 4).
Figure 4- Genetic progression model of OSCC tumourigenesis. Clinical and histologic progression from benign squamous hyperplasia through more advanced stages of squamous dysplasia to invasive squamous
5 There are four oral lesions that play a distinct role in oral cancer, such as leukoplakia, erythroplasia, lichen planus and erythroleukoplakia (Rhodus, 2009; Tsantoulis et al., 2007). The leukoplakia is the most common oral lesion and it is phenotypically characterized by white patches or plaques. This lesion, associated with some risk factors, increases the possibility of developing a tumour (Rhodus, 2009). It is suggested that this process starts with the overgrowth of deregulated stem cells, present in the basement membrane. Thus, these cells replace the normal epithelium by expanding upward and laterally (Nagpal and Das, 2003).
The neoplastic alterations on the epithelium surface, termed dysplasia, involve abnormal cellular organization, increased mitotic activity and nuclear expansion with pleomorphism. In order to distinguish the severity of the cellular atypia, a three-degree scale was developed. Although the classification depends on the pathologist, when the atypia is limited only to 1/3 of the epithelium, the dysplasia is considered mild, if the atypia riches 2/3 of the epithelium, the dysplasia is referred as moderate and finally, the atypia that involves the entire epithelium is considered a severe dysplasia (Pai and Westra, 2009).
Although in some cases the patients diagnosed with oral carcinoma did not show dysplasia in previous biopsies, the existence of epithelial dysplasia is considered to be the main condition for carcinoma development (Reibel, 2003). With the progression of dysplasia, the carcinoma in situ can invade the basement membrane and infiltrate in subepithelial connective tissues through nests and cords (Pai and Westra, 2009). At least, in more advanced stages, though lymphatic spaces and perineural invasion, the nests and cords can invade skeletal muscle, craniofacial bones and facial skin (Thompson, 2006).
In terms of histology, at microscopy level, there is no significant differences between SCC that arise from oral cavity and those localized in other head and neck sites (Thompson, 2006).
1.5. Staging
Staging cancers is essential to determine the prognosis of the patient and to establish which treatment should be applied. The anatomic staging of oral cancer is provided by the TNM (tumour-node-metastasis) system. T represents the size of the primary tumour, N expresses the status of the regional lymph nodes and M indicates the presence or absence of distant metastasis (Neville and Day, 2002).The TNM system is showed in Table 1.
6
Table 1-TNM Staging of oral cancer. Adapted from Neville et al., 2002 (Neville and Day, 2002). Primary tumour (T)
Tx Primary tumour cannot be assessed T0 No evidence of primary tumour Tis Carcinoma in situ
T1 Tumour 2 cm or less in greatest dimension
T2 Tumour more than 2 cm but not more than 4 cm in greatest dimension T3 Tumour more than 4 cm in greatest dimension
T4 Tumour invades adjacent structures Nodal involvement (N)
Nx Regional lymph nodes cannot be assessed N0 No regional lymph node metastasis
N1 Metastasis in a single ipsilateral lymph node, 3 cm or less in greatest dimension
N2 Metastasis in a single ipsilateral lymph node, more than 3 cm but not more than 6 cm in greatest dimension
N3 Metastasis in a lymph node more than 6 cm in greatest dimension Distant metastasis (M)
Mx Distant metastasis cannot be assessed M0 No distant metastasis
M1 Distant metastasis
The T, N, M categories can be combined in 32 possible ways, which are grouped in 5 different stages: 0, I, II, III or IV. Stage IV itself is divided into four different stages (Trotta et al., 2011; Neville and Day, 2002) (Table 2).
7
Table 2- Oral cavity stages based on TNM classification. Adapted from Neville et al., 2002 (Neville and Day, 2002).
Cancer stage T category N category M category
0 Tis N0 M0 I T1 N0 M0 II T2 N1 M0 III T1,T2,T3 N0,N1 M0 IV T1,T2,T3 T4 Any T Any T N2 N0,N1,N2 N3 Any N M0 M0 M0 M1 1.6. Risk factors
Taking the oral cancer etiology into account, it seems that several risk factors are involved in this malignancy, such as carcinogen exposure, poor / lack of oral hygiene, eating habits, family history, chronic inflammation and viruses (Pai and Westra, 2009; Rhodus, 2009).
1.6.1. Tobacco
The main risk factor associated with oral cancer development is tobacco smoking, especially if combined with alcohol consumption (Hashibe et al., 2000). A study demonstrated the risk of smoking, revealing that in 400 oral cancer patients, 72% smoke and from those, more than 50% consume more than one pack per day (Rhodus, 2009). The exposure to tobacco smoking, in a passive way, also appears to increase the probability of developing oral cancer (Pai and Westra, 2009).
Tobacco has carcinogenic properties as nitrosamines and polycyclic hydrocarbons that may lead to genotoxic effects (Pai and Westra, 2009). Tobacco smoking is correlated with mutations on the TP53 (tumour protein p53) gene that is associated with resistance to radiotherapy (RT). Furthermore, smoking promotes tumour hypoxia that also affects the efficacy of RT. The carbon monoxide derived from smoking binds with hemoglobin, forming a carboxyhemoglobin complex that
8
increases the dose of radiation needed for the treatment (Kawakita et al., 2012). Studies demonstrate that the cessation of tobacco smoking reduces, but does not eliminate, the risk of developing cancer (Pai and Westra, 2009). Moreover, generally, patients who stop smoking during RT, have better prognosis (Kawakita et al., 2012).
1.6.2. Alcohol
Alcohol is already considered to be a risk factor for oral cancer and its effect increases substantially when conjugated in a synergetic manner with tobacco smoking (Dal Maso et al., 2015). Alcohol is known to be a chemical solvent and consequently it is responsible for an increasing and longer exposure of the oral mucosa to tobacco carcinogens (Pai and Westra, 2009). Although alcohol is not treated as carcinogen, its direct metabolite, acetaldehyde, has carcinogenic properties that can affect the mechanisms of DNA synthesis and repair (Pai and Westra, 2009; Sciubba, 2001).
1.6.3. Nutritional factors and other lifestyle behaviours
It is reported that nutrition plays a critical role in oral cancer development, suggesting that a poor diet, deficient in fruits, vegetables and carotenoids increases the probability of having this disease (Foulkes, 2013; Petti, 2009; Ram et al., 2011). Several studies suggest that fruits and vegetables are composed by substances containing antioxidant and anti-carcinogenic properties as vitamins (A, C and E), fibers, folates, carotenoids and flavonoids that can reduce the risk of oral cancer development (Petti, 2009; Foulkes, 2013). Additionally, these substances can also have a counterbalance role by decreasing the effects of carcinogenic factors (Petti, 2009).
Studies revealed that there are other factors that are implicated in oral cancer incidence, such as oral hygiene and sunlight exposure (Ram et al., 2011). Poor oral hygiene practices and prolonged irritation of teeth revealed to have a role in the development of oral cancer. Besides that, it is believed that poor oral hygiene can stimulate the carcinogenic potential of tobacco (Ram et al., 2011). Moreover, it was already verified that prolonged exposure to sunlight may be a risk factor of oral cancer, mainly for lip cancer. In this regard, a study revealed that in Greece, amongst oral cancer patients, nearly 60% had lip cancer, probably due to prolonged exposure to the sunlight (Foulkes, 2013).
9 1.6.4. Virus
The number of oral cancer cases related to smoking and alcohol consumption has been declining over the past 30 years, since smoking habits are lower. In turn, the number of young people diagnosed with OSCC, who do not consume tobacco or alcohol, has been increasing (Young et al., 2015). These cases are known to be related to virus infection and according to the data, the patients tend to be younger (Young et al., 2015; Chawla et al., 2015; Gupta and Gupta, 2015).
1.6.4.1. Human papillomavirus
Human papillomavirus (HPV) infection can be responsible for tumour initiation, since it was already discovered that viral genomic DNA is integrated in the genome of more than 90% of cervical tumours and in 70% of oropharyngeal tumours (Pai and Westra, 2009).
So far, more than 50 HPV are recognized to infect the human mucosa. Among them, the HPV 16 is found in more than 90% of HPV-related HNC cases (Tornesello et al., 2014). The HPV infection invades epithelium basal cells of skin or mucosa. After the invasion, infected cells can proliferate and spread laterally. Then, early viral genes are expressed, in particularly the E6 and E7 oncogenes. These two oncoproteins interact with the tumour suppressor genes TP53 and RB1 (RB transcriptional corepressor 1), respectively. When the E6 oncoprotein interacts with TP53, it promotes its degradation by an ubiquitin-dependent manner, inhibiting p53-mediated apoptosis. The E7 oncoprotein forms a complex with RB1 causing its inactivation. This inactivation leads to E2factor (E2F) free accumulation which originates increase of CDKN2A/p16 (cyclin-dependent kinase inhibitor 2A) and, subsequently, abnormal cell proliferation (Agrawal et al., 2013; Leemans et al., 2011).
Studies revealed that HNC HPV-related had histologic and molecular differences from HNC HPV-negative (Pai and Westra, 2009). Furthermore, HPV-positive patients have a better prognosis compared with HPV-negative (Gupta and Gupta, 2015).
1.6.4.2. Epstein - Barr virus
Another virus that can be associated with oral cancer development is Epstein - Barr virus (EBV) (Shimakage et al., 2002). EBV is a γ-Herpes virus, which creates a latent infection in lymphocytes (Chawla et al., 2015). It is proved that this virus endures and can replicate in the epithelial cells of oral mucosa (Shimakage et al., 2002). Taking this into account, Shimakage et al. (2002) showed that EBV virus can infect epithelial cells, being responsible for some types of oral
10
cancers (Shimakage et al., 2002). Studies confirmed the presence of mRNA and proteins of EBV virus in a high percentage of OSCC cases, suggesting that, in these cases, EBV is responsible for this malignancy (Chawla et al., 2015; Cruz et al., 1997; Gupta and Metgud, 2013).
It is suggested that OSCC patients infected with EBV have better prognosis comparatively with those that are not infected with this virus (Llewellyn et al., 2001).
1.7. Detection and diagnosis
As for the majority of the cancers, the early detection of oral cancer is crucial for treatment and survival of patients (Kugimoto et al., 2012). Although oral cavity is a region that can be visually examined due to its easy access, the OSCC are often diagnosed at advanced stages (III or IV) (Hassona et al., 2015; van der Waal et al., 2011). Besides that, the majority of oral cancers, in particular OSCC, are diagnosed when signs and symptoms are already present (van der Waal et al., 2011).
Oral cancer screening can be performed by a physical examination that consists in detection of nodules, mucosa alterations (as changes in colour or texture), swellings and unexplained lymph adenopathy. The physical examination can also be performed by examination (Kao and Lim, 2015). Nonetheless, this method is controversial because it depends on the experience and knowledge of the operator (Awan, 2014). Therefore, a suspicion of a positive finding must be confirmed by biopsy (Kao and Lim, 2015). Nowadays, biopsy represents the main method used for oral cancer detection and diagnosis. This method is followed by a histopathological evaluation performed by a pathologist. Even though biopsy is considered to be the gold standard for oral cancer diagnosis, it is expensive, invasive and also a lengthy process. So, other techniques can be used in order to diagnose this disease in early stages (Awan, 2014).
Toluidine Blue (Tblue) is a metachromatic dye that has affinity to cancer cells, since it stains the acidic tissue components used in pre cancer and cancer detection (Awan, 2014; Kao and Lim, 2015). Nonetheless, the positive results should be confirmed by biopsy (Kao and Lim, 2015).
Another method of screening is the use of optical technologies that is advantageous, because it provides a real time assessment in a minimal invasive manner.
Autofluorescence is the optical technology most frequently used. This technique provides real time results, is easy to perform and cost effective. Although this method allows the determination of the difference between diseased oral mucosa and “normal” oral mucosa, it does not always provide the type of oral lesion. Moreover, the positive results for oral lesion must be confirmed by
11 biopsy (Awan, 2014). Optical technologies also include Raman spectroscopy, confocal laser endomicroscopy, confocal reflectance microscopy and narrow band imaging (Davies et al., 2015).
Exfoliative cytology is another diagnostic method, which consists in tissue collection from mucosal surfaces by scrapping or brushing to detect cytological alterations. This technique is advantageous, because it is painless, non-invasive and simple to perform. Additionally, cell sample collection can be repeated numerous times to diagnose and follow-up the patients (Verma et al., 2015; Bremmer et al., 2005). A study revealed that Tblue staining and exfoliative cytology used in combination is a sensitive and specific method for oral lesions detection (Gupta et al., 2007). Bremmer et al. (2009) analysed the DNA from exfoliated cells samples from 25 patients with oral lesions and compared the results with biopsy results from the same patients. Their results showed that the non-invasive assay had a high sensitive rate and a positive predictive value of 100%. Thus, they inferred that this non-invasive technique could be promising to detect oral lesions, including, oral cancer (Bremmer et al., 2009). However, up to now, this technique is still limited because some false-positive and false-negative results were reported in a few studies (Kao and Lim, 2015).
The promising methods of oral cancer detection consist in the use of biomarkers present in biofluids such as saliva or plasma (Kao and Lim, 2015). Blood analyses are a minimally invasive technique that has been gained clinical value to cancer diagnosis. In plasma/serum of several cancer patients, the presence of cell-free DNA (cfDNA) from tumour cells has been suggested to have diagnostic value. It was already discovered that cfDNA contains genetic and epigenetic alterations that are related with cancer initiation, progression and resistance such as loss of heterozygosity (LOH) and mutations on tumour suppressor genes/oncogenes (Schwarzenbach et al., 2011). Saliva is an oral fluid that is easily accessed by a non-invasive approach. The use of this biofluid has been considered a promising method to diagnose several diseases, including cancer. Although more studies should been done in this area, it is already described that salivary biomarkers can be used to OSCC diagnosis, especially in early stages of the disease (Lee and Wong, 2009; Guerra et al., 2015).
Despite of the advances in diagnostic techniques, the detection of oral cancer, in an early stage, remains insufficient. Definitely, more accurate techniques should be implemented in order to do a diagnosis of oral cancer at early stages, promoting better prognosis. Besides that, instead of invasive techniques, which is the case of the biopsy, non-invasive or less invasive diagnosis methods should be applied.
12
1.8. Therapy for oral cancer
The treatment applied to oral cancer patients depends on the staging and the location of the tumour (Foulkes, 2013). Factors as nutritional status, general health, consumption of tobacco and alcohol must also be taken into account (Rhodus, 2009). Moreover, the choice of the appropriated treatment requires a sense of balance between tumour eradication and the anatomic and function preservation of the organs involved (Prince et al., 2010).
The main types of oral cancer treatments are local surgery, radiotherapy (RT) and chemotherapy (QT), which can be applied in combination (Rhodus, 2009; Foulkes, 2013). Tumours detected at early stages (I or II) can be curable by surgery or RT by itself. In contrast, tumours at advanced stages (III or IV) are normally treated with surgery followed by RT or QT (Tsantoulis et al., 2007). However, in advanced stages, with the presence of metastasis, the QT is only used as a palliative treatment (Gold et al., 2009).
1.8.1. Surgery
The purpose of surgery is the excision of the tumour. Normally, some portion of normal cells are also removed to prevent tumour recurrence and to eliminate lymph nodes that can be affected by the cancer. Surgery is considered the only curative option for oral cancer. After tumour removal, a reconstructive operation can be done in order to restore the anatomic form and function of the affected areas (Foulkes, 2013). In patients who had oral cancer at advanced stage, the surgery per se, is not sufficient to treat, so, the use of RT as an adjuvant is needed (Ko and Citrin, 2009).
1.8.2. Radiotherapy
RT uses high energy radiation (x-rays) to destroy cancer cells or to inhibit DNA replication. RT is used in different situations, such as:
- small primary tumours as an alternative of surgery;
- larger tumours in order to try to reduce the initial tumour before surgery;
- after surgery, that allows the elimination of some cancer cells that are not removed from surgery or in areas that through surgery it is difficult to achieve;
- incurable cancers. In these cases, RT is used as a palliative treatment, trying to reduce pain and bleeding and control tumour growth (Foulkes, 2013).
This treatment can affect the normal tissues that may become inflamed and in some cases may fall apart (Foulkes, 2013).
13 1.8.3. Chemotherapy
QT is based on the use of anti-cancer drugs that can be administered into vein or by mouth. The classic drugs more used in oral cancer QT are Cisplatin, Carboplatin, 5-fluorouracil (5-FU), Paclitaxel and Docetaxel, which can be used alone or in a combination of two. This kind of treatment has shown to be effective, especially when combined with RT or surgery (Foulkes, 2013). However, QT has several side effects, since these drugs target cells in rapid proliferation. Therefore, normal cells can also be affected, causing secondary effects that alter the quality of life (Gerber, 2008).
1.8.4. Target therapy
In the last years, oncobiologists focus their research in the molecular mechanisms involved in carcinogenesis, which allows the development of new therapeutic approaches. Target therapies are based on the use of agents that target specific molecules responsible for tumour initiation and growth. It is intended for this kind of treatment to be less aggressive for the patients, since the targeted molecules are expressed at high concentrations or even only in cancer cells. The agents used in target therapies are divided in two main types: monoclonal antibodies and small molecule inhibitors (Gerber, 2008).
In oral cancer, molecular agents targeting epidermal growth factor receptor (EGFR) are frequently used, since EGFR is highly expressed in this cancer. Up to now, Cetuximab is the only EGFR-target agent approved by Food and Drug Administration (FDA) for oral cancer treatment (Boeckx et al., 2013).
Cetuximab (commercially available as Erbitux®, Merck KGaA, Germany) is a human/murine
chimeric monoclonal antibody that inhibits tumour development by binding to the EGFR extracellular domain and, consequently, inhibiting EGFR dimerization and activation (Blick and Scott, 2007). Therefore, Cetuximab prevents proliferation, angiogenesis, anti-apoptotic signalling, invasion and metastasis (Burtness, 2005). Cetuximab can be used alone or in combination with RT or even in combination with classic QT (Boeckx et al., 2013).
The use of Cetuximab may lead to secondary effects as a result of the EGFR being also expressed in normal tissues. The more common side effects reported are cutaneous rash, nausea, diarrhea and vomiting (Gerber, 2008).
14
1.9. Genetic and cytogenetic alterations in oral squamous cell carcinoma The initiation and development of cancer results from changes in several pathways due to accumulation of genetic loci alterations that include point mutations, insertions, deletions, amplifications and chromosomal rearrangements (Tan et al., 2013). The most common altered genes in OSCC are divided in two main groups: oncogenes and tumour suppressor genes (Tsantoulis et al., 2007; Tan et al., 2013; Cha et al., 2011).
Detection of cytogenetic abnormalities has been revealed as useful markers for diagnosis and prognosis of tumours, including for OSCC (Gollin, 2001; Ribeiro et al., 2014b). Although some genetic abnormalities associated with HNSCC have been detected, cytogenetic analyses of solid tumours can be difficult due to numerous factors, such as low mitotic index or small specimen size. It is reported that only 30% of HNSCC can grow in culture and yield metaphase spreads can be analysed (Gollin, 2001).
It is revealed that structural chromosome alterations are frequent in HNSCC. The most common alterations that have been reported are deletions, translocations, homogeneously staining regions (hsr) and isochromosomes. Nevertheless, other alterations less frequent have been also described, including duplications, insertions, inversions, endoreduplication, ring chromosomes and dicentric chromosomes (Gollin, 2014).
Despite the complexity of OSCC, its high frequency of near-triploid and its composition of multiple clonal numerical and structural chromosome abnormalities, chromosomal gains and losses in OSCC have been described (Gollin, 2014). Martin et al. (2008) reported chromosomal losses at 3p, 4p, 8p, 11q, and 8q and chromosomal gains at 3q, 5p, 7p/q, 8q, 9q, 11q, 14q, 19q, and 20q in 31 cell lines of OSCC (Martin et al., 2008). A more recent study, developed by Ribeiro et al. (2014), identified the highest rates of gains at chromosomes 8 and 11 and chromosomal region 3q and the highest rates of losses at 3p and 8p, in OSCC samples (Ribeiro et al., 2014b). Besides these alterations, other chromosomal abnormalities have been detected in HNSCC (Tan et al., 2013; Gollin, 2014; Gollin, 2001).
The genes that have been reported as the most involved in HNSCC initiation and development are represented in Table 3 with the respective chromosome locations. The alterations associated with these genes will be further discussed.
15
Table 3- Most frequent altered genes in OSCC.
Region Genes Gene name Alteration References
3p FHIT Fragile histidine triad Loss (Gollin, 2014; Ribeiro et al., 2014b)
RARβ Retinoic acid receptor, beta Loss (Ribeiro et al., 2014b)
3q
TP63 Tumour protein p63 Gain (Gollin, 2014)
PIK3CA Posphatidylinositol-4,5-bisphosphate
3-kinase, catalytic subunit alpha Gain (Gollin, 2014)
7p EGFR Epidermal growth factor Gain (Gollin, 2001; Ribeiro et al., 2014b)
8p
CSMD1 CUB and Sushi multiple domains 1 Loss (Gollin, 2014)
WHSC1L1 Wolf-Hirschhorn syndrome candidate
1-like 1 Gain (Gollin, 2014)
8q MYC v-myc avian Myelocytomatosis viral oncogene homolog Gain (Ribeiro et al., 2014b; Gollin, 2014)
PTK2 Protein tyrosine kinase 2 Gain (Gollin, 2014)
9p PTPRD
Protein tyrosine phosphatase,
receptor type, D Loss (Ribeiro et al., 2014b)
CDKN2A Cyclin-dependent kinase inhibitor 2A Loss (Gollin, 2014)
9q NOTCH1 Notch 1 Gain (Tan et al., 2013)
11q CCND1 cyclin D1 Gain
(Gollin, 2014; Gollin, 2001; Martin
et al., 2008)
ATM ATM serine/threonine kinase Loss (Gollin, 2014)
13q
RB1 RB transcriptional corepressor 1 Loss (Gollin, 2014)
ING1 Inhibitor of growth family, member 1 Loss (Koontongkaew et al., 2000; Pande
et al., 1998)
17p TP53 Tumour protein p53 Loss
(Guo and Califano, 2015; Agrawal
et al., 2011; Stransky et al., 2011; Cancer Genome Atlas, 2015)
18q
GALR1 Galanin receptor 1 Loss (Gollin, 2014)
PARD6G Par-6 family cell polarity regulator
16
1.9.1. Region 3p
Losses of 3p chromosomal region can be detected in 56% to 78% of oral dysplasias and in more than 90 % of OSCC patients. It is suggested that the loss of 3p is related with early stages of OSCC. The loss of this arm results from isochromosome formation or chromosome breakage (Gollin, 2014).
The FHIT (fragile histidine triad) gene, mapped at 3p14 is the most frequent and reported loss at this region, in OSCC. It is reported that loss of the protein coded by FHIT leads to DNA damage, genetic instability and consequently to OSCC development and progression (Gollin, 2014; Ribeiro et al., 2014b). RARβ (retinoic acid receptor, beta) is another gene mapped at this region that has been reported as involved in OSCC carcinogenesis. RARβ encodes for the retinoic acid receptor beta, which participates in embryonic morphogenesis, cell growth and differentiation through binding to retinoic acid. The loss of this gene can induce carcinogenesis by lack of response to retinoids (Table 3) (Ribeiro et al., 2014b).
1.9.2. Region 3q
It is believed that gains in the long arm of chromosome 3 are the most common chromosomal alteration in HNSCC (Gollin, 2014; Ribeiro et al., 2014b).
Gains in this region seem to be involved with overexpression of cancer-related genes such as PIK3CA (phosphatidylinositol-4, 5-bisphosphate 3-kinase, catalytic subunit alpha) and TP63 (tumour protein p63) (Gollin, 2014; Sherr and Roberts, 1999) (Table 3).
The PIK3CA is encoded at 3q26.3 and its increased copy number is identified in numerous cancer cases (Gollin, 2014). Overexpression of this gene leads to uncontrolled cell growth and survival, transformation and drug resistance. This oncogene is mutated in 6% to 29% of HNSCC (Murugan et al., 2008). The amplification of PIK3CA is related with tumour relapse and poor prognosis (Gollin, 2014) (Table 3).
TP63 is mapped at 3q28 and its overexpression and/or its amplification is associated with invasive HSCC and poor survival rates (Rothenberg and Ellisen, 2012; Gollin, 2014).
Snijders et al. (2005) demonstrated that the gene TM4SF1 (transmembrane 4 L six family member 1) at 3q24-25 is amplified in OSCC (Snijders et al., 2005). Moreover, other studies identified MME (membrane metallo-endopeptidase), IL12A (interleukin 12A), DCUN1D1 (DCN1, defective in cullin neddylation 1, domain containing 1) and SOX2 (sex determining region Y-box 2) as genes that
17 have extra copy number in OSCC (Ribeiro et al., 2014b; Martin et al., 2008; Gollin, 2001). In general, it is reported that gains in 3q25-29 are related to poor survival rates (Gollin, 2014).
1.9.3. Region 7p
Gains of 7p region are reported in HNSCC cell lines, specifically 7p12-22 bands. 7p12 mapped for the EGFR gene, which is overexpressed in around 90% of OSCC cases (Gollin, 2001; Gollin, 2014; Martin et al., 2008) (Table 3). The overexpression of EGFR is caused by gene copy number, gene amplification, increased mRNA synthesis, decreased downregulation or expression of EGFRvIII (Gollin, 2014). EGFR is a receptor tyrosine kinase of the ErbB (epidermal growth factor receptor) family of cell surface receptors. After activation by ligand binding, EGFR forms a dimer and activates downstream pathways such as PI3K (phosphoinositide 3-kinase), AKT, JAK/STAT (janus kinase/signal transducer and activator of transcription) and Ras (Table 3). These pathways are involved in proliferation, evasion of apoptosis, invasion, angiogenesis and metastasis (Kalyankrishna and Grandis, 2006). The overexpression of this oncogene is associated with poor prognosis and with increased local recurrence (Guo and Califano, 2015).
1.9.4. Region 8p
Loss of 8p region is detected in 58% of HNSCC, most frequent at 8p21 and 8p22-p23. CSMD1 (CUB and Sushi multiple domains 1 ) is mapped at 8p23 and its expression is abnormal in several HNSCC as a consequence of deletion, epigenetic silencing or aberrant splicing (Table 3) (Gollin, 2014). Other genes, mapped at this region, including GATA4 (GATA binding protein 4), MTUS1 (microtubule associated tumour suppressor 1) and TUSC3 (tumour suppressor candidate 3) are also usually deleted in HNSCC (Ribeiro et al., 2014a; Ribeiro et al., 2014b).
Gains of 8p region have also been detected, particularly at 8p11.2 band. WHSC1L1 (Wolf-Hirschhorn syndrome candidate 1-like 1) is a gene mapped at this band and is overexpressed in several HNSCC (Table 3) (Gollin, 2014).
1.9.5. Region 8q
Studies proved that gains of 8q regions, especially bands 8q23.1-8q24.22, are involved in numerous HNSCC cases. Gains of this arm are essentially due to isochromosome formation (Gollin, 2014). The oncogene MYC (v-myc avian myelocytomatosis viral oncogene homolog) is an important gene mapped at 8q region that is overexpressed in several OSCC, due to gene amplification or copy
18
number gain. MYC overexpression is related with poor prognosis (Table 3) (Gollin, 2014; Ribeiro et al., 2014b). The gene PTK2 (protein tyrosine kinase 2) mapped at 8q24 is another gene that is overexpressed in several HNSCC (Table 3). The overexpression of PTK2 is related with invasiveness (Gollin, 2014). Other genes mapped at 8q as LRP12 (low density lipoprotein receptor-related protein 12) and WNT1 (wingless-type MMTV integration site family, member 1) are also overexpressed in OSCC (Gollin, 2014; Ribeiro et al., 2014b; Ribeiro et al., 2014a).
1.9.6. Region 9p
The short arm of chromosome 9 is lost in a large number of HNSCC. Loss of 9p regions is associated with early stages of the disease (Ribeiro et al., 2014b; Gollin, 2014). Isochromosome formation and deletions of variable sizes are the main causes of 9p losses. At this region, there are important genes that are reported to be lost or mutated in OSCC as PTPRD (protein tyrosine phosphatase, receptor type, D) at 9p23-24 and CDKN2A at 9p21.3 (Table 3). (Gollin, 2014; Ribeiro et al., 2014b).
The protein coded by PTPRD is a tyrosine phosphatase receptor type D that plays important roles in cellular signalling, including in dephosphorylation of STAT3 (signal transducer and activator of transcription 3), inhibiting tumour cell growth. Therefore, PTPRD mutations or deletions can directly lead to tumour growth due to hyperactivation of STAT3.
CDKN2A is a gene that encodes for p16 protein. This protein is important to cell cycle regulation due to its interaction with Rb (retinoblastoma) protein. The p16 inhibits cyclin-dependent kinases (CDK) 4 and 6, facilitating the phosphorylation of Rb (once CDK 4,6 inhibit Rb phosphorylation) (Tan et al., 2013). CDKN2A gene is often altered in HNSCC (9% to 12% of HNSCC cases) (Gollin, 2014). Although loss of heterozygosity of this gene is the most frequent alteration detected in HNSCC, CDKN2A can also be inactivated by point mutations or methylation of the 5’ CpG region (Leemans et al., 2011; Tsantoulis et al., 2007; Guo and Califano, 2015). In oral cancers, loss of p16protein expression were found in more than 83% of cases (Tsantoulis et al., 2007). Studies revealed that loss of p16 in HNSCC patients is related to poor prognosis (Tsantoulis et al., 2007; Park et al., 2007).
1.9.7. Region 9q
At 9q region, specific at 9q34.3, is mapped the NOTCH1 gene that is overexpressed in numerous OSCC cases (Table 3) (Tan et al., 2013). It is reported that NOTCH1 alterations were
19 found in from 14% to 15% of HNSCC, being the second most altered gene in this malignancy (Sun et al., 2014). NOTCH1 plays crucial roles in normal cells differentiation, lineage commitment and embryonic development (Tan et al., 2013). This gene encodes for a protein that is a transmembrane ligand receptor. It is suggested that in HNSCC, NOTCH1 acts as a tumour suppressor gene based in the position and characteristics of NOTCH1 mutations and the inactivation of both alleles. In contrast, it is also suggested that in some oral cancer cases, NOTCH1 may act as an oncogene (Sun et al., 2014; Tan et al., 2013; Guo and Califano, 2015).
1.9.8. Region 11q
The amplification of 11q13 band is the chromosomal alteration more studied of chromosome 11 in HNSCC. The 11q13 amplification is, normally, a result of BFB (breakage-fusion-bridges) cycles initiated by a break at the common chromosomal fragile site FRA11F. It is suggested that this amplification occurs at early stages of the disease, being essential for the transition from moderate to severe dysplasia. Almost all of the 13-14 genes mapped at 11q13 are overexpressed in HNSCC. The gene considered to be the most important of this band is the CCND1 (cyclin D1) oncogene (Table 3), which plays an important role in G1/S transition. Accordingly, overexpression of this gene leads to a faster transition from G1 to S. The overexpression of cyclin D1 is present in 36% to 66% of oral cancer and potentially malignant lesions. The amplification of the CCND1 leads to accumulation of cyclin D1, which is related to a bad prognosis and with increased probability of cervical lymph node metastasis occultation, mainly in low stages tumours. (Gollin, 2001; Gollin, 2014; Martin et al., 2008).
Besides the amplification at this region, loss of the long arm of chromosome 11 has been also detected, distal to 11q13 amplification (Gollin, 2014). It is suggested that in HNSCC, 11q distal losses are the first step in 11q13 amplification process. Distal 11q contains a couple of DNA damage responsive (DDR) genes, including MRE11A (MRE11 homolog A, double strand break repair nuclease) (11q21), ATM (ATM serine/threonine kinase) (11q23.3), H2AFX (H2A histone family, member X) (11q23.3) and CHEK1 (checkpoint kinase 1) (11q24.2) (Gollin, 2014; Gollin, 2001; Martin et al., 2008).
ATM is one of the most important genes involved in DDR. ATM is phosphorylated in responses to DSB (DNA double-strand breaks) caused by ionizing radiation. After ATM phosphorylation, proteins involved in DDR are also phosphorylated leading to cell cycle arrest,
20
apoptosis and DNA repair. Loss of ATM is associated with OSCC development and resistance to RT (Gollin, 2014).
1.9.9. Region 13q
The long arm of chromosome 13 is lost in a large number of HNSCC cases, especially the 13q12.11 and 13q14.2 bands. One gene included in 13q is the RB1 that plays crucial roles in cell cycle control and its loss is associated with development of tumours, including OSCC (Table 3) (Gollin, 2014). RB1 encodes for Rb protein, which, in a hypo-phosphorylated state, binds and inactivates the E2F transcription factor. This transcription factor is responsible for cell cycle progression from G to S phase (Tsantoulis et al., 2007). A study developed by Soni et al. showed that around 90% of OSCC cases and 84% of potentially malignant lesions exhibits altered expression of one or more compounds of Rb network (Soni et al., 2005). Studies revealed that absence of phosphorylated Rb (pRb) expression was about 70% in oral cancers and 64% in potentially malignant lesions (Koontongkaew et al., 2000; Pande et al., 1998).
ING1 (inhibitor of growth family, member 1) is mapped at 13q.34 and it is suggested that mutations on this gene leads to uncontrolled cell growth that may be associated with tumour development, including OSCC (Table3) (Szyfter et al., 2014).
1.9.10. Region 17p
Loss of 17p13 region is the chromosomal alteration more relevant of chromosome 17 since the tumour suppressor gene TP53 is mapped at this region (17p13.1). TP53 encodes for p53 protein, which is considered the “guardian of the genome” (Lane, 1992). This protein accumulates in response to DNA damage as well as to other stress factors. p53 accumulation leads to cell cycle arrest or apoptosis, depending on whether the DNA damages are repaired or not (Guo and Califano, 2015). The TP53 is the most frequently altered gene in HNSCC as well as in potentially malignant lesions (Agrawal et al., 2011; Stransky et al., 2011; Cancer Genome Atlas, 2015). In HNSCC, the TP53 alterations more frequent are missense mutations (50% to 60%). Missense mutations in TP53 can have two consequences: a stable protein that loses its key binding ability or a protein that acts as a dominant negative inactivating the wild-type TP53 (Guo and Califano, 2015). Studies revealed that TP53 mutations are related to poor prognosis, decreased rates of survival and increased risk of locoregional recurrence (Guo and Califano, 2015; Tan et al., 2013). Furthermore, mutations in this
21 gene are also related to resistance to therapies as cisplatin, fluorouracil and RT (Table 3) (Tan et al., 2013).
1.9.11. Region 18q
Loss of 18q is common in HNSCC, especially loss of 18q23. This event is related to advanced stages of tumour and poor prognosis. Two of the 18 genes affected by the loss of this arm are GALR1 (galanin receptor 1) and PARD6G (par-6 family cell polarity regulator gamma) (Table 3). GALR1 mapped at 18q23 is lost in HNSCC as a result of promoter methylation. GALR1 encoded to a G-protein coupled receptor that is important to inhibit proliferation in keratinocytes through the inactivation of the MAPK (mitogen-activated protein kinases) pathway (Gollin, 2014).
It is demonstrated that PARD6G deletions affect ciliogenesis, interphase and spindle microtubule organization and it also leads to defects in the centrosome organization and function (Gollin, 2014).
1.10. Epigenetic alterations
Epigenetics is described as mitotically and/or meiotically heritable changes in gene expression without alterations in DNA sequence (Jones and Baylin, 2007). This kind of alterations are important in many physiological processes as differentiation, embryogenesis, genomic imprinting and chromosomal domains inactivation.
As in many other biological processes, epigenetic mechanisms can be dysregulated. Epigenetic abnormalities are relevant in some diseases, including cancer (Taby and Issa, 2010; Jones and Baylin, 2007).
Epigenetic changes include three main mechanisms: DNA methylation, histone modification and microRNA or interfering RNA expression (Taby and Issa, 2010).
1.10.1. DNA methylation
DNA methylation is a covalent modification that consists in the addition of a methyl group to the carbon 5 of a cytosine at CpG islands. This reaction is catalysed by DNA methyltransferases (DNMTs) (Das and Singal, 2004). DNA methylation represents the most frequent and best characterized epigenetic event in carcinogenesis, including in oral cancer (Noorlag et al., 2014).
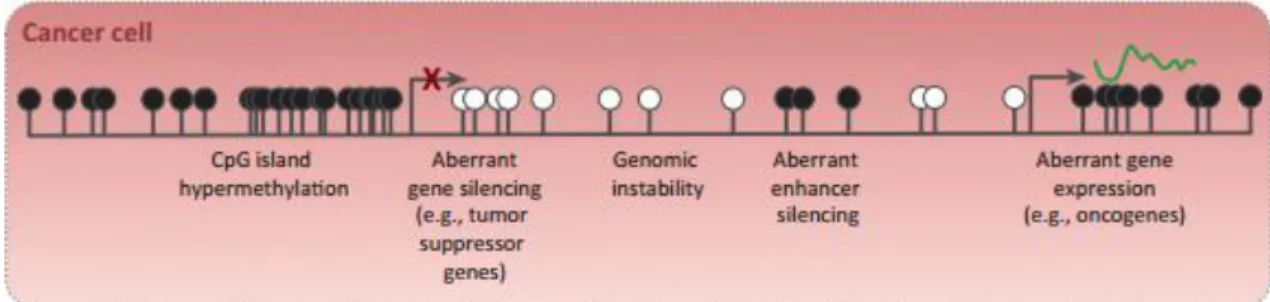
This epigenetic event can affect gene expression though TSGs hypermethylation, genome hypomethylation or direct mutagenesis (Stirzaker et al., 2014) (Figure 5).
22
Figure 5- DNA methylation in cancer. CpG islands hypermethylated, resultant in gene silencing and
hypomethylation of CpG-poor oncogene promoters, resultant in genomic instability and abnormal gene
expression. (Black circle - methylated CpG; White circle - unmethylated CpG). (Adapted from Stirzaker et al.,
2014).
Promoter hypermethylation of TSGs is considered the main mechanism involved in carcinogenesis. Although DNA sequence is maintained, promoter hypermethylation leads to a closed chromatin configuration and, consequently, TSGs silencing. (Ha and Califano, 2006; Noorlag et al., 2014).
Promoter hypermethylation of TSGs has been widely studied in OSCC, allowing the knowledge of several genes that are hypermethylated in this malignancy. Some of these genes are represented in Table 4.
Epigenetic changes, particularly, DNA methylation are early events in the carcinogenesis process, being responsible for tumour initiation and progression and, consequently, predisposing cells to accumulation of genetic abnormalities (Taby and Issa, 2010). Therefore, it is important to identify epigenetic alterations in order to find biomarkers that can be used not only to detect OSCC in early stages, but also to assess the disease’s progression (Li et al., 2015).
Contrary to genetic alterations, DNA methylation is reversible. This fact represents an attractive target for developing new therapeutic approaches using DNMT inhibitors that can reactivate the transcription of methylated TSGs (Noorlag et al., 2014)
23
Table 4- Frequent hypermethylated genes in OSCC.
GENE GENE NAME LOCATION FUNCTION REFERENCES
APC Adenomatous Polyposis Coli 5q21-q22 Tumour Suppression (Noorlag et al., 2014)
CDH1 Cadherin 1 16p22.1 Cell adhesion 2004; Arantes(Kulkarni and Saranath, et al., 2015)
CDH13 Cadherin 13 16q23.3 Cell adhesion (Noorlag et al., 2014)
CDKN2A Cyclin-Dependent Kinase
Inhibitor 2A 9p21.3 Tumour Suppression
(Maruya et al., 2004; Noorlag et al., 2014; Arantes et al., 2015; Sanchez-Cespedes et al., 2000) CDKN2B Cyclin-Dependent Kinase
Inhibitor 2B 9p21 Tumour Suppression (Noorlag et al., 2014)
CHFR Checkpoint with Forkhead and Ring finger domains 12q24.33 Mitotic Checkpoint (Noorlag et al., 2014)
DAPK Death-Associated Protein Kinase 1 9q34.1 Apoptosis
(Maruya et al., 2004;
Noorlag et al., 2014;
Arantes et al., 2015;
Sanchez-Cespedes et al.,
2000)
ESR1 Estrogen Receptor 1 6q24-q27
Activation of transcription; Metastasis-suppressor
properties
(Noorlag et al., 2014)
FHIT Fragile Histidine Triad 3p14.2 Tumour Suppressor (Chang et al.al., 2015) , 2002; Lin et
GSTP1 Glutathione S-Transferase Pi 1 11q13.2 Protection against DNA damage caused by glutathione
(Sanchez-Cespedes et al.,
2000)
MGMT O-6-methylguanine-DNA methyltransferase 10q26 DNA Repair Sanchez-Cespedes(Maruya et al., 2004; et al., 2000)
MLH1 mutL homolog 1 3p21.3 DNA repair (Arantes et al., 2015)
RARβ Retinoic Acid Receptor, beta 3p24 Tumour Suppression (MaruyaNoorlag et al. et al., 2014) , 2004;