CUIDADO É FUNDAMENTAL
UNIVERSIDADE FEDERALDO ESTADODO RIODE JANEIRO. ESCOLADE ENFERMAGEM ALFREDO PINTO
R E V I S T A O N L I N E D E P E S Q U I S A
PESQUISA
CUIDADO É FUNDAMENTAL
UNIVERSIDADE FEDERALDO ESTADODO RIODE JANEIRO. ESCOLADE ENFERMAGEM ALFREDO PINTO
DOI: 10.9789/2175-5361.2017.v9i4.962-970
DOI: 10.9789/2175-5361.2017.v9i4.962-970 | Silva KG; Freitas BA; Furgêncio GK; et al. | Relationship between the quality of life and food consumption...
Relationship between the quality of life and food consumption of
teachers from private network
Relação entre a qualidade de vida e o consumo alimentar de professores
de rede privada
Relación entre calidad de vida y consumo de alimentos de profesores de la
red privada
Keliane Galdino da Silva1, Bruna Andrade de Freitas2, Gislene Kauffmann Furgêncio3, Leslie Andrews Portes4, Nyvian Alexandre Kutz5, Marcia Maria Hernandes de Abreu de Oliveira Salgueiro6
How to quote this article:
Silva KG, Freitas BA, Furgêncio GK, Portes LA, Kutz NA, Salgueiro MMHAO. Relationship between the quality of life and food consumption of teachers from private network. Rev Fun Care Online. 2017 out/dez; 9(4):962-970. DOI: http://dx.doi.org/10.9789/2175-5361.2017.v9i4.962-970
ABSTRACT
Objective: To relate the quality of life (QOL) and food consumption (FC) of teachers from private network.
Methods: Cross-sectional study that evaluated QOL, FC and economic classes. Results: Regarding the QOL of
107 teachers, 64.5% were classified as good and 19.6% very good, 70.1% belongs to the class C and 64.5% showed satisfactory FC. The feed scores (FS) were significantly correlated with the QOL, physical, psychological, social and environmental domains, and with overall QOL. The higher the FS, the better the physical, psychological and environmental domains. Conclusion: The higher FS, the better QOL of teachers. Thus, a healthy diet can contribute to health promotion, reflecting in a better QOL.
Descriptors: Health promotion; quality of life; food habits; teaching staff.
RESUMO
Objetivo: Relacionar a qualidade de vida e o consumo alimentar de professores de rede privada. Métodos: Estudo transversal que avaliou
a qualidade de vida, o consumo alimentar e a classe econômica. Resultados: Em relação à qualidade de vida dos 107 professores, 64,5% foram classificados como boa e 19,6% como muito boa, 70,1% pertencem à classe C e 64,5% mostraram consumo alimentar satisfatório. Os escores de alimentação correlacionaram-se significantemente com os domínios da qualidade de vida, físico, psicológico, social e ambiental, e com a qualidade de vida geral. Quanto maior o escore de alimentação nos quartis, melhor os domínios físico, psicológico e ambiental.
1 Postgraduate student in Outpatient Clinical Nutrition at Adventist University Center of São Paulo – UNASP. E-mail: [email protected] 2 Postgraduate student in Outpatient Clinical Nutrition at Adventist University Center of São Paulo – UNASP. E-mail: b.freitas@
hotmail.com
3 Masters student in Health Promotion at University Center of São Paulo - UNASP. E-mail: [email protected]
4 Professor of Master in Health Promotion and under graduation in Physical Education at University Center of São Paulo – UNASP.
E-mail: [email protected]
5 Masters student in Applied Human Nutrition from the University of São Paulo – USP. E-mail: [email protected]
6 Professor of Master in Health Promotion and under graduation in Physical Education at University Center of São Paulo – UNASP. –
Conclusão: Quanto maior o escore de alimentação, melhor a qualidade de vida dos professores. Assim, a alimentação saudável pode contribuir com a promoção da saúde, refletindo em melhor qualidade de vida.
Descritores: Promoção da saúde, Qualidade de vida, Hábitos alimentares,
Docentes.
RESUMEN
Objetivo: relacionar la calidad de vida (CV) y el consumo de alimentos (CA)
de la red privada de los maestros. Métodos: Estudio transversal que evaluó la CV, CA y clase económica. Resultados: En cuanto a la CV de 107 profesores, el 64,5% se clasificaron como buena y el 19,6% muy buena, el 70,1% pertenece a la clase C y 64,5% mostró CA satisfactoria. Las puntuaciones de la alimentación (PA) se correlacionaron significativamente con los ámbitos de la CV, físico, psicológico, social y ambiental, con la calidad de vida en general. Cuanto mayor sea la PA la mejor cuartiles los dominios físicos, psicológicos y ambientales. Conclusión: Cuanto mayores sean las PA de los maestros, mejor la CV. Por lo tanto, una dieta saludable puede contribuir a la promoción de la salud refleja una mejor calidad de vida.
Descriptores: Promoción de la salud, Calidad de vida, Hábitos
alimenticios, Los maestros.
INTRODUCTION
Quality of life (QOL), elaborated by the World Health Organization (WHO) as the individual’s perception of their position in life in the context of culture and value systems in which they live, and in relation to their goals, expectations, standards and concerns, has been a subject much discussed today. Thus, QOL is addressed in a subjective and multidimensional way, and includes both positive and negative aspects1.
Given that the health condition of teachers is linked to their working conditions, the latter can contribute or not to a favorable quality of life. The relationship between health and work has been investigated due to the mutual influence between them. Grievances related to the health of teachers have been identified, increasingly associated with working conditions. These professionals perceived that the benefits of career are below the level of relevance and demands of the profession. Dissatisfaction with working conditions is reflected in the decrease of their health. In addition, social support at school seems to make the most favorable environmental conditions to work2.
In this context, Santos and Marques3 showed that most
teachers assessed their health condition as good. However, despite the positive data, unfavorable aspects were found in the lifestyle of these teachers, showing a difficulty in the perception of teachers related to the perception of general health.
Studies that evaluate factors related to the working conditions of primary school teachers and their contribution to the risk of Chronic Noncommunicable Diseases (CNCDs), such as overweight and obesity, since teachers, in general, perform physical tasks of low intensity, are still unknown, therefore they are classified as sedentary. However, it is known that these factors will, in time, interfere with the ability to work, damaging the quality of life and professional performance. This is shown by the high prevalence of poor eating habits, alcohol consumption and physical inactivity observed among teachers4.
The inclusion of women in the labor market encouraged the production of pre-prepared foods, since she did not have enough time to cook for the family anymore. According to the study in the urban center, the profession exercised outside the home was seen positively by women, while household chores, such as cooking, were seen as less important activities, and because of that, the practical and traditional knowledge of the production process of food in the home was lost. At the present time, the reserved cooking time depends on to whom it is intended to prepare, this time is more valuable when the food preparations are intended for the family and less important when consumption is just for yourself5.
The dietary pattern is one of the risk or protective factors for CNCDs 6. Among the risk factors for CNCDs,
there are: insufficient physical activity, smoking, excessive alcohol consumption, inadequate consumption of fruit and vegetables, overweight and obesity, altered levels of blood pressure and hyperglycemia. Thus, a dietary pattern with prevalence of risk factors for CNCDs can affect the quality of life.
Thus, the quality of life is converted into a complex general indicator, which seeks to estimate the ability to have or establish a life with decent conditions 7.
Therefore, the objective was to relate the quality of life and the teachers’ food consumption of a private educational network from the south side of São Paulo.
METHOD
This is a descriptive cross-sectional study with a quantitative approach, carried out in January 2015. The study was approved by the Research Ethics Committee of the University Center of São Paulo under Protocol number 827 482 on 09.10.2014 and by the Regional Coordination of the private educational network of São Paulo.
400 primary school teachers, of both sexes, were invited during an educational meeting. The sample consisted of 116 teachers who agreed to participate, distributed in 13 schools. They excluded 9 individuals who did not fully complete the questionnaire.
A suitable place for the collection of data was made available, ensuring the privacy of the participants.
The instrument used for data collection was composed of two self-applicable questionnaires, the first addressing the socio-demographic aspects, in which the work variables are included, and the second covering health aspects (quality of life and food consumption). The evaluation of the data was performed according to the guidelines of the authors.
The sociodemographic variables were age (years), gender (male or female), marital status (married, single, widowed, separated or divorced) and economy class. The information collected for the economic classification was related to education and the presence of consumer goods in the household. Data were analyzed according to the Brazilian Criteria for Economic Classification, which assigns points for each item according to your home feature, classifying economic classes as A1, A2, B1, B2, C1, C2, D and E8. The work-related aspects were: educational level,
teaching experience, hours per week, number of shifts and schools. And health variables were: quality of life and food consumption.
The perception of quality of life was assessed by the WHOQOL-BREF questionnaire, instrument used to quantitatively measure the quality of life. This is a dependent variable on subjective nature, since it is based on the perception of people about various aspects of their lives. The WHOQOL, developed by a multi-center research organized by the WHO Quality of Life Group, resulted in the long version of the instrument adapted and validated in Brazil by researchers at the Federal University of Rio Grande do Sul. The translation into Portuguese was made by retro translation and the average and standard deviation of the words were estimated to obtain the most related to the original version in English9.
Aiming to facilitate the application in the face of large samples, a more synthetic instrument was drawn, the WHOQOL-100, which was the first instrument created by the multi-center study, consisting of 100 questions. For the construction of the WHOQOL-BREF, the short version of the larger survey, the items of the long version were selected according to scope and psychometric performance that were later examined by a panel of experts as to their representative capacity and conceptual relevance and psychometric. The data that originated the instrument were extracted from field tests of 20 centers and 18 countries. The WHOQOL-BREF has strong correlations with the original test (Brazilian WHOQOL-100) and the short version of the multi-center study9.
In the validation process in Brazil, the Portuguese version was applied in a field test with the same criteria and composition of the sample, which evaluated its psychometric properties. The authors demonstrated in this study that the WHOQOL-BREF, in its application in Brazil, showed good internal consistency. WHOQOL-BREF has discriminant validity (expect for Social Affairs field), competitors (significant correlation coefficients between themselves and in relation to the BHS and BDI inventories) and satisfaction criterion, in which, except for Social Affairs, the other domains were part of model using multiple linear regression and explained 44% of the variance9.
The short version has 26 questions in total, with 5 response options: 24 facets (one question for each facet) about 4 life domains: physical, psychological, social affairs and environment; and 2 separate questions of a more general character, which directly question the assessment of quality of life and personal satisfaction with health status. Another QOL measurement component is the measure of quality of life in general, obtained by averaging the scores in the first four domains. It uses scores of 0 to 100, positive and reverse, and Likert scale of four types: intensity, capacity, frequency and evaluation. It is self-explanatory and refers to the last two weeks9.
The physical domain addresses issues such as the presence of impeding physical pain, need for medical treatment, being able to work and to perform everyday tasks, enough energy to such functionality, autonomy and sleep. The psychological domain takes into account aspects
related to the meaning of life, the emotional dimension, mnemic capacity and concentration, satisfaction with itself, the presence of positive and negative feelings, and spirituality. Social Affairs consider satisfaction with the personal relationships, sex life and support of friends. Environment domain addresses safety, health, physical environment, information available, financial resources, leisure activity opportunities, satisfaction with the conditions of the place of residence, with access to health services and means of transport9.
Dietary intake was assessed by the questionnaire “How’s your food?”, developed and validated by the Ministry of Health to analyze the quality of the diet of population groups. This consists of 18 multiple-choice questions, with aspects related to food consumption. The questionnaire was applied and evaluated according to guidelines of the authors10. Thus, for the
assessment of food consumption, a specific score is assigned (0-4), referring to the answer of each question. The total score revealed if the individual needed to review, pay attention or continue their eating habits as track points established by the Ministry of Health. As the Ministry of Health does not rate the food intake as adequate or inadequate, it was adopted the standard classification used by food Franzoni et al.11, which
considers unsatisfactory - up to 28 points; satisfactory - 29-42 points; or great - above 43 points.
The results were submitted to the Pearson correlation test and one-way ANOVA test comparing the groups of lower food scores with higher scores. Differences were considered significant at the level of p <0.05. After analyzing the data, participants received an individual written feedback to the classification of their nutritional status and general quality of life.
RESULTS AND DISCUSSION
It were evaluated 107 teachers from 13 schools, aged between 23 and 58 years (38.1 ± 8.7 years), 83 females (78%) and 24 male (22%).
Regarding quality of life, 16% of teachers were classified as low or regular, with 64% being good and 20% very good.
As for the economic classification, the majority (70.1%) of teachers belongs to theclass C (Figure 1).
Figure 1 – Distribution of teachers of private schools according
to economic class. São Paulo, 2015.
10 20 30 40 50 60 70 80 0 B C D e E Economic class P er c entage Source: Authors
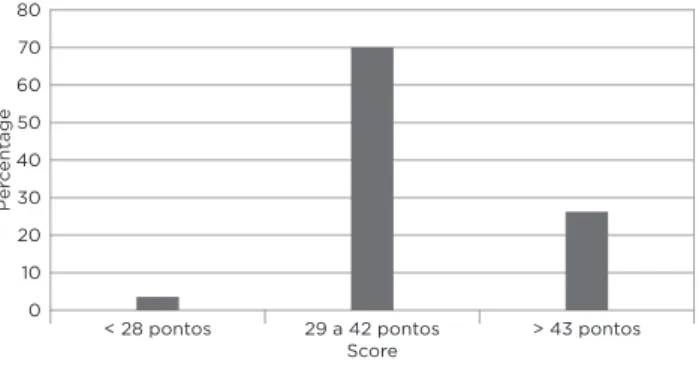
According to the score of the questionnaire “How’s your food?”10, only 3.7% of teachers had unsatisfactory food
consumption, while most showed satisfactory (70.1%) and good (26.2%) consumption (Figure 2).
Figure 2 – Distribution of food consumption of private school
teachers according to the score of the questionnaire “How’s your food?”. São Paulo, 2015.
10 20 30 40 50 60 70 80 0
< 28 pontos 29 a 42 pontos > 43 pontos
Score P er c entage Source: Authors
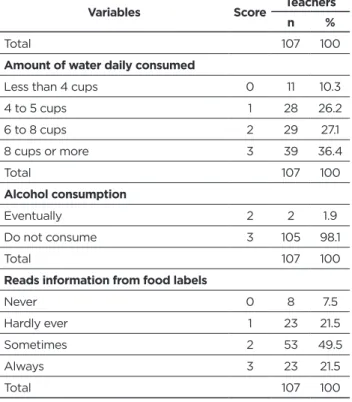
Evaluating the results of eating habits in Table 1, it was observed that 7.5% (n = 8) of teachers reported not to eat fruits or fruit juice daily, 24.3% (n = 26) consume a fruit,35, 5% (n = 38) consume two and 32.7% (n = 35) consume the amount of fruit recommended by the Food Guide for the Brazilian Population12.
Table 1 – Characterization of the sample according to eating
habits of private schools teachers . São Paulo, 2015.
Variables Score Teachers
n %
Amount of consumed fruits/day
I do not eat every day 0 8 7.5
One unit 1 26 24.3
Two units 2 38 35.5
Three units or more 3 35 32.7
Total 107 100
Amount of vegetables consumed/day
I do not eat every day 0 12 11.2 3 tablespoons or less 1 37 34.6 4-5 tablespoons 2 36 33.6 6 to 7 tablespoons 3 12 11.2 8 or more tablespoons 4 10 9.3
Total 107 100
Number of legumes and beans consumed/day
Do not consume 0 3 2.8
I consume less than 5 times/week 1 24 22.4 1 tablespoon or less/day 2 14 13.1 2 or more tablespoons/day 3 66 61.7
Total 107 100
Average consumption of servings of grain / day
Zero servings 0 1 0.9
From 1 to 2.9 servings 1 52 48.6 From 3 to 4.4 servings 2 37 34.6 From 4.5 to 7.5 servings 3 16 15.0
Variables Score Teachers
n %
More than 7.5 servings 4 1 0.9
Total 107 100
Quantity of meat (beef, poultry, pork, fish and other) / day
Do not consume any meat 1 14 13.1 1 piece of meat or 1 egg 2 57 53.3 2 pieces of meat or eggs 2 3 31 29.0 More than 2 pieces of meat or + 2eggs 0 5 4.7
Total 107 100
Usually removes visible fat from meat
No 0 7 6.5
Do not consume any meat 2 13 12.1
Yes 3 87 81.3
Total 107 100
Frequency of fish consumption
Do not consume 0 11 10,3
Only a few times a year 1 52 48,6 1 to 4 times/month 2 30 28,0 Two or more times/week 3 14 13,1
Total 107 100
Consumption of milk and derivatives/day
Do not consume 0 8 7.5
1 or less cups of milk or pieces/slices/
portions 1 55 51.4
2 cups of milk or pieces/slices/portions 2 22 20.6 3 or more cups of milk or pieces/slices/
portions 3 22 20.6
Total 107 100
Consumption of fried food, snacks, sausages
Every day 0 2 1.9
From 4 to 5 times/week 1 4 3.7 From 2 to 3 times/week 2 25 23.4 Less than 2 times/week 3 24 22.4 Rarely or never 4 52 48.6
Total 107 100
Candy consumption frequency
Every day 0 5 4.7
From 4 to 5 times/week 1 11 10.3 From 2 to 3 times/week 2 24 22.4 Less than 2 times/week 3 32 29.9 Rarely or never 4 35 32.7
Total 107 100
Type of fat used for cooking
Animal lard or butter 0 1 0.9 Margarine or vegetable fat 0 3 2.8 Vegetable oil (soy, rapeseed, etc.) 3 103 96.3
Total 107 100
Adds more salt to food after it is ready
Yes 0 10 9.3
Variables Score Teachers
n %
Total 107 100
Amount of water daily consumed
Less than 4 cups 0 11 10.3
4 to 5 cups 1 28 26.2 6 to 8 cups 2 29 27.1 8 cups or more 3 39 36.4 Total 107 100 Alcohol consumption Eventually 2 2 1.9 Do not consume 3 105 98.1 Total 107 100
Reads information from food labels
Never 0 8 7.5 Hardly ever 1 23 21.5 Sometimes 2 53 49.5 Always 3 23 21.5 Total 107 100 Source: Authors
Regarding the general consumption of teachers, it is important to note that 7.5% do not consume fruit every day, 11.2% do not eat vegetables every day, 15.9% consume less than 1 tablespoon of bean soup a day or do not consume, 6.5% do not remove the visible fat from meat, 9.3% add salt to preparations after it’s ready and 10.3% consume less than 4 cups of water a day. About the habit of reading the information on food labels, 29% answered not reading it or hardly ever read.
Regarding the habit of daily meals (breakfast, morning snack, lunch, afternoon snack or coffee, dinner or evening coffee and snack before bedtime), 76.6% have breakfast, 48.6% the morning snack, 93.5% lunch, 47.7% the afternoon snack, 78.5% make dinner, and 20.6% make supper.
The evaluation of the sample and the practice of physical activity can be seen in Table 2, in which 48.6% do not exercise.
Table 2 – Characterization of the sample according to the
physical activity of private schools teachers - São Paulo - 2015.
Variables Score Teachers
n %
Practice physical activity
No 0 52 48.6
From 2 to 4 times/week 2 25 23.4
Yes 3 30 28.0
Total 107 100.0
Source: Authors
The food scores were significantly correlated with the domains of QOL and overall QOL: physical (r = 0.22, p = 0.024), psychological (r = 0.29, p = 0.003), social (r = 0, 20, p = 0.042), environment (r = 0.28, p = 0.004) and overall (r
= 0.30, p = 0.002), indicating a weak correlation. Regarding food quartiles (Figures 1 and 2), the greater the food score, the better the physical (p = 0.049), psychological (p = 0.011) and environmental (p = 0.029) domains, but not for the social domain (p = 0.225). These domains grouped resulted in a better overall QOL due to food quality (p = 0.009).
This study shows the predominance of the female audience as primary school teachers. It is observed that the woman was joining the primary school teaching and turning this occupation into a predominantly female profession, in São Paulo, since the mid-twentieth century13. In a
comparative study on the male teacher working in primary public school in Rio de Janeiro - Brazil and in Aveiro - Portugal, it was noted that the percentage of female primary teachers is very high and male, very low. However, man can choose this activity by taste and succeed14. Another study
shows that the teacher’s job is different from the worker’s gender, to the extent that men enter the teaching profession by public tender and women go through teacher’s contracts of experience to work in public or private schools in lower series/steps that could act15.
In this sample, the majority of teachers were classified as good and very good QOL. According Meira et al.16, teachers
need assistance for their health and family with public policies aimed at disease prevention. They consider that the teaching profession has a high demand, coupled with discipline in the classroom and professional devaluation, contributing to the emergence of musculoskeletal and emotional disorders. Multiple factors of work and living habits have repercussions on teaching health, interfering with their QOL.
Pereira et al.17, in a study of teachers of public schools,
revealed that teachers with higher weekly working hours and those of the state schools had lower QOL levels in all investigated areas. In another study by Pereira et al.2, when
analyzing some associations between the perception of working conditions (perceived physical environment, social environment, development and professional fulfilment, remuneration, benefits and social relevance of the work) and the QOL of basic education teachers in Florianópolis, through WHOQOL-BREF showed that the dimensions of remuneration, benefits and physical environment displayed greater dissatisfaction. More than half of teachers were dissatisfied with ergonomic issues of furniture and equipment, and the conditions of noise and temperature; 52.8% always/often had mental exhaustion and 50.1% stated they had difficulties with aggressive students. The environmental profile and working conditions explained 24.6% of the QOL assessment of the environmental domain. Perhaps the teachers of private educational system of the present study do not present as many difficulties as the public network, since the vast majority reported good and very good QOL.
As for the economic status of teachers, it is observed that the majority belongs to class C. This finding differs from the study in the municipality of Bage (RS), which found the majority of teachers (70%) belonging to the economic class B3.
With regard to food consumption, data from this study show low consumption of fruits and vegetables compared to the amounts recommended by the Food Guide for the Brazilian Population which recommends, respectively, 3 servings of fruits/day and 3 servings of vegetable/day12.
The study of Santos and Marques3 corroborates the results
found, as 79.6% of the teachers ate less than three servings of fruits and vegetables per day. Similar findings in relation to the consumption of fruit were observed by Gallina et al.18 in a survey conducted in 27 urban public schools
in Chapecó (SC) with 79 teachers in the early grades of elementary school using the questionnaire “How’s your food?”, since there was low intake of fruit among the evaluated teachers. However, unlike our findings, it was found that the most teachers consumed appropriate amount of vegetables groups.
The result of the Surveillance of Risk Factors and Protection against Chronic Diseases through Phone Inquiries (VIGITEL) of the Ministry of Health, held in 201419, pointed out that 24.1% of the population consumes
the recommended fruit and vegetables according to the Food Guide for the Brazilian Population 12.
Regarding the consumption of beans and vegetables, most teachers studied had adequate intake, unlike Gallina et al.18 who found that the dietary habits and practices of
teachers had low intake of legumes.
Beans are the principal source of vegetable protein in the Brazilian food 12 and, like all other legumes, beans are sources
of protein, fiber, B vitamins and minerals such as iron, zinc and calcium. The high fiber content and considerable amount of calories per gram give such food a high satiety power, which avoids eating more than necessary20.
In this study it was found that teachers have food consumption of cereals, roots, tubers and pasta well below the recommended. The Food Guide for the Brazilian Population recommended, as an appropriate amount for a healthy adult, the daily consumption of 6 servings of cereals, tubers and roots. The document also points out that the consumption of foods rich in complex carbohydrates (starches), such as cereals, should be, preferably, whole grains12.
Regarding the consumption of meat and eggs, most consume the recommended daily amount 12, and
approximately 1/3 of the sample consumes more than is recommended. Similar data was found by Gallina et al.18,
who noted that 59.5% of teachers consume a lot of meat or eggs per day and 38% consume at least two servings of this group daily. Data from this study on the consumption of meat and eggs are compatible with the Brazilian dietary pattern shown by Levy et al21.
Especially in this study population, the prevalence of more than 10% of non-meat consumption than recommended12
and in relation to the Brazilian food standard 20 are possibly
explained by the diet advocated by the religious belief in common for the sample, which recommends, as the principles of healthy life, to avoid the consumption of meat (beef, chicken and fish), coffee, black tea and other beverages containing caffeine, refined foods and chili22.
The majority of the teachers prefer to remove the visible fat from meat and skin from chicken. Disposal of visible fat from meat before preparation is key to reducing the amount of saturated fat and cholesterol meal. Excessive consumption of saturated fat is related to several chronic non-communicable diseases (cardiovascular diseases, diabetes, obesity, strokes and cancer)12. The main dietary sources of
saturated fat are egg yolk, milk and dairy products, beef, poultry skin and viscera 20. The VIGITEL survey conducted
in 2013 showed that about one third of the adult population of the 26 Brazilian states and the Federal District declared to have the habit of consuming fatty meat, and this condition is nearly twice as common among men (41.2%) than among women (22.2%). The habit of consuming meat with excess fat (without removing the visible fat) is used as an indicator of consumption of foods considered unhealthy patterns of markers feed6.
A minority consumes fish 2 or more times/week. The results obtained in this study on fish consumption (Table 1) keep up with the low consumption of this food profile in the country, compared to the recommendation of the World Health Organization (WHO), which is 12kg/person/year23.
Among the protein foods, in the sample under study, there is a low consumption of milk by the adult population, as 70.4% (n = 85) does not consume the amount of 3 servings recommended by the Brazilian food guide12.
This result is consistent with the study of Gallina et al.18,
in which the majority of teachers (86%, n = 68) exhibited inadequate consumption of dairy products. Furthermore, in Brazil, there is an apparent downward trend in the milk consumption, especially relevant when considering that osteoporosis is a major health problem, and the food from the milk group and derivatives are the main sources of calcium from food12.
Regarding the type of milk consumed, there is a predominance of consumption for the whole-type milk. As in the present study the economic class C prevails, probably because of that this sample consumes more whole milk because of the best price offer. VIGITEL data show that the frequency of adults who reported the habit of consuming whole milk was high in all the cities studied6.
Data from this study indicate adequate prevalence of consumption of fried food, salty snacks and meat (71%, n = 76) and sweets, cookies, soft drinks and processed juices (62.6%, n = 67). However, it is worrisome the proportions of those who have inadequate intake of fried foods, salty snacks and meat (29%, n = 31) and sweets, cookies, soft drinks and processed juices (37.4%, n = 40), as, for students, teachers usually assume a role model position. The study Gallina et al.18 confirms the data found, in which 39.3% of the sample
consumes fried foods and chips at least 2x/week.
According to Gallina et al. 18, it is considered as adequate
the sporadic or absent consumption of less healthy foods and as inadequate, the regular consumption (two or more times per week).
The data from the Family Budget Research (FBR) of 2002/2003 and 2008/2009, when evaluating the characteristics of product consumption that use sugar in
their composition, show the occurrence of a substantial increase in the consumption of sugar in the form of industrialized products between the periods24,25.The study
of Rombaldi et al.26 revealed that about one third of the
adult population (32.7%) regularly consumed high-fat diet. Regular consumption of fat, in both genders, was associated with younger age and regular consumption of soft drinks. The frequency of regular consumption of high-fat foods in the adult population in the municipality of Pelotas is beyond the current recommendations of the Ministry of Health.
Currently, among the leading causes of death in the world and in Brazil, there are the non-communicable diseases (NCDs). According to WHO, poor eating habits, among other factors, have been associated with NCDs, such as cardiovascular disease, diabetes mellitus, obesity and some cancers. The dietary pattern of the population has been marked by changes characterized by increased intake of foods with high energy density, high in saturated fat, trans fat and simple sugars, and low in fiber, associated with physical inactivity, and excessive alcohol consumption, which they have been identified as independent predictors of these diseases27. FBR
2008-2009 confirms these findings, it found a prevalence of 50% overweight in the adult Brazilian population and low consumption of foods rich in fiber such as fruits, vegetables and legumes and elevated consumption of foods high in saturated fat, sugar and salt25. Recent data
shows that less than 1/4 of the population satisfy the recommended intake of fruits and vegetables, reflecting the low quality of Brazilian diet. These findings are very important when you consider that the NCDs such as obesity have increased their risk by inadequate intake of these foods28.
WHO has published a guideline, “Guideline: Sugars
intake for adults and children”, recommending that adults and
children reduce daily sugar consumption. Sugar intake should not exceed 50 grams per day. This guideline also progresses with the plan to reduce the use of sugar in processed products. The guide was based on several studies of children and adults that found an association of frequent consumption of sugary drinks with excess weight and metabolic changes that favor the development of chronic diseases. In both adults and children, free sugars intake should be reduced to less than 10% of the total energy consumption. A further reduction to less than 5% of total energy consumption would provide additional health benefits29.
Regarding the type of fat used to cook the food, most people reported using vegetable oil for food preparation at home. The Food Guide for the Brazilian Population recommends 12 the use of small amounts of vegetable oil
in food preparation and to give preference to preparation methods that use small amounts of oil, such as roasts, casseroles, stews, grilled, avoiding fried food.
Most teachers responded not to have the habit to add more salt to the food that is ready. The recommendation for the Brazilian population is that salt intake should be no more than 5 g/day (one teaspoon per person), which is
an amount to meet the iodine requirements. In the chapter ‘guidance to the family’, there is the indication to reduce the amount of salt in food preparation and avoid the use of the salt shaker to the table12. Although the majority of
this sample does not have the habit of adding salt to ready preparations, and this is favorable, the instrument does not assess the amount of sodium chloride consumed daily, making it impossible to classify salt intake as appropriate or inappropriate.
When asked about the consumption of water per day, most answered to perform adequate intake of water, whose recommendation is the consumption of 6 to 8 glasses of water a day 12.
With regard to alcohol consumption, almost the entire sample has revealed the habit of not consuming them. This finding probably is because the sample belongs to a religious group which has as one of the principles of alcohol abstention22. A result very different than the one found
by Santos and Marques3, in which only 38% of teachers
had abstained from alcohol consumption in the last year. Excessive consumption of alcohol in combination with a food habit characterized by eating high-calorie foods has been an independent predictor of risk for NCDs27.
About the habit of reading the information on food labels, less than ¼ said that they always read. This shows that most teachers do not have the habit of often reading the food label. The Food Guide for the Brazilian Population appreciates the information on food labels as an essential tool for the selection of healthier foods, clarifying its content and guiding its proper use for that purpose12.
Regarding the habit of daily meals (breakfast, morning snack, lunch, afternoon snack or coffee, dinner or evening coffee and snack before bedtime or dinner), most have three main meals, breakfast, lunch and dinner. Findings of Santos and Marques3 show that the majority (79.1%) of teachers
have three or more meals a day. The Food Guide for the Brazilian Population recommends having three main meals a day, breakfast, lunch and dinner20.
As for physical activity, most teachers practice. VIGITEL data show a significant increase in physical activity in the past six years among Brazilian 19.
The food scores were significantly correlated with the domains of QOL and overall QOL. Regarding food quartiles, the higher the diet score, the better the overall QOL in every domain, except the social domain. Study of Sonati et al.30,
using the WHOQOL-BREF questionnaire as the single instrument for assessing the perception of quality of life of groups, showed that active seniors, compared to active adults, enjoy better QOL in aspects of working life, the performance of daily living activities , acceptance of physical appearance, financial satisfaction and time available for leisure activities. For the group of adults, it was noted that important factors such as labor activity and family may influence the QOL perception of these individuals.
As an example of recognition of the spiritual dimension importance, the World Health Organization included a spiritual/religious/personal beliefs domain on its instrument for assessing quality of life (WHOQOL) 31.
The study population was attended by teachers belonging to a religious entity, which in itself is a factor that is positively associated with QOL. Rocha and Fleck32 reported that the
importance given to spirituality/religion/personal beliefs appears positively associated with the QOL on most of their domains, independently of other factors involved.
The results of Melo et al.33 showed that religion and
spirituality are correlated with QOL, working mainly when coping with adverse situations. Thus, it is evident the importance of these phenomena to health practices, emphasizing the need to value them and include them in vocational training.
The produced study presented some limitations, such as the activities of educational planning meeting held simultaneously with the research, little disclosure and adherence of teachers to participate in the research, limiting the total number expected. The use of the questionnaire to collect data on the perception of QOL, for being extensive and self answered, may have led to an error in the interpretation of the questions. There are few studies that evaluate the food consumption of basic education teachers and use standardized instruments for future comparisons.
The findings of this study showed a weak association between three of the four QOL domains assessed, suggesting that individuals feel better as they feed better. It is needed more studies that assess the QOL and the food intake of primary school teachers that may contribute to these professionals to understand better and to contribute to the promotion of school health from their own lifestyle.
CONCLUSION
Most teachers have good QOL and satisfactory food intake. The relationship between QOL and food consumption shows that the higher diet score, the better QOL for teacher in all domains studied. Thus a healthy diet can contribute to health promotion, reflecting in a better QOL.
REFERÊNCES
1. World Health Organization (WHO). The WHOQOL Group. The Word Health Organization quality of life assessment (WHOQOL): position paper from the World Health Organization. Soc Sci Med 1995; 41:1403-9.
2. Pereira EF, Teixeira CS, Andrade RD, Bleyer FTS, Lopes AS. Associação entre o perfil de ambiente e condições de trabalho com a percepção de saúde e qualidade de vida em professores de educação básica. Cad Saúde Coletiva 2014; 22(2):113-19.
3. Santos MN, Marques AC. Condições de saúde, estilo de vida e características de trabalho de professores de uma cidade do sul do Brasil. Ciênc Saúde Coletiva 2013; 18(3):837-46.
4. Reis RS. Comportamentos de risco à saúde e percepção de estresse dos professores universitários das IFES do sul do Brasil [tese]. Florianópolis (SC): Universidade Federal de Santa Catarina; 2005. 5. Collaço JHL. Restaurantes de comida rápida, os fast foods, em praças
de alimentação de shopping centers: transformações no comer. Estudos Históricos 2004; 1(33):166-35.
6. Brasil. Ministério da Saúde. Secretaria de Vigilância em Saúde. Vigitel Brasil 2013: Vigilância de fatores de risco e proteção para doenças crônicas por inquérito telefônico. Brasília, DF; 2014. [acesso em 23 jun 2005]. Disponível em: http://bvsms.saude.gov.br/bvs/publicacoes/ vigitel_brasil_2013.pdf.
7. Grande AJ, Silva V, Manzatto L, Rocha TBX, Martins GC, Vilela Junior GB. Determinantes da qualidade de vida no trabalho: ensaio clínico controlado e randomizado por clusters. Rev Bras Med Esporte 2013; 19(5):371-75.
8. Associação Brasileira de Empresas de Pesquisa (ABEP). Critério de Classificação Econômica Brasil (2014). [acesso em 18 abr 2015]. Disponível em: http://www.abep.org/criterio-brasil.
9. Fleck MPA, Louzada S, Xavier M, Chachamovich E, Vieira G, Santos L, Pinzon V. Aplicação da versão em português do instrumento abreviado de avaliação da qualidade de vida “WHOQOL-bref”. Rev Saúde Pública 2000; 34(2):178-83.
10. Brasil. Ministério da Saúde. Secretaria de Políticas de Saúde. Guia Alimentar: Como ter uma alimentação saudável. Brasília, DF; 2007. [acesso em 6 jul 2015]. Disponível em: http://bvsms.saude.gov.br/bvs/ publicacoes/guia_alimentar_alimentacao_saudavel.pdf.
11. Franzoni B, Lima LA, Castoldi L, Labrêa MGA. Avaliação da efetividade na mudança de hábitos com intervenção nutricional em grupo. Ciênc Saúde Coletiva 2013; 18(12):3751-8.
12. Brasil. Ministério da Saúde. Guia Alimentar Para População Brasileira: Promovendo a Alimentação Saudável Programa. Brasília, DF; 2008. [acesso em 23 set 2015]. Disponível em: http:// bvsms.saude.gov.br/bvs/publicacoes/guia_alimentar_populacao_ brasileira_2008.pdf.
13. Demartini ZBF, Antunes FF. Magistério primário: profissão feminina, carreira masculina. Cad Pesq 1993; (86):5-14.
14. Rabelo AO. A escolha profissional dos homens pela docência na escola “primária”. Rev Educ em Questão 2011; 41(27):06-37. 15. Dias AF. Trabalho docente e gênero: representações de sentidos e
significados do trabalho de docentes do ensino básico. Gepiadde 2013; 14:113-26.
16. Meira TRM, Cardoso JP, Vilela ABA, Amorim CR, Rocha SV, Andrade AN et al. Percepções de professores sobre trabalho docente e repercussões sobre sua saúde. Rev Bras Promoç Saúde 2014; 27(2):276-82.
17. Pereira EF, Teixeira CS, Andrade RD, Silva-Lopes A. O trabalho docente e a qualidade de vida dos professores na educação básica. Rev Salud Publica 2014; 16(2):221-31.
18. Gallina LS, Teo CRPA, Szinwelski NK, Bohrz S, Grahl F, Albani G. Hábito alimentar do professor: importante elemento para a promoção da saúde no ambiente escolar. Rev Simbio-Logias 2013; 6(9):105-16. 19. Brasil. Ministério da Saúde. Secretaria de Vigilância em Saúde. Vigitel
Brasil 2014: Vigilância de fatores de risco e proteção para doenças crônicas por inquérito telefônico. Brasília, DF; 2014. [acesso em 24 jun 2015]. Disponível em: http://bvsms.saude.gov.br/bvs/publicacoes/ vigitel_brasil_2014.pdf.
20. Brasil. Ministério da Saúde. Secretaria de Atenção à Saúde. Departamento de Atenção Básica. Guia Alimentar Para a População Brasileira. 2. ed. Brasília, DF; 2014. [acesso em 30 jun 2015]. Disponível em: http://bvsms.saude.gov.br/bvs/publicacoes/guia_ alimentar_populacao_brasileira_2ed.pdf.
21. Levy RB, Claro RM, Mondini L, Sichieri R, Monteiro CA. Distribuição regional e socioeconômica da disponibilidade domiciliar de alimentos no Brasil em 2008-2009. Rev Saúde Pública 2012; 46(1):6-15. 22. Knutsen SF, Fraser GE, Beeson WL, Lindsted KD, Shavlik DJ.
Comparison of adipose tissue fatty acids with dietary fatty acids as measured by 24-hour recall and food frequency questionnaire in Black and White Adventists: the Adventist Health Study. Ann Epidemiol 2003; 13(2):119-27.
23. World Health Organization (WHO). Protein and amino acid requirements in human nutrition. Report of a joint WHO/FAO/UNU Expert
Consultation, United Nations University. Technical Report Series, 935. New York; 2007. [acesso em 21 ago 2015]. Disponível em: http://apps.who. int/iris/bitstream/10665/43411/1/WHO_TRS_935_eng.pdf.
24. Brasil. Ministério do Planejamento Orçamento e Gestão. Instituto Brasileiro de Geografia e Estatística. Pesquisa de Orçamento Familiar (POF) 2002- 2003: Primeiros resultados. Rio de Janeiro, RJ; 2004. [acesso em 5 jul 2015]. Disponível em: http://www.ibge.gov.br/home/ estatistica/populacao/condicaodevida/pof/2002/pof2002.pdf. 25. Brasil. Ministério do Planejamento Orçamento e Gestão. Instituto
Brasileiro de Geografia e Estatística. Pesquisa de Orçamento Familiar (POF) 2008- 2009: Despesas, rendimentos e condições de vida. Rio de Janeiro, RJ; 2010. [acesso em 29 jun 2015]. Disponível em: http:// www.ibge.gov.br/home/estatistica/populacao/condicaodevida/ pof/2008_2009/POFpublicacao.pdf.
26. Rombaldi AJ, Silva MC, Neutzling MB, Azevedo MR, Hallal PC. Fatores associados ao consumo de dietas ricas em gordura em adultos de uma cidade no sul do Brasil. Ciênc Saúde Coletiva 2014; 19(5):1513-21.
27. World Health Organization (WHO). Diet, nutrition and prevention of chronic diseases. Report FAO/WHO Expert Consultation. WHO Technical Report Series 916. Geneva; 2003. [acesso em 9 ago 2015]. Disponível em: http://whqlibdoc.who.int/cgi-bin/repository.pl?url=/ trs/WHO_TRS_916.pdf.
28. Brasil. Ministério da Saúde. Secretaria de Vigilância em Saúde. Secretaria de Gestão Estratégica e Participativa. Vigitel Brasil 2010: Vigilância de fatores de risco e proteção para doenças crônicas por inquérito telefônico. Brasília, DF; 2011. [acesso em 11 jul 2015]. Disponível em: http://bvsms.saude.gov.br/bvs/publicacoes/ vigitel_2010.pdf.
29. WORLD HEALTH ORGANIZATION (WHO). Information note about intake of sugars recommended in the WHO guideline for adults and children. Geneva; 2015. [acesso em 13 ago 2015]. Disponível em: http://apps.who.int/iris/ bitstream/10665/149782/1/9789241549028_eng.pdf?ua=1. 30. Sonati JG, Vilarta R, Maciel ES, Modeneze DM, Vilela Junior GB,
Lazari VO et al. Análise comparativa da qualidade de vida de adultos e idosos envolvidos com a prática regular de atividade física. Rev Bras Geriatr Gerontol 2014; 17(4):731-9.
31. Moreira-Almeida A, Koenig HG. Retaining the meaning of the words religiousness and spirituality: a commentary on the WHOQOL SRPB group’s “a cross-cultural study of spirituality, religion, and personal beliefs as components of quality of life” (62: 6, 2005, 1486-1497). Soc Sci Med 2006; 63(4):843-5.
32. Rocha NS, Fleck MPA. Avaliação de qualidade de vida e importância dada a espiritualidade/religiosidade/ crenças pessoais (SRPB) em adultos com e sem problemas crônicos de saúde. Rev Psiq Clín 2011; 38(1):19-23.
33. Melo CF, Sampaio IS, Souza DLA, Pinto NS. Correlação entre religiosidade, espiritualidade e qualidade de vida: uma revisão de literatura. Estud Pesqui Psicol 2015; 15(2):447-64.
Received on: 24/03/2016 Required for review: No Approved on: 19/09/2017 Published on: 25/10/2017
Contact of the corresponding author:
Marcia Maria Hernandes de Abreu de Oliveira Salgueiro Rua Manuel Jacinto 932, Apto. 11, Bloco 11 Vila Sônia, São Paulo ZIP-code: 05624-001