Alexandre Miguel Papadopoulos Magalhães
April 2015
RNA-seq analysis of the Quercus suber
root response to drought
UMinho|20 15 Ale xandr e Miguel P apadopoulos Magalhães RNA -seq anal ysis of t he Quer cus suber roo t response to drought
Universidade do Minho
Escola de Ciências
Alexandre Miguel Papadopoulos Magalhães
April 2015
Msc thesis in
Plant Molecular Biology, Biotechnology and
Bioentrepreneurship
RNA-seq analysis of the Quercus suber
root response to drought
Universidade do Minho
Escola de Ciências
Work supervised by
Doctor Rui Tavares
Doctor Herlânder Azevedo
Doctor Pedro Humberto Castro
Declaração Nome: Alexandre Miguel Papadopoulos Magalhães Endereço electrónico: [email protected] Telefone: +351 917001036
Número do Cartão de Cidadão: 13739531
Título tese de Mestrado:
RNAseq analysis of the Quercus suber root response to drought
Orientadores:
Doutor Rui Manuel Peixoto Tavares
(Departamento de Biologia, Escola de Ciências, Universidade do Minho, Portugal) Doutor Herlânder Anselmo Queirós Pereira Azevedo
(CIBIO, InBIO - Research Network in Biodiversity and Evolutionary Biology, Universidade do Porto, Portugal)
Doutor Pedro Humberto Castro
(Departamento de Biologia, Escola de Ciências, Universidade do Minho, Portugal)
Ano de conclusão: 2015
Designação do Mestrado:
Mestrado em Biologia Molecular, Biotecnologia e Bioempreendedorismo em Plantas
É AUTORIZADA A REPRODUÇÃO INTEGRAL DESTA TESE APENAS PARA EFEITOS DE INVESTIGAÇÃO, MEDIANTE DECLARAÇÃO ESCRITA DO INTERESSADO, QUE A TAL SE COMPROMETE.
Universidade do Minho, ___/___/______
“When you eliminate the impossible, whatever remains, however improbable, must be the truth”
Leonard Nimoy – Star Trek VI: The
Undiscovered Country, 1991
“Research is what I’m doing when I don’t know what I’m doing”
Wernher von
Aos Doutores Rui Tavares, Herlander Azevedo e Pedro Humbertro Castro
Acknowledgments
It is finally over!!! I could not emphasize this more. I learned a lot, met some new people, expanded my horizon, and thanks to a few I am now a better student and researcher than last year. Now it is time for thanking those people.
First and foremost my supervisors. To Professor Rui Tavares for helping me a lot throughout the thesis and for always being straight and honest with me. To Herlander Azevedo for giving me the opportunity of entering a field, that despite being straight up to difficult and horrendous to some, has me fascinated and fully committed to the future. Your patience and dedication helped me evolve and master this field of bioinformatics. I cannot thank you enough for this. And to Humberto that with a strict supervision taught precision and carefulness is essential for excellence in the lab. To Teresa Lino Neto for being always present throughout the project and for having always an optimistic view even when things do not go as planned. Finally to Manuela costa even if not being my supervisor was always helpful and provided excellent advice when needed.
Many thanks to all my colleagues at the lab for supporting me. To Joana, Helena, Jõao, Telma, Francisca for the help and company. Special note has to be made to Romulo for always having the time to advice and answer even the smallest of doubts, and Sara Freitas for the laughs, those little breaks for coffee to help with the morning and for the little tutoring always helpful. To Nuno and Miguel my war buddies many thanks for the friendship and company... we entered together and we conquered. To all above I am certain that you will have great success in your scientific career and even greater accomplishments at the personal level. To you Tiago our time was little but I hope you have a great future.
For all the company, an especial thanks Luis, Vasco and Vera. Even not being members of the lab you were always present, especially during the breaks and the necessary coffee, helping to take my mind off science.
Must acknowledge all my colleagues from the first year of the masters. A special thanks from the heart to Helena and Raquel for this last two years. You were always my company throughout the first year and the thesis. We enduring great difficulties, work and disappointments is always better when in the company of great friends. We shared allot, we laugh, we fought and sometimes you cried but in the end the friendship was always v
present. To you Angela also an especial thank you, you were not with us throughout the thesis but when present you smile gave us joy to continue.
To all my friends thank you for the support. Special remark to those that accompanied me. To Luis you were always there from the beginning and you will always be like a brother to me. To Sandra for those talks and support when needed. To Pedro Calheiros for everything you have done for me. And at last a great appreciation to Viriato, Avelino and Manel (Jorge) for the latte drinks and friendship. You all help me endure those last academic years and for that I will always be grateful. I hope you can share more moments together and you will be always present in my life.
All of this was not possible without my parents and grandparents. You paid for my education, you supported me, and you carried me until the end. I will always be grateful and hope I can be all that you want me to be.
Last but not least to Caroline. You were always my company, always the smile that brought me back up. Thank you for always being there and always putting up with me. You will always be in my heart.
RNAseq analysis of the Quercus suber root response to drought
Abstract
Cork oak (Quercus suber L.) is a typical species from the Portuguese Mediterranean forest, usually growing in dry environments. Mainly due to its high economic value, cork oak has been considered a protected plant species and a national species of interest. Factors resulting from climate changes, e.g. increased temperature, high light intensity, drought and air pollution are directly affecting the development of plants and reducing their productivity. Next generation sequencing, in particular RNA-seq, has proven to be a powerful tool with a diverse range of applications, and provides fundamental insight into the structure and regulatory aspects of gene networks, particularly when organisms without avalible OMICs resources, such as a sequence genome, are studied.
To address the cork oak’s response and regulation to water availability, differential transcriptomic analysis was performed in roots of young plantlets subjected to moderate and high drought conditions, comparing to well-irrigated plants. Photosynthetic activity measured by PAM fluorometry and photosynthetic pigment content were used as physiological indicators of plant fitness. cDNA was obtained from previously drought-stressed roots RNA, and sequencing was carried out by Roche’s 454 technology resulting in three libraries, of a 1.8 million reads in total, later assembled into 21012 unigenes, that would be used for mapping steps, in order to identify differential expression. This resulted in the identification of 353 up-regulated and 193 down-regulated genes. Primary
in silico analysis identified a significant number of effector genes traditionally associated
with drought responses, such as dehydrins, LEA proteins, cell wall remodeling, transcription factors and ubiquiting-associated genes, suggesting a tight control of drought responses at both the transcriptional and protein turnover levels.
Further in silico analysis was accomplished by annotating the genes against the genome of the model plant Arabidopsis thaliana, allowing for ortholog identification. This allowed us to establish gene networks based on functional characteristics, such as gene co-expression, protein-protein interactions and co-localization. Coupled with cis-element enrichment and transcription factor identification, this analysis enabled the establishment of functional and regulatory relationships between differentially expressed genes. Ultimately, we demonstrated the induction, in drought stressed Quercus suber roots, of a complete, ABA-dependent signaling cascade. Elements of this signaling vii
cascade range from ABA-sensing components to transcription factors and then to effector genes involved in the drought response.
Análise de RNAseq da resposta à secura de raiz de Quercus suber
Resumo
O sobreiro (Quercus suber) é uma especie tipica da floresta Mediterranea Portuguesa e cresce usualmente em ambientes secos. Devido ao seu elevado valor economico, o sobreiro é considerado uma especie vegetal protegida e de interesse nacional. Fatores decorrentes das alterações climaticas como, temperatura e intensidade luminosa elevadas, seca e bem como poluentes afetam o desemvolvimento vegetal, reduzindo a produtividade de cultivares de interesse. A sequenciação de nova geração, em particular RNA-seq, tem se destacando como um poderosa ferramenta de aplicações diversas, providenciando conhecimentos fundamentais sobre aspetos estruturais e reguladores de redes genéticas, particularmente em estudos em organismos sem recursos das OMICas, como um genoma sequenciado.
Para estudar a resposta do sobreiro a condições que comprometem a disponiblidade de água, foi efetuada análise diferencial dos transcriptomas de raizes de plantas jovens sujeitas a condições de secura moderada e severa, e os resultados foram comparados com os obtidos a partir de raizes de plantas bem irrigadas. A actividade fotossintética foi medida for flurometria PAM e o conteúdo de prolina e pigmentos fotossinteticos foram considerados como indicadores fisiologicos do fitness das plantas. cDNA, obtido a partir de RNA extraido destas raizes, foi sequenciado por tecnologia 454 da Roche, resultando em 3 bibliotecas de 1.8 milhões de reads total, mais tarde assembladas em 21012 unigenes para serem utilizadas nos passos de mapeamento utilizado em expressão diferencial. Esta analise resutou em 353 genes positivamente indusidos e 193 genes negativamente indusidos. Analise primária in silico identificou um número significativo de genes efetores tradicionalmente associados à resposta a secura, como desidrinas, proteínas LEA, genes de remodelação da parede celular, fatores de transcrição e genes assossiados a ubiquitina, sugerindo um controlo apertado da resposta à secura dos níveis transcricionais, bem como de abundância proteica.
Nova análise in silico foi realizada atravez da identificação de genes ortologos, anotando-se os genes de sobreiro contra o genoma de Arabidopsis thaliana. Este estudo possibilitou o estabelecimento de redes genéticas basiadas em características funcionais como co-expressão, interação proteína-proteína e co-localização. Conjuntamente com análise de enriquecimento de elementos cis e identificação de fatores de transcripção, foi possivel establecer relações funcionais e e de regulação entre os genes. Os resultandos permitem sugerir que ocorre indução de uma cascata de sinalização dependente do ABA ix
em raizes de Q. suber em condições de secura, onde estão envolvidos sensores do ABA, fatores de transcrição e genes efectores envolvidos na resposta à secura.
Table of Contents
Acknowledgments v
Abstract vii
Resumo ix
Table of contents xi
Abbreviations and symbols xiii
List of figures xiv
List of tables xv
Chapter 1–Introduction 1
1.1Quercus suber (cork oak) biology 3
1.2Quercus suber (cork oak) biology 3
1.3 Molecular tools in Quercus suber research 7
1.3.1 DNA extraction 8
1.3.2 RNA extraction 8
1.3.3 Real-Time Quantitative PCR (qPCR) 9
1.3.4 Molecular markers and population genomics 9
1.3.5 OMICS and NGS 10
11 14 1.4 Next-generation sequencing in non-model plants
1.5 Objectives and outline of the thesis
15
2.1Plant material and physiological assessments 17
2.2454 sequencing 17
2.3Sequence assembly and differential expression analysis 17 2.4Protein prediction, functional annotation and ortholog assessment 19
2.5Functional data mining in Arabidopsis 19
19 19 19 20 2.5.1Gene Network analysis
2.5.2Transcription factor identification 2.5.3Cis-element enrichment
2.5.4Phylogenetic analysis
20 2.6Quantitative Real-Time PCR
Chapter 3–Results and Discussion 23
xi 3.1.Physiological response to long-term drought
3.2.Assembly of the Quercus suber root transcriptome
25 26 Chapter 2–Materials and Methods
30 32 36 46 3.3.Differential expression analysis of the drought root
transcriptome
3.4.Annotation of differentially expressed genes 3.5.Functional data mining of DEGs
3.6.Identification of an ABA-dependent signaling network
53
Chapter 5–Bibliography 57
Appendixes 67
Appendix I
xii Chapter 4–Concluding remarks and future perspectives
Abbreviations and Symbols
ºC degrees Celsius aa amino acids ABA abscisic acid
BLAST basic local alignment search tool bp base pair
cDNA complementary DNA CDS coding sequence
DEG differentially expressed gene DNA deoxyribonucleic acid
EDTA ethylenediaminetetraacetic acid ERF ethylene response factor EST expressed sequence tag g gram
g relative centrifuge force
GO gene ontology h hour HQ high quality L liter M molar m meter
MAPK Mitogen-activated protein kinases min minute
mol mole
NGS next-generation sequencing ORF open reading frame PAM pulse amplitude modulated PCR polymerase chain reaction qPCR real-time quantitative PCR RNA ribonucleic acid
Rpm rotations per minute ROS reactive oxygen species s second
SA salicylic acid SD standard deviation
SEM standard error of the means SOTA self-organizing tree algorithm TAIR The Arabidopsis information
resource
Taq Thermus aquaticus polymerase TF transcription factor
Tm melting temperature Ub ubiquitin
v/v volume per volume w/v weight per volume
List of Figures
Figure 1.1 Adult cork oak specimen in a montado. 4
Figure 1.2 The cork oak natural distrubition area. 5
Figure 1.3 Q. suber cork extraction. 6
Figure 1.4 Cork oak industry products. 6
Figure 1.5 Overview of the workflow for analysis of RNA-Seq data. 12 Figure 3.1 Characterization of morphological and physiological traits of Q.
suber plantlets subjected to long-term drought stress. 26
Figure 3.2 Outline of the RNA-Seq strategy employed in the identification of
the Q. suber differential root transcriptome in response to long-term drought. 27 Figure 3.3 Characterization of sequence data regarding processing and
assembly of reads. 29
Figure 3.4 Venn diagram representation of the number of homology hits (e<10-6) between Q. suber unigenes and Arabidopsis thaliana TAIR 10 gene
models, Q. rubra putative transcripts and the Castanea mollissima predicted
transcriptome. 29
Figure 3.5 Characterization of differential gene expression in
drought-stressed Quercus suber roots. 30
Figure 3.6 Characterization of differential gene expression in D100/90 vs
D50, D100/90 vs D25/10 and D50 vs D25/10 transcriptional comparisons. 31 Figure 3.7 Annotation of differentially expressed genes by BLAST
homology search. 33
Figure 3.8 Gene network analysis of Arabidopsis DEG orthologs regarding
functional features. 37
Figure 3.9 Additional gene network analysis, performed in the Genemania
App of Cytoscape, of Arabidopsis DEG orthologs. 40
Figure 3.10 Phylogenetic reconstruction of NAC TF class, containing Q.
suber differentially expressed unigenes, and the complete annotated set of
Arabidopsis thaliana NAC gene family members. 43
Figure 3.11 Phylogenetic reconstruction of AP2-ERF TF class, containing Q.
suber differentially expressed unigenes, and the complete annotated set of
Arabidopsis thaliana AP2-ERF superfamily members. 44
Figure 3.12 Phylogenetic reconstruction of MYB TF class, containing Q.
suber differentially expressed unigenes, and the complete annotated set of
Arabidopsis thaliana MYB gene family members. 45
Figure 3.13 Phylogenetic reconstruction of WRKY TF class, containing Q.
suber differentially expressed unigenes, and the complete annotated set of
Arabidopsis thaliana WRKY gene family members. 46
Figure 3.14 Model for the regulation of long-term drought responses in Q.
suber roots: ABF-dependent signalling pathway components are up-regulated
in Q. suber roots in response to drought. 48
Figure 3.15 Phylogenetic reconstruction of PP2C identified in the Q. suber differentially expressed unigenes and the complete annotated set of
Arabidopsis thaliana genes from the same class. 50
Figure 3.16 Real-time RT-PCR analysis of selected Q. suber drought stress
responsive genes. 52
List of Tables
Table 2.1 List of quantitative qPCR primers. 20
Table 3.1 Statistics of the sequencing and assembly steps. 28 Table 3.2 Selection and categorization of significant Quercus suber unigenes
differentially expressed in response to drought. 34 Table 3.3 Cis-elements over-represented in the promoter region of DEG
orthologs. 38
Table 3.4 List of transcription factors (TFs) present within DEG orthologs. 42
Chapter 1
_______________________________________________
Introduction
____________________________________________________________
C
ONTENTS1.1 Plant response to abiotic stress 3
1.2 Quercus suber (cork oak) biology 3
1.3 Molecular tools in Quercus suber research 7
1.3.1 DNA extraction 8
1.3.2 RNA extraction 8
1.3.3 Real-Time Quantitative PCR (qPCR) 9
1.3.4 Molecular markers and population genomics 9
1.3.5 OMICs and NGS 9
1.4 Next-generation sequencing in non-model plants 11
Chapter 1. INTRODUCTION
1.1. Plant response to abiotic stress
Living organisms are continuously affected by a variety of environmental factors. Plants, in particular, have evolved a variety of advance response mechanisms to cope with the challenges facing a sessile organism. Those adverse environmental factors limit survival, biomass production, development and yield. Abiotic stress, that can consist of drought, salinity, extreme temperatures, heavy metal oxidative stress, high UV irradiation, or often a combination of these stresses, is a particularly significant threat to crop productivity and is the major cause for worldwide yield losses in crop plants (Wang et al., 2003; Ahmad and Prasad, 2011; Qin et al., 2011; Koyro et al., 2012). To cope with these daily and seasonal environmental changes, plants response mechanisms often involve gene regulation, engaging signal transduction to trigger changes in metabolic processes, management of resources, and organ morphology (Wang et al., 2003; Danquah et al., 2014). Currently, many aspects of the regulatory pathways involved in these responses have been described. They include environmental sensing mechanisms, membrane-localized elements, signalling transduction components such as MAP kinase cascades, hormone-dependent signalling modules, and induction of several classes of transcription factors, such as HSF, AP2/ERF, NAC, MYB, ABF, DREB/CBF (Wang et al., 2003; Wang et al., 2004; Yoshida et al., 2010; Lata and Prasad, 2011; Atkinson and Urwin, 2012; Chen et al., 2012; Mizoi et al., 2012; Nakashima et al., 2012; Osakabe et al., 2013; Danquah et al., 2014; Nakashima et al., 2014). These regulatory events manage the expression of functional downstream response genes, involved in growth regulation, water management, ROS scavenging and induction secondary metabolism (Wang et al., 2003; Atkinson and Urwin, 2012). Highlighting the level of complexity associated with abiotic stress signalling, many novel regulatory mechanisms have been uncovered in recent years, including microRNA regulation (Lu and Huang, 2008; Khraiwesh et al., 2012), chromatin remodelling (Golldack et al., 2011; Luo et al., 2012) and examples of post-translational modification of proteins (Castro et al., 2012). Uncovering of new regulatory mechanisms may, one day, ensure plant productivity for future generations facing ever-changing climate conditions.
1.2. Quercus suber (cork oak) biology
Cork oak (Quercus suber) is an evergreen species of the Fagaceae family, being one of the most significant forest species in the Mediterranean region. Their ecological dominance and economic value define this species as one of the main oak species in the western part of the Mediterranean Basin (Nixon, 1993; Belahbib et al., 2001). Q. suber (Figure 1.1) is a slow 3
Chapter 1. INTRODUCTION
growing, extremely long-lived tree, reaching a height of up to 20 m, with massive branches forming a round crown (Faria et al., 1996). It is a diploid (2n=24), monoecious species, with a protandrous to ensure cross-pollination. Natural propagation in wild populations occurs by natural regeneration, through seed (acorn) dispersal and subsequent germination. Cork oak natural regeneration is mostly assured by wind and animals, which is consistent with the strategy of most evergreen species (Magri et al., 2007).
Figure 1.1. Adult cork oak specimen in a montado. (www.panoramio.com)
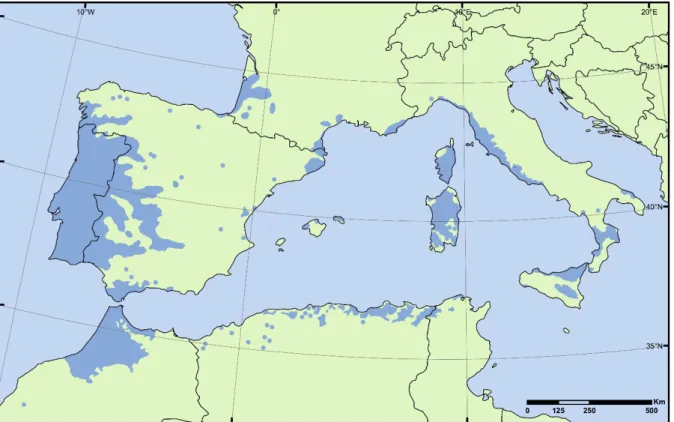
Cork oak are distributed around overlapping habitats. In the Western Mediterranean Basin, Q. ilex and Q. suber are the dominant broadleaved oak species. Q. suber has quite a narrow geographical range when compared to that of other main Mediterranean oak species, mainly due to its ecological restrictions (Toumi and Lumaret, 1998; Toumi and Lumaret, 2001). The modern distribution of cork oak is rather discontinuous, ranging from the Atlantic coasts of North Africa and Iberian Peninsula to the south-eastern regions of Italy, Sicily and Sardinia, as well as the coastal belts of Algeria and Tunisia, France and Spain (Figure 1.2) (Lumaret et al., 2005; Magri et al., 2007).
Chapter 1. INTRODUCTION
Figure 1.2. The cork oak natural distribution area. Adapted from EUFORGEN2009.
(www.euforgen.org)
As a species that is endemic to the Western Mediterranean region, Q. suber is mostly present in semi-natural stands known as Montados, which are open woods with a delicate and particular ecosystem, created and maintained by man (Sánchez-González et al., 2008).
Montados and Cork oak management represent an important economical resource, as they are
associated not only with the harvesting of acorns, but also with the use of bark as the source of cork (Lopes et al., 2001). Trees are stripped of cork from the trunk (lower portion) (Figure 1.3), when they are approximately 18-25 years of age, and subsequently every 9-12 years (first and second strips are usually discarded for quality reasons). This process can be sustained for 100 to 500 years without any evident consequence on the tree’s physiology (Lopes et al., 2001; Oliveira and Costa, 2012). Presently, Q. suber forests cover 2.2 million hectares worldwide, providing 340,000 tons/year of cork. The largest stands, covering about 737000 ha, are in Portugal, and correspond to 23% of the forest area in Portugal and to 34% of the world’s cork producing area. Currently, the cork industry represents 3% of all Portuguese exports. Cork stoppers (Figure 1.4, A) used in the wine industry are the most representative product of this industry, responsible for 70% of exports (ICNF, 2013).
Chapter 1. INTRODUCTION
Figure 1.3. Q. suber cork extraction.
(A) Adult tree main trunks after cork extraction. (www.wineanorak.com)
(B) Clouse-up of a high-quality piece of bark used in wine stoppers. (www.wineanorak.com)
Other applications look at the remarkable qualities of cork as a light-weight material, compressible, elastic and flexible. It is also impermeable to most liquid and gaseous substances and an extremely good insulator of heat, sound, shock and electricity, making it a target for industrial utilization, with applications ranging from natural materials used in everyday construction (Figure 1.4, B) to high performance insulation used in the aerospace industry including the Space Shuttle, Delta and Atlas rockets (www.corkfacts.com).
Figure 1.4. Cork oak industry products.
(A) Cork stoppers for wine bottles. (www.corkfacts.com) (B) Cork tiles used for flooring. (www.corkfacts.com)
The Cork oak’s economic and environmental importance has to be taken into consideration as the unparalleled decline in cork oak plantations that has been occurring in the Iberian Peninsula and in Morocco is threatening the entire ecosystem (Coelho et al., 2006). Although the marginal and natural populations of cork oak are possibly the most endangered, Iberian Montados are also currently threatened and in decline due to multiple factors. The main factor contributing to this decline is the occurrence of very severe drought periods over several consecutive years (Toumi and Lumaret, 1998). As opposed to other oaks which have a 6
Chapter 1. INTRODUCTION
great ecological amplitude, this species is a sclerophyllous tree that is adapted to a 4-month-long hot-dry summer period (with at least 450 mm mean annual rainfall), maximum temperatures approaching 35 to 40°C, mid-day irradiance exceeding 2,000 μmol m-2 s-1
photosynthetically active radiation (PAR) (Faria et al., 1996; Toumi and Lumaret, 1998; Toumi and Lumaret, 2001; Catry et al., 2012). The Mediterranean-climate regions are characterized by a cycle of temperatures out of phase with the rainfall, producing mild to cool rainy winters and dry summers. The hydrological variability of Mediterranean climate regions is due to a combination of rainfall (irregularly distributed in time and space) and heterogeneous land topography. The existing variety of climatic conditions in these areas is due to the specific configuration of land surface and distance from sea. The climate of Mediterranean areas induces a temporal variability in the soil moisture dynamics that is strongly affected by seasonal fluctuations between humid and dry conditions (Toumi and Lumaret, 1998; Toumi and Lumaret, 2001; Sofo et al., 2008; Catry et al., 2012).
Mediterranean vegetation dealing with this peculiar soil moisture dynamics has developed a number of physiological mechanisms to tolerate drought stress and growth under adverse climatic conditions, which include early responses involving stomatal closure, to prevent or delay tissue dehydration, and antioxidant biosynthesis as a photoprotection mechanism (Flexas et al., 2014). Other long term acclimation responses include decreased growth, to reduce water and nutrient demands (Nuche et al., 2014), changes in allocation of resources, from support tissues to assimilating organs (Nuche et al., 2014) and development of strategies to prevent xylem cavitation, like refilling mechanisms, regulation of hydraulic conductance and xylem margin reinforcement and repair (Nardini et al., 2014). Moreover, studies at population level suggest that Mediterranean species have overall phenotypic plasticity to global changes, and many species like Q. suber have significant differences in adaptive evolutionary potential, with important implications for species distribution (Matesanz and Valladares, 2014).
1.3. Molecular tools in Quercus suber research
As environmental changes in the Mediterranean basin keep casting a shadow of doubt on the resilience of this species, and as numbers of natural population of cork oak keep declining, more and more efforts are driven toward the understanding of the biology and physiology of such an important economic species. Over the last years, several tools have been developed to study several aspects of the species at the genetic and molecular levels, such as gene/protein characterization, population genomics and dEST transcriptomics, aiding, 7
Chapter 1. INTRODUCTION
as well, the development of OMICs-based approaches that are essential for characterisation of cork oak at a systems level.
1.3.1. DNA extraction
Nucleic acid extraction has been accomplished with a number of approaches ranging from commercial kits to more complex strategies. DNA extraction has been amply extracted from different tissues, manly following the protocol developed by Doyle (1990) with uses Cetyl Trimethyl Ammonium Bromide (CTAB) and is optimized for fresh tissue. A number of authors have adopted this method for extraction (Soto et al., 2003; Coelho et al., 2006; Soto et al., 2007; Rocheta et al., 2012; Almeida et al., 2013), reporting high yields. Kit-based approaches have relied mostly on Qiagen’s Plant DNeasy Kit, reported to successfully extract genomic DNA from a number of different tissues (Alvarez et al., 2004; Rocheta et al., 2012; Modesto et al., 2014).
1.3.2. RNA extraction
RNA extraction methods have been more diverse. Given the recalcitrant nature of tissues in woody species (Kozlowski and Pallardy, 2002), methods have to account for various pigments, polysaccharides and secondary metabolites, including phenolic compounds that affect not only downstream applications (Loomis, 1974; Richards et al., 1994; Wilkins and Smart, 1996) as well as RNA integrity (Azevedo et al., 2003) and quantification of a given sample (Wilkins and Smart, 1996).
The most recent implementation of Next Generation Sequencing (NGS) technology to study the cork oak’s transcriptome employed a number of methodologies that could yield high-quality RNA suitable for such an application. Methods range from commercial kits, like RNAqueous Kit (Ambion) (Rocheta et al., 2014) or RNeasy Plant Mini Kit (QIAGEN) (Pereira-Leal et al., 2014) to more complex protocols like the Hot Borate method (Wan and Wilkins, 1994; Sebastiana et al., 2014). Also within NGS applications a number of “hybrid” approaches have been used, in which commercial kits have been employed together with extra reagents, to enhance extraction quality and yield (Pereira-Leal et al., 2014; Teixeira et al., 2014) or other cases where an additional cleaning step was introduced to eliminate any leftover contaminants (Pereira-Leal et al., 2014). Other studies have also used commercial kits (Chaves et al., 2011; Rocheta et al., 2012; Almeida et al., 2013) or kit-less approaches as described above (Soler et al., 2007; Soler et al., 2008; Rocheta et al., 2012; Almeida et al., 2013; Almeida et al., 2013), the exception being the method implemented by Marum et al. 8
Chapter 1. INTRODUCTION
(2012) and Pereira-Leal et al. (2014) which is a CTAB-based method with selective precipitation.
1.3.3. Real-Time Quantitative PCR (qPCR)
One of the most useful downstream applications of the above mentioned RNA extraction methods (1.2.2) was the establishment of a set of genes that display constitutive expression in different tissues, developmental stages and stress-related responses, to be implemented as internal controls for qPCR applications. Marum et al. (2012) reported ten candidate reference genes based on gene sets reported in other plants like Arabidopsis
thaliana (Czechowski et al., 2005; Remans et al., 2008; Hong et al., 2010) but focusing on
reports in woody trees like poplar, spruce and logan (Brunner et al., 2004; Gutierrez et al., 2008; Phillips et al., 2009; Lin and Lai, 2010; Xu et al., 2011). Using a number of methodologies the list was validated and the candidate genes were separated into groups, depending on the stability of expression given the stages/conditions tested and concluding that Actin (Act) and Clathrin adaptor complexes medium subunit family protein (CACs) were in fact the most stable of the set.
1.3.4. Molecular markers and population genomics
The selection of high quality trees for propagation can improve productivity and quality of cork and other byproducts, and give some insights into the Quercus genetic inheritance. Present strategies have been focused on molecular markers, like microsatellites, to establish the population genomics of Q. suber. Genome fingerprinting tools using Inter Simple Sequence Repeat (ISSR) and Single Sequence Repeat (SSR) microsatellites, reported as conserved in related species (Bornet and Branchard, 2001) and implemented by Bornet and Branchard (2001) and Löpez-Aljorna et al. (2007), have helped expand the knowledge of the genetic diversity of the species. Special focus was made, in the later report, to the development of a selection procedure of individuals that produced high quality cork, for future propagation efforts. In addition, the implementation of such tools had the objective of identifying hybrid individuals of Q. suber and Q. ilex using SSR markers (Soto et al., 2003). Expanding on this idea Burgarella et al. (2009) documented the frequency of ongoing interspecific gene exchange between two Mediterranean oaks in F1 hybrids using a population genomic strategy, managing to address not only rate of hybridization but also hybrid identity.
Chapter 1. INTRODUCTION
1.3.5. OMICs and Next Generation Sequencing
Before the introduction of NGS, earlier OMICs-based studies were almost non-existent, and information about the genetics, biochemistry and physiology of Q. suber was scarce. Before the first NGS effort there were only about 7,000 ESTs available for Q. suber in NCBI’s dbEST.
Proteomic analysis studies in embryos were carried to identify expression patterns between haploid and diploid stages (Gomez et al., 2009) and in somatic embryogenesis (Gomez-Garay et al., 2013), to aid the difficulties of breeding the species. Also important are findings of cork synthesis-related proteins detected in early stages of development that could lead to the development of markers for cork quality, aiding in selective breeding programmes for cork production and industry.
Possibly the most important development to come out in Q. suber research was the application of high throughput analysis to uncover the species’ transcriptome. A Portuguese nation-wide initiative, the Cork oak ESTs Consortium (COEC), performed the de novo sequencing of the Q. suber transcriptome using 454 sequencing technology. cDNA samples derived from 21 normalized libraries extending multiple tissues, organs developmental stages and physiological/environmental conditions were processed and assemble, identifying ~159,000 unigenes (Pereira-Leal et al., 2014). All sequences, annotation and functional characterization were made available (www.corkoakdb.org). Within this framework, a number of side projects were carried out with the objective of analysing differential expression of the Q. suber transcriptome on non-normalized libraries related to the ones mentioned above. Sebastiana et al. (2014) conducted RNA-seq analysis in roots, comparing tissue inoculated with ectomycorrhizal fungi, Pisolithus tinctorius, and control samples without mycorrhizae. Results suggested that roots undergo extensive remodelling of cell wall, activation of biosynthesis pathway and induction of gene expression related to fungal recognition. Rocheta et al. (2014) conducted similar analysis with the objective of identifying the molecular mechanisms that are involved in flower identity and development. Samples comprised of male and female cDNA libraries in early and late developmental stages. Results highlighted some genes related to pollen development and ovule formation and a few uncharacterised or not previously reported and determinant genes in flowering. One other important study was carried out by Teixeira et al. (2014) to understand differences in transcription prolife between distinct phellogenic tissues, comprising both good and bad 10
Chapter 1. INTRODUCTION
quality cork. RNA-seq analysis sujested that a number of genes related to abiotic stress, especially those related to heat-shock, are responsible for greater quality of cork in Q. suber.
In recent years the GenoSuber project was initiated, aiming to completely sequence the 772 Mbp genome of Q. suber. Illumina sequencing technology is to be used for that purpose and is expected to reach a depth of 63X (www.genosuber.com). This advancement in genomic resources in Q. suber is of great importance, implying major research possibilities, like high depth and resolution RNA-seq experiments, not relying on de novo sequencing, and expanding the range of assays that could be carried out, like epigenetic analysis through bisulphite sequencing or population genomics and phenotype profiling, that really on genomic sequences.
1.4 Next-generation sequencing in non-model plants
Next generation sequencing (NGS) technology is revolutionizing research in distinct areas of biology. The ability to generate massive sequencing libraries with a lower cost and high degree of performance has profoundly affected our research methodologies, moving towards the “OMICs” age. The number of plant genomes being sequenced has been increasing is recent years and has been driving the entering of a genomics age. Accompanying this trend, RNA-sequencing (RNA-seq) has also provided an explosion in the number of information generated by NGS. This method has been replacing other transcriptomics methodologies as the main research tool for RNA expression profiling, surpassing other approaches with high resolution transcriptomes capable of quantifying more accurately and at higher detection limits (Martin et al., 2013). Coupling this analysis with reference genomic data enables rapid acquisition of expression profiles, isoform characterization, annotation improvement, novel gene discovery and polymorphism, using mapping methodologies with reference genome sequences (Mochida et al., 2011). When genome sequences are not available, RNA-seq analysis still enables acquisition of transcriptomic expression profiles and preliminary sequence data, enabling for downstream application and providing important characterization data in non-model plant species (Mochida et al., 2011).
Effective RNA-seq analysis in non-model plant species requires new methods of analysis, as strategies of expression profiling through differential expression analysis require a mapping step based on genome sequences, not available in this group of plant species. Apart from this procedure the RNA-seq workflow is generally the same for transcriptome or
Chapter 1. INTRODUCTION
genome mapping, but important considerations have to be considered. The general outline of the workflow is illustrated in Figure 1.5. and addressed bellow.
Figure 1.5. Overview of the workflow for analysis of RNA-Seq data.
A typical RNA-seq experiment starts with library preparation, that includes steps for cDNA synthesis, fragmentation and sequencing platform specific procedures like adapter ligation. Then, the sequencing step will be performed. At the present state of sequencing technology, Illumina’s platforms are the most commonly applied for RNA-seq. HiSeq platforms allow for a range of sequencing length reads and read sequencing strategies, achieving high sequencing depth and allowing generation of reads suitable for mapping and assembly of highly repetitive genomes/transcriptomes (Van Verk et al., 2013). In the past, the most common platform used in de novo sequencing was Roche’s 454 sequencing, providing the larger read advantage, but nowadays Illumina’s MiSeq platform is catching Roche’s 454 performance, but even at those levels of performance, current HiSeq sequencing depth and 100 to 150bp read length, coupled with pair-end sequencing and improvements in de novo 12
Chapter 1. INTRODUCTION
assembly tools, provide a better alternative to single end long-range strategies adopted in Roche’s 454, due to the higher costs of the platform (Garg and Jain, 2013).
The next step, after receiving the sequences is trimming and cleaning. Adapters, poy(A) tails and low quality reads have to be trimmed and contaminants, such as PCR amplification artifacts, have to be filtered. After quality of reads is assured and artifacts that can conflict with downstream de novo assembly can be carried out. Optimized assembly strategies have been designed for short-reads coming from the Illumina HiSeq platform (Velvet, Oases, AbySS, SOAPdenovo and Trinity), based on kmer assembly (Li et al., 2014; Zhao et al., 2011), and long-read for Roche 454 and Illumina MiSeq platforms (MIRA and Newbler) based on overlay-mapping (Li et al., 2014), but former short-read tools can be applied (Garg and Jain, 2013). Hybrid approaches have also emerged, combining both data types (Martin et al., 2013), that are based on clustering strategies after independent assembly (Garg and Jain, 2013). In either strategies, the assemble transcriptome needs to be able to serve as reliable mapping reference and help with downstream applications like gene categorization or proteome sequencing (Mochida et al., 2011).
Addressing further downstream analysis, a mapping step has to be performed to align reads to reference transcriptomes. For that propose two software tools exist for long and short read libraries and the more popular are BWA and Bowtie (Van Verk et al., 2013), respectively. The quantification step requires a step of summarization for counting the number of reads aligned to each gene/sequence. After that, statistical models can be applied to normalize count data and estimate expression. The most commonly used tool is Cufflinks, which uses RPKM/FPKM normalization (Van Verk et al., 2013) that accounts for differences between sample depth and within-sample differences. This normalization methods have been shown to introduce a bias to differential expression in favor of longer transcripts (Oshlack and Wakefield, 2009). In recent years more suitable methods have been developed accounting for read length bias, as well as the other two sequencing bias mentioned above. Those include median count ratio (DESeq) or TMM (edgeR) (Van Verk et al., 2013).
Further downstream methods include annotation and data-mining using model plant databases and tools, or closely related plant species resources available for such proposes. This can include annotation data, co-expression network assessment, subcellular localization, interaction maps, metabolic pathway mapping and gene family characterization (Mochida et al., 2011). With single-molecule sequencing emerging, the potential to sequence complete transcripts at once without the need of an amplification step or even cDNA synthesis could drastically reduce computation requirements and reduce bias introduced by those methods. 13
Chapter 1. INTRODUCTION
This opens possibilities for whole-genome expression profiling at an unprecedented level of detail.
1.5. Objectives and outline of the thesis
Changes in Mediterranean climate and recent declines to native populations of
Quercus suber are of major concern due to the economic and ecological value of the species.
Recent advancements in sequencing technology and transcriptomics analysis could give an insight into the species response mechanisms to drought, given it is one of the emerging adverse conditions to affect the Mediterranean basin. The main objective of the present work is to uncover drought response mechanisms through RNA-seq analysis at root level, focusing on the regulation, signaling, and downstream mechanisms. Since this species is a non-model organism it lacks many important tools to aid in the subsequent analysis and downstream data mining. To address this issue a de novo assembly approach was adopted to generate a transcriptome, to be used as reference to read alignment steps and ORF discovery. After the determination of differentially expressed genes (DEGs) and general characterization of such genes, further analysis was carried out on the model plant Arabidopsis thaliana, using the DEGs’ homologous genes, thus providing access to the extensive knowledge and tools that are available in this species. To elucidate the mechanisms underlying drought stress responses, in silico analysis was performed through network analysis, cis-element enrichment and transcription factor identification. To confirm RNA-seq results and major contributors to drought response qPCR was performed and key determinants were identified for future studies.
Chapter 2
_______________________________________________
M
ATERIALS AND
M
ETHODS
____________________________________________________________
C
ONTENTS2.1 Plant material and physiological assessments 18
2.2 454 sequencing 18
2.3 Sequence assembly and differential expression analysis 18
2.4 Protein prediction, functional annotation and ortholog assessment 19
2.5 Functional data mining in Arabidopsis 20
2.5.1 Gene Network analysis 20
2.5.2 Transcription factor identification 20
2.5.3 Cis-element enrichment 20
2.5.4 Phylogenetic analysis 20
Chapter 2. MATERIALS AND METHODS
2.1. Plant material and physiological assessments
Quercus suber acorns were supplied by Instituto Superior de Agronomia (ISA,
Lisbon). Acorns were stratified at 4ºC for two weeks and subsequently sowed in a soil mixture consisting of a 2:1:1 volume mix of turf, vermiculite and silicate sand. A total of 123 vases were sowed and grown in a 16 h light/8 h dark photoperiod regime (100 µmol Photon m-2 s-1). After 80 days, drought treatments were initiated. Treatments used 90 plants with the best fitness, divided into eighteen groups, with five plants each. Plants from each group were subjected to five different drought treatments, corresponding to 100%, 90%, 50%, 25% and 10% of the field capacity of the soil mixture, respectively identified as D100, D90, D50, D25 and D10. Watering was performed three times a week. In each group, plants were watered with 100%, 90%, 50%, 25% or 10% of the pot weight loss measured in D100 samples.
Quantum yield of photosystem II (Fv/Fm) was assessed by pulse amplitude modulated
(PAM) fluorometry, after adapting plants to the dark for 15 min, using a portable Pulse Amplitude Modulated fluorometer (Junior-PAM, Gademann Instruments GmbH, Germany). Blue light was used as the light source. For each condition, three healthy leaves were selected in three independent plants, and Fv/Fm was evaluated throughout the drought assay.
Chlorophyll and carotenoid pigments were quantified spectrophotometrically as previously reported (Andralojc 1987). Quantification of L-proline levels in roots was performed using the ninhydrin method, as previously reported (Bates et al. 1973). Commercially available L-Proline was used for a standard curve.
2.2. 454 sequencing
Total RNA was isolated from secondary roots. These were snap-frozen and grinded in liquid nitrogen. Total RNA was extracted following the Hot Borate method (Wan and Wilkins, 1994). Total RNA was further purified using RNAeasy plant mini kit (Qiagen). High quality RNA was sequenced in a Genome Sequencer GS FLX Titanium (Roche-454 Life Sciences, Brandford, CT, USA), according to the standard manufacturer’s instructions at Biocant (Cantanhede, Portugal). Each library (D10/25, D50 and D90/100) occupied one half of a picotiter plate. Raw reads were subsequently subjected to trimming, removal of adapters/primers and low quality reads using the service provider (Biocant) in-house pipeline. 2.3. Sequence assembly and differential expression analysis
De novo assembly was carried out using Newbler (GS De Novo Assembler V2.9,) with default parameters and the resulting assembly file was submitted to the CD-HIT-EST web server (Li and Godzik, 2006; Huang et al., 2010; Fu et al., 2012) to eliminate 17
Chapter 2. MATERIALS AND METHODS
redundancies originated from the de novo assembly. Sequences with less than 100bp were removed and the remaining isotigs and contigs were named as Unigenes. Unigenes were given an accession number using an in-house Pearl script. Sequences were deposited in the National Center for Biotechnology Information (NCBI), under the Short Read Archive (SRA) accession number SRP055382. Coverage for the assembled transcriptome was assessed with BLASTx analysis against the Castanea molissima predicted transcriptome, Quercus rubra Unigene v3 transcriptome from Fagaceae Genomics Web (http://www.fagaceae.org/) and
Arabidopsis thaliana predicted transcriptome (http://www.arabidopsis.org/) with an e-value
threshold of 10-6.
To determine the set of differentially expressed genes (DEGs) between the three experimental conditions, HQ reads from each sequencing effort were mapped against the assembled transcriptome using the Burrows-Wheeler Aligner (BWA) (bio-bwa.sourceforge.net). The algorithm chosen was BWA-MEM as it features long-read support and split alignment that is suitable for 454 reads, and is faster and more accurate when compared to BWA-SW. Parameters were set to promote single alignments for each read. Summarization of results was performed using Tablet (Milne et al., 2012). Venn diagrams were generated using Venny (bioinfogp.cnb.csic.es/tools/venny/index.html). Identification of differentially expressed genes was performed in DESeq (Anders and Huber, 2010) , a software package for R (R. Development Core Team, 2008). Using DESeq we modelled count data using a negative binomial distribution, paring all conditions (D100/D90 vs D50; D25/D10 vs D50; D100/D90 vs D25/D10). We retained unigenes that displayed differential expression (significance value <0.05) in at least one comparison. CDBFasta (http://cdbfasta.sourceforge.net/) was used to retrieve specific fasta sequences from the assembled unigenes file.
DEG unigene lists from all three pairs were subjected to comparison via an online Venn generator (http://bioinformatics.psb.ugent.be/webtools/Venn/). For Hierarchical clustering (HCL; (Eisen et al., 1998)), normalized read counts for each DEG were retrieved from DESeq; HCL was performed by Euclidean distance and average linkage clustering on Multiple Experiment Viewer (MeV v4.0; http://www.tm4.org/mev.htm). Gene clusters were identified using the MeV feature Self Organizing Tree Algorithm (SOTA) (Herrero et al., 2001) by Euclidean distance. Expression plots were rendered considering SOTA clustering and DEGs were separated into UP-regulated and Down-regulated based on Expression plot profile.
Chapter 2. MATERIALS AND METHODS
2.4. Protein prediction, functional annotation and ortholog assessment
Differentially expressed unigenes were subjected to homology search using BLASTX against the non-redundant protein database (nr) with an e-value threshold of 10--6
(Supplementary File S1). The ORF Predictor
(http://proteomics.ysu.edu/tools/OrfPredictor.html) tool was used to identify open reading frames (ORFs). For this purpose, BLASTX results and nucleotide sequences were uploaded to the ORF Predictor server, so frame shift errors and incomplete sequences could be accounted for. Corrected CDS and protein sequences were retrieved for later analysis. Nucleotide sequences were also analyzed using the Blast2GO pipeline (Conesa et al., 2005) using standard settings and the local BLASTX previously generated. To establish Arabidopsis
thaliana orthologs, DEG protein sequences were subjected to BLASTp analysis (e-value of
10-6) against the reference Arabidopsis thaliana TAIR10 annotation (www.arabidopsis.org).
Only the gene model was considered for later analysis. 2.5 Functional data mining in Arabidopsis
2.5.1 Gene Network analysis
Gene networks were predicted in Cytoscape, using the Genemania plugin. Network layouts were as follows: functional features, Prefuse Force-Directed Layout; sub-cellular localization, Edge-weighted Spring Embedded Layout; co-expression, Prefuse Force-Directed Layout. Default parameters were used but changes were made so that only the DEG list was considered for analysis. For functional network prediction Gene Ontology co-annotation was used to highlight clusters or genes of interest. For co-localization network, GO ontology annotation of DEG orthologs was carried by AgBase database web server (http://agbase.msstate.edu/). Genes were mapped for the second GO slim level and given distinct colours within the predicted network.
2.5.2 Transcription factor identification
TFs were identified from Arabidopsis DEG orthologs using the AGRIS (Davuluri et al., 2003) Arabidopsis transcription factor database (AtTFDB, http://arabidopsis.med.ohio-state.edu/AtTFDB/), MapMan (transcription pathway bin; (Thimm et al., 2004; Usadel et al., 2005; Usadel et al., 2009)), and manual curation
2.5.3 Cis-element enrichment
Cis-element enrichment analysis was carried using AtCOECis (Vandepoele et al.,
2009) and Athena (O'Connor et al., 2005), with default parameters.
Chapter 2. MATERIALS AND METHODS
2.5.4 Phylogenetic analysis
For each class of transcription factors (TFs), we used automated gene family annotation to retrieve the a.a. sequences of all family members present in the Arabidopsis
thaliana genome. For that purpose the Plaza web-based platform (version 2.5; (Proost et al.,
2009; Van Bel et al., 2011)) was used. Phylogenetic analysis was performed in SeaView v4.5. (Gouy et al., 2010) Sequences of Q. suber differentially expressed family members and Arabidopsis family members were aligned with the MUSCLE algorithm (Edgar, 2004). The PhyML v3.1 (Guindon et al., 2010) feature of Seaview was used to compute maximum likelihood trees using the LG substitution model (Le and Gascuel, 2008), with branch support using the aLRT SH-like method (Anisimova and Gascuel, 2006).
2.6 Quantitative Real-Time PCR
For quantitative Real-Time PCR (qPCR) analysis, a second independent drought induction assay was performed, and total RNA was isolated from secondary roots by a CTAB-based method adapted from Azevedo et al. (2003). RNA quantity and quality were assessed using a Nanodrop ND-1000 spectrophotometer and electrophoretic analysis. RNA samples were treated with Recombinant DNase I (Takara Biotechnology), and cDNA was subsequently generated using a Superscript III Reverse Transcriptase Kit (Invitrogen). For qPCR reactions, Ssofast Evagreen Supermix (Bio-Rad) was used according to the manufacturer’s indications. Reactions used 1:20 cDNA dilutions. Analysis was run in a CFX96 Touch Real-Time PCR Detection System (BIORAD), as per the manufacturer’s instructions. Relative expression was determined by the Pfaffl’s equation (Pfaffl, 2001), normalizing with PP2A gene. Values were calculated between severe drought conditions (D25/10) and well watered conditions (D100/90).
Primers for qPCR were designed using NCBI Primer-BLAST (Ye et al., 2012) and design for product length amplification of 100 to 200 bp, ~60ºC on Tm and 50 to 60% of GC content.
Primers are listed below:
Table 2.1 – List of quantitative qPCR primers. Primers were designed to ensure specific amplification,
100-200 bp amplification products, and ~60ºC Tm.
Gene Name (Unigene ID)
Primer Sequence (5' to 3') Length (nt) Tm (ºC) Product size (bp) QsHAI2 CAGGTGGTCGGGTCATCTAC 20 60.4 181 (QSDrought_01105) ATCACGTCCCAAAGCCCATC 20 59.5 20
Chapter 2. MATERIALS AND METHODS Table 2.1 (Continued) QsHAI3 GTTCTGGGAATTTCGACTGGG 21 60.1 176 (QSDrought_03606) CCACTCTGAACCTCGTCATCC 21 58.9 QsSNRK2.6 AGCGGAATGAAGAGCCAGAG 20 60.6 170 (QSDrought_03551) GAGCCTGTCCACCACACTTC 20 59.8 QsABF2 TCGGATCCAAGAAGCTGGTG 20 60.9 165 (QSDrought_02295) CGCTCGCCAGGATTAGACAC 20 59.8 QsRD29B GCCAAGAGGATCACACTCCC 20 59.8 167 (QSDrought_03061) TCTCCTGGCATCTTTGCCTC 20 60.1 QsRD26 ACAGCCACTCTTCCCCAAAC 20 59.8 175 (QSDrought_03374) CCTACCCTGCCAATTCCTCC 20 60.2 QsCOR47 GTAGATGAACATGGGCCCCG 20 60.3 145 (QSDrought_05686) CACCGCCATGAGTAGGTACG 20 60.5 QsNCED3 TGCATGACTCCAGCTGACTC 20 60.3 176 (QSDrought_05518) TTCCTTCCAAGCCTGTTCCG 20 59.8 QsXTH15 CCCTTCCCTAAGAGCCAACC 22 59.9 179 (QSDrought_06025) TGCCATGTAGAATCGGAGGAAG 20 59.7 QsNAC100 AAGGGTAGAGCCCCAAAAGG 22 58.1 111 (QSDrought_06406) CAGTCTCCAGTCTCACTATCCC 20 60.1 QsPP2A-3 GGGTTCCCAACATCAAGTTC 20 56.6 174 (QSDrought_03365) TGACCTGATCACTTGACTGC 20 57.5 21
Chapter 3
_______________________________________________
Results and discussion
____________________________________________________________
C
ONTENTS3.1 Physiological response to long-term drought 25
3.2 Assembly of the Quercus suber root transcriptome 26
3.3 Differential expression analysis of the drought root transcriptome 30
3.4 Annotation of differentially expressed genes 32
3.5 Functional data mining of DEGs 36
Chapter 3. RESULTS AND DISCUSSION
3.1. Physiological response to long-term drought
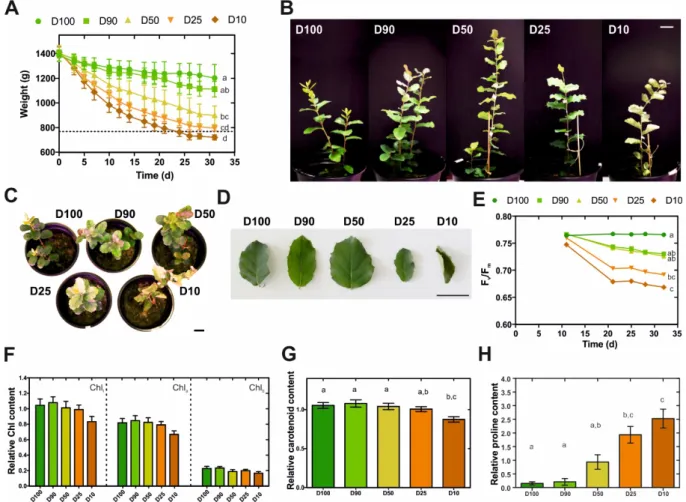
In the present work, the cork oak root-level response to drought was investigated at the transcriptional level by an RNA-Seq approach. Prior to transcriptional analysis, Q. suber plantlets were subjected to prolonged drought stress and characterized in their morphological and physiological responses. More specifically, 80-day-old plantlets were subjected for one month to five different watering regimes (herein designated D100, D90, D50, D25 and D10), that restored 100%, 90%, 50%, 25% or 10% of the water lost between watering periods. This imposed a progressive loss in water availability (Figure 3.1A), resulting in moderate to extreme drought stress over an extended period of time. The consequences of drought stress imposition were visible in leaf morphology, with leaves displaying increasing stress-related symptoms such as leaf area drop, leaf rolling, edge and tip necrosis, and changes in colouration observable as reddening and yellowing (Figure 3.1B-D). In order to support morphological data, we monitored alterations to plant fitness throughout the treatment period using Pulse-amplitude-modulation (PAM) fluorometry, since this technique has been successfully used to study alterations in photosynthetic electron transport in vivo (Sixto et al., 2006; Papageorgiou, 2007), measuring photosynthetic performance determined by the Fv/Fm
parameter (maximum quantum efficiency of PSII photochemistry). Here, we could observe that a progressive loss in efficiency of PSII was visible for all major drought treatments, especially for D25 and D10 (Figure 3.1E). This may relate to loss in stability of the PSII and degradation in photochemical activity of this system under water stress (Havaux, 1992). Our results are also consistent with other studies in oak species undergoing water deprivation, in which a decrease in Fv/Fm was observed (Epron et al., 1993; Méthy et al., 1996). In addition,
we estimated chlorophyll and carotenoid contents in leaves at the end of the experiment, observing a reduction in both pigments that was proportional to the severity of the drought treatment (Figure 3.1F, G). Overall results are consistent with previous reports that associate molecular and physiological responses to water deficit to chlorophyll bleaching, decline in photosynthesis, accumulation of carotenoid-like molecules, remobilization of nutrients, dismantling of cellular organelles, and programmed cell death events (Shao et al., 2008). Finally, to confirm drought stress imposition we quantified root proline content. Proline is a standard indicator of low Ψw caused by environmental stresses, acting as a compatible solute
that accumulates to high concentrations following decreases in water availability (Singh et al., 1972; Ibarra-Caballero et al., 1988; Lambers et al., 2008). In the present report we were able to observe a significant and dose dependent increase in the proline content of drought-stressed
Q. suber roots (Figure 3.1H), thus confirming the imposition of drought stress. Overall, we
Chapter 3. RESULTS AND DISCUSSION
clearly established that in our physiological model, different watering regimes matched different intensities of long-term drought stress imposition.
Figure 3.1. Characterization of morphological and physiological traits of Q. suber plantlets subjected
to long-term drought stress.
(A) Eighty-day-old plantlets were subjected to five different watering regimens (D100, D90, D50, D25, D10) for one month; pot weight was determined before each watering period, (n=6).
(B-C) Plant (B, C) and leaf (D) morphology at the end of the drought stress period.
(E) Effect of each watering regimen in the quantum yield of photosystem II (Fv/Fm), (n=9).
(F) Total chlorophyll (Chlt), chlorophyll a (Chla) and chlorophyll b (Chlb) contents at the end of the drought stress period, (n=15).
(G) Carotenoid content at the end of the drought stress period, (n=15).
(H) Quantification of L-proline in Q. suber roots at the end of the drought stress period, (n=15) Letters represent statistically similar results (one-way ANOVA with post-hoc Tukey test to compare all columns; p>0.05). Scale bars represent 3 cm.
3.2. Assembly of the Quercus suber root transcriptome
We were involved in a nation-wide initiative, the Cork oak ESTs Consortium (COEC) that performed de novo sequencing of the Q. suber transcriptome by 454 NGS (www.corkoakdb.org/, (Pereira-Leal et al., 2014)). Within this initiative, we performed an RNA-Seq analysis of the Q. suber root response to long term drought. RNA was extracted 26
Chapter 3. RESULTS AND DISCUSSION
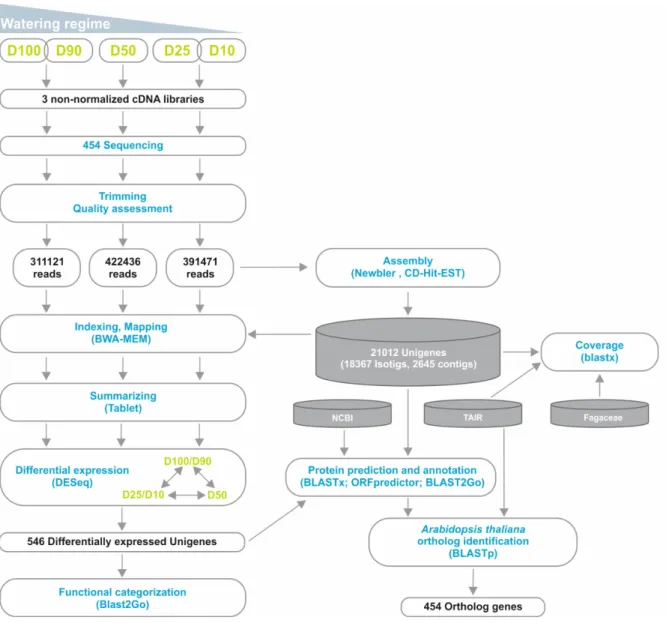
from roots of plantlets subjected to different water usage conditions (D100+D90, D50 and D25+D10), and used to generate non-normalized libraries that were then sequenced by 454 GS FLX Titanium technology, using half-plate runs for each experimental condition (Figure 3.2).
Figure 3.2. Outline of the RNA-Seq strategy employed in the identification of the Q. suber differential
root transcriptome in response to long-term drought. Functional characterization was extended by identification of Arabidopsis thaliana orthologs for the differentially expressed genes.
Results from the sequencing effort are presented in Table 3.1. Raw read number (1.8 million) and length (~400 bp) followed expected standards for this technology. Raw reads were subjected to a pre-processing/trimming step to remove short or low quality sequences and adaptor/primer sequences. High quality (HQ) reads amounted to 88.1% of original reads, and totalled 470.8 Mbp (Table 3.1). HQ reads displayed no significant differences in number 27
Chapter 3. RESULTS AND DISCUSSION
or length frequency, between different drought stress regimes (Table 3.1; Figure 3.3A), corroborating the quality of the cDNA library and sequencing processes. Subsequently, we assembled a reference transcriptome using HQ reads, resulting in a total of 22,455 raw sequences; these were uploaded to the CD-HIT-EST web server (Li and Godzik, 2006; Huang et al., 2010; Fu et al., 2012) for clustering and redundancy elimination, resulting in 21,012 unigenes of which 18,367 were isotigs and 2,645 were contigs (Figure 3.2, Table 3.1). Frequency analysis demonstrated that the assembled unigenes were as long as 2,600 bp, averaged at 759 bp and peaked in the 400-500 bp range (Figure 3.3B).
Table 3.1. -Statistics of the sequencing and assembly steps.
D100/D90 D50 D25/D10 Total Raw reads Number 686,891.00 620,615.00 501,296.00 1,808,826.00 Total Number of Bases 270,949,869.00 250,845,326.00 198,528,142.00 720,323,337.00 Average length (bp) 394.60 404.30 396.00 398.30 Processed reads Number 548,456.00 601,692.00 442,674.00 1,592,822.00 Total Number of Bases 163,984,625.00 172,383,797.00 134,446,167.00 470,814,589.00 Average length (bp) 299.00 286.50 303.70 296.40 Assembly Number of Contigs - - - 2,645.00 Number of Isotigs - - - 18,367.00 Number of Isogroups - - - 19,579.00 Number of Unigenes - - - 21,012.00
For quality validation, assembled transcriptome coverage was established against the
Quercus rubra Unigene V2 transcriptome, Castanea molissima predicted transcriptome and Arabidopsis thaliana transcriptome (Figure 3.4). Results demonstrated that the assembled Q. suber transcriptome had a very high coverage, with matches representing between 50-67% of
previously established transcriptomes, and 86.5% of the Q. suber assembled transcriptome. Together with other recent Q. suber 454 RNA-Seq efforts, results also suggest that Newbler-based assembly (present report; (Rocheta et al., 2014; Teixeira et al., 2014) is more suited for 454 libraries that MIRA-based assembly (Pereira-Leal et al., 2014; Sebastiana et al., 2014), 28
Chapter 3. RESULTS AND DISCUSSION
since the latter studies presented poorer contig metrics. This supports the previous claim that Newbler outperforms other assemblers with regards to 454 pyrosequencing data (Kumar and Blaxter, 2010).
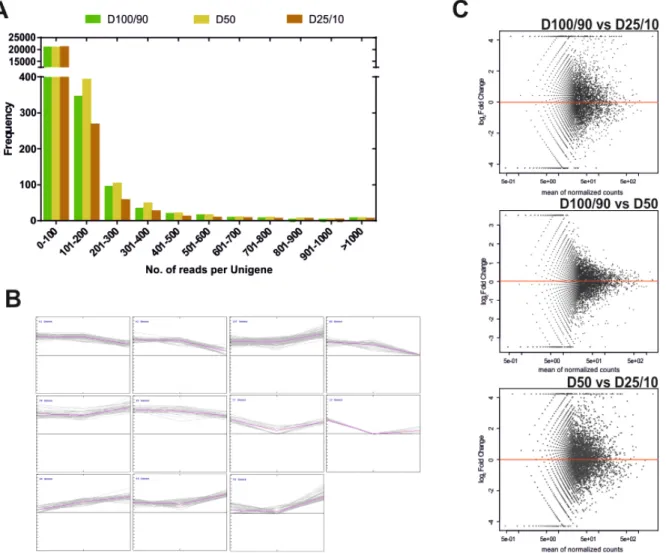
Figure 3.3. Characterization of sequence data regarding processing and assembly of reads.
(A) Distribution of the length of HQ reads obtained for each watering regime. (B) Distribution of the length of unigenes obtained after assembly.
Figure 3.4. Venn diagram representation of the number of homology hits (e<10-6) between Q. suber
unigenes and Arabidopsis thaliana TAIR 10 gene models, Q. rubra putative transcripts and the Castanea mollissima predicted transcriptome. Percentages indicate the proportion of reference transcriptomes that match Q. suber unigene models.