Licenciado em Ciências da Engenharia
Investigating the potential of energy flexibility in
an office building with façade BIPV and a PV
parking system
Dissertação para obtenção do Grau de Mestre em
Engenharia Electrotécnica e de Computadores
Orientadora: Doutora Laura Elena Aelenei, Investigadora,
Laboratório Nacional de Energia e Geologia
Co-orientador: Doutor João Murta Pina, Professor,
Faculdade de Ciências e Tecnologia, Universidade Nova de Lisboa
Júri
Presidente: Professor Doutor Mário Fernando da Silva Ventim Neves - FCT/UNL
Arguente: Professor Doutor Pedro Miguel Ribeiro Pereira - FCT/UNL
During this thesis, I had the chance of getting the help of a lot of people, in different ways.
In first place, I would like to give my greatest thank to my coordinators Dr.Laura Aelenei and Professor João Murta Pina. I also have to thank Professor Daniel Aelenei and Rui Lopes who helped me, in technical terms, to take the right path towards the aim of the thesis. Naturally, I thank Faculdade de Ciências e Tecnologia da Universidade Nova de Lisboa for these years of new experiences and consolidated knowledge. I thank to eng. Luís Alves Pereira from IAPMEI for providing me some exceptional data essential to the thesis. In Solar XXI, I had the help of eng. Ana Rute Ferreira, eng. Carlos Rodrigues and Ruben Alves who I thank for the patience and all the given support.
Building Integrated Photovoltaic (BIPV), is becoming an attractive solution in the context of high penetration of photovoltaic systems in buildings caused by the strive to achieve net or nearly zero energy status. Besides retrieving solar radiation to produce electrical energy,BIPValso offers aesthetical advantages because of its architectural
fea-ture. However, when integrated into vertical façades, the angle of thePhotovoltaic (PV) modules may considerably affect the efficiency ofBIPVwhen compared with horizontally
oriented modules in the same location and latitude.
This work reports on the electric energy performance of an office building, Solar XXI,
located in Lisbon, Portugal, based on the opportunity of having twoPVtechnologies in the same building. The system installed on the south façade is aBIPV(12 kWp) and the second is a parking lotPVinstalled in a nearby car park facility (12 kWp). This situation enables the comparison of Load Match Factors, but mainly Load Match Index, between the two systems. The use of small scale loads in energy flexibility operational measures to study the potential for flexible demand on anNet-Zero Energy Building (NZEB)office
building is also possible. Two different scenarios were taken into development, from
monitoring data obtained during March 2016 (winter period) and July 2016 (summer period).PVGISis a tool used to verify the possibility of aPVoptimization in the parking lotPVandEnergyPlus is used to create an energy consumption model of the building aiming to be validated by the real values.
Keywords: BIPV, Load Match Factors, Energy Flexibility, Load Shifting, Energy Efficiency
Building Integrated Photovoltaic (BIPV) começa a ser uma solução atractiva no con-texto de sistemas fotovoltaicos em edifícios, tendo por objectivo atingir o estatuto de edifício zero ou quase zero em termos energéticos. Além do uso da radiação solar para produção de energia elétrica, o BIPV tambem oferece vantagens estéticas, tendo em conta a sua arquitectura. Quando integrado em fachadas verticais, o ângulo dos módulosPV pode afetar consideravelmente a eficiência doBIPVface a módulos orientados vertical-mente na mesma localização e latitude.
Este trabalho descreve a performance energética de um edifício de serviços, o Solar XXI, localizado em Lisboa, Portugal, baseado na oportunidade de ter duas tecnologias PV no mesmo edifício. O sistema instalado na fachada virada a sul é umBIPV(12 kWp) e o segundo um PVinstalado no parque de estacionamento do edifício (12 kWp). Esta situação permite a comparação entre os dois sistemas em termos deLoad Match Factors, mas essencialmente deLoad Match Index. É também possível utilizar pequenas cargas em medidas operacionais de flexibilidade energética com o objectivo de estudar o potencial desta flexibilidade. Dois cenários diferentes são apresentados, sendo que foram desenvol-vidos a partir da recolha de dados obtidos em Março 2016 (Período de Inverno) e Julho 2016 (Período de Verão). A ferramentaPVGISé utilizada para verificar uma possível opti-mização a fazer noPVdo parque de estacionamento e oEnergyPlusé usado para criar um modelo de consumo energético do edifício com o objectivo de ser validado pelos valores reais.
List of Figures xiii
List of Tables xv
Acronyms xvii
1 Introduction 1
1.1 Motivation . . . 1
1.2 Objectives . . . 2
2 State of the Art 3 2.1 Net Zero Energy Building - NZEB . . . 3
2.1.1 Conventional definitions . . . 4
2.1.2 NZEB: Design . . . 6
2.1.3 NZEB Boundaries . . . 11
2.1.4 Grid Interaction, Net Zero Balance and Load Matching in ZEB . . 12
2.1.5 ZEB known cases . . . 18
2.2 Energy Flexibility . . . 21
2.2.1 The importance of Flexibility . . . 22
2.2.2 Flexibility Potentials and Time Scales. . . 23
2.2.3 Operational measures to increase flexibility . . . 24
2.2.4 Methodologies to quantify Energy Flexibility . . . 27
3 Case Study: Solar XXI 29 3.1 Heat Systems . . . 30
3.1.1 Heating Strategies. . . 30
3.1.2 Cooling Strategies . . . 31
3.2 Sunlight Systems . . . 33
3.2.1 Renewable Energy Systems . . . 33
3.3 Building Design and Energy features . . . 34
3.4 Electrical panel boards description . . . 36
4.1.1 Consumption and Generation data collection corresponding to
win-ter and summer periods . . . 37
4.1.2 Annual consumption-generation contrast . . . 38
4.1.3 Seasonal load diagrams . . . 39
4.1.4 Consumption vs. generation diagrams . . . 40
4.1.5 Energy consumption: characterization of user’s behaviour. . . 41
4.2 Numerical Analysis . . . 43
4.2.1 EnergyPlusmodel description, evaluation and calibration . . . 43
4.2.2 PVGISsimulations . . . 47
4.3 Net Zero Balance and Load Matching analyses of Solar XXI . . . 48
4.3.1 Net Zero Balance . . . 48
4.3.2 Load Matching and respective indicators. . . 50
4.4 Solar XXI Energy flexibility . . . 55
5 Results and Discussion 59 5.1 Load Match Diagrams. . . 59
5.2 Energy consumption: characterization of user’s behaviour outcome. . . . 61
5.3 EnergyPlus model validation. . . 62
5.4 PV analysis through PVGIS model validation . . . 65
5.5 Load Matching and respective indicators results. . . 67
5.6 Load Shifting outcome . . . 72
5.6.1 Load Matching after Load Shifting . . . 74
5.6.2 Load Matching after PV arrays orientation variation . . . 75
6 Conclusions 77 6.1 Achievements and improvements . . . 77
6.2 Future work . . . 79
6.3 Original Contributions . . . 79
Bibliography 81 A Appendices 87 A.1 Chauvin Arnoux 8334B model Datasheet. . . 87
A.2 Solar XXI Energy Use Survey. . . 88
A.3 Solar XXI BIPV modules Datasheet . . . 89
2.1 NZEB example of a primary school in Italy. . . 4
2.2 Overview of the three main design issues. . . 8
2.3 Selected Energy saving measures applied in Net ZEBs . . . 9
2.4 Baruch Givoni Psychrometric Chart . . . 10
2.5 Overview of possible renewable supply options . . . 12
2.6 Graph representing theNet Zero Balanceconcept . . . 15
2.7 Load Matching (LM) behaviour with 10 minutes time resolution considering an annual balance line . . . 16
2.8 Graphical representation highlighting the three previously mentioned types of balance. . . 17
2.9 Map of ZEB examples across the world . . . 18
2.10 Cross-Case Analysis of Annual Primary Energy Balance . . . 20
2.11 Illustration of different approaches to Demand Side Management. . . 24
2.12 Illustration of the different load flexible classes . . . 26
3.1 Representation of the Case Study: Solar XXI . . . 30
3.2 BIPV-T system used as a heat recovery system . . . 31
3.3 Earth-Tubes system used as a main cooling strategy . . . 32
3.4 Representation of natural light for winter and summer periods . . . 33
3.5 Scheme composing Solar XXI main characteristics . . . 34
3.6 Display of the electrical panel boards diagram of the building . . . 36
4.1 Solar XXI comparison between energy consumption and generation . . . 38
4.2 Load diagram of the electrical panel of 1st floor (Q.P1) for summer period . 39 4.3 Load diagram of Power Consumption of the building for winter period . . . 39
4.4 Load diagram of roof’s electrical panel (Q.COB.) for summer period . . . 40
4.5 Load Diagram of consumption and generation on the 2nd of March represent-ing a winter day . . . 40
4.6 Load Diagram of consumption and generation on the 12th of July representing a summer day . . . 41
4.7 Office example display highlighting some energy use features . . . 42
4.9 Representation of Solar XXISketchUpmodel composed by three figures, one
for each floor . . . 43
4.10 OriginalSketchUpModel of Solar XXI. . . 44
4.11 Display of Solar XXIEnergyPlusmodel classes edition . . . 45
4.12 Display of Solar XXIEnergyPlusmodel fields edition . . . 46
4.13 PVGISonline calculator representation . . . 47
4.14 Solar XXI monthly energy balance . . . 48
4.15 Load diagram of Power Balance of the building for winter period . . . 49
4.16 Schematic view of the energy flows in an all-eletricity NZEB . . . 52
4.17 Load Match Index with BIPV and parking lot PV for winter period . . . 56
4.18 Load Match Index with BIPV and parking lot PV for summer period . . . 56
4.19 Installation of the measurement of the laptop charging period . . . 57
5.1 Load Matching representation considering BIPV and parking Lot PV for win-ter period . . . 60
5.2 Load Matching representation considering BIPV and parking Lot PV for sum-mer period . . . 60
5.3 Survey results for the winter period . . . 61
5.4 Survey results for the summer period . . . 62
5.5 Comparison between real and estimated energy consumption values per month of Solar XXI . . . 63
5.6 Share of Lights and Equipment in Solar XXI on an annual basis . . . 64
5.7 Comparison of the share of Lights and Equipment in March and July weeks . 64 5.8 BIPV comparison between real and simulated values . . . 65
5.9 Parking Lot PV comparison between real and simulated values . . . 65
5.10 Parking lot PV analysis before and after angle variation . . . 66
5.11 Load Match Index for the winter period . . . 68
5.12 Load Match Index for the summer period . . . 68
5.13 Cumulative Weekly Data with BIPV and parking Lot PV for winter period . 70 5.14 Cumulative Weekly Data with BIPV and parking Lot PV for summer period 70 5.15 Average of Energy Load-Generation for winter period . . . 71
5.16 Average of Energy Load-Generation for summer period . . . 71
5.17 Graphic showing the behaviour of a Laptop Charging for around 1 hour . . . 72
5.18 Graphic showing the behaviour of a Computer consumption for around 3 hours 72 5.19 Load Diagram showing the Load Shifting operational method applied for win-ter period . . . 73
5.20 Load Diagram showing the Load Shifting operational method applied for sum-mer period . . . 74
A.1 Chauvin Arnoux 8334B Technical Description . . . 87
2.1 ZEB Renewable Energy Supply Option Hierarchy . . . 13
2.2 ZEB worlwide examples I. . . 19
2.3 ZEB worlwide examples II . . . 19
2.4 ZEB worlwide examples III . . . 20
3.1 Constructive characteristics of Solar XXI . . . 30
3.2 Daily average values of energy produced and consumed in Solar XXI until 2009 35 5.1 Study over the optimization of the parking Lot PV modules . . . 66
5.2 Load Matching Indicators in winter . . . 67
5.3 Load Matching Indicators in summer . . . 67
5.4 Average Load Charging Consumption(ALCC) and Desktop Consumption(DC) values . . . 73
5.5 Load Matching after Load Shifting . . . 74
ASHRAE American Society of Heating, Refrigerating and Air-Conditioning Engineers.
BAU Business as Usual.
BIPV Building Integrated Photovoltaic.
BIPV-T Building Integrated Photovoltaic - Thermal.
CD Cooling Dominated challenge.
CHP Combined Heat and Power.
DER Distributed Energy Resources.
DR Demand Response.
DSM Demand Side Management.
EES Energy Efficient Systems.
EPBD Energy Performance of Buildings Directive.
GHP Ground Source Heat Pumps.
GI Grid Interaction.
HCD Heating and Cooling Dominated challenge.
HD Heating Dominated challenge.
HVAC Heating, Ventilation and Air Conditioning.
LED Light-Emitting Diode.
LM Load Matching.
LMI Load Match Index.
LOLE Loss of Load Expectation.
LOLP Loss of Load Probability.
MPC Model Predictive Control.
nZEB Nearly Zero Energy Building.
NZEB Net-Zero Energy Building.
OCP Optimal Control Problems.
PA Passive Approach.
PV Photovoltaic.
RES Renewable Energy Systems.
SWH Solar Water Heating System.
TES Thermal Energy Storage.
var-RE Variable Renewable Energy.
C
h
a
p
t
e
1
I n t r o d u c t i o n
1.1 Motivation
Nowadays Energy Efficiency in buildings is a more and more important subject, mainly
because of the significant share that buildings have on the energy consumption scale. Finding solutions to this problem is a major objective from the scientific community, particularly on both renewable energies and building construction fields, hence a good interaction between this two becomes a crucial, at some extent necessary, matter. The enhancement of this same interaction follows the growth of an important concept, the concept ofNZEB.
The work developed within this master thesis aims to reinforce the improvement of Energy Efficiency in Buildings, with the focus given to a particular study case - Solar XXI
1.2 Objectives
In this thesis, the main questions put into discussion are the potential for flexible demand in an office building with two differentPVtechnologies, façadeBIPVand a parking Lot
PV, and their interaction in a matter ofLoad Match Index (LMI), for winter and summer periods. The State of the Art in the following chapter has the task of introducing all the meaningful concepts for the work, being Solar XXI, described in chapter3, the study case for it.
Chapter4is a comprehensive outline of the methodology used to understand all the process, where an energy analysis is performed in detail with a time resolution of 15 minutes, to better interpret the load behaviour at the building. By taking the chance of having real data from two differentPVtechnologies, it becomes possible to perform all
the calculations useful to studyLM.
EnergyPlusandPVGISare tools implemented to simulate, respectively, real consump-tion and generaconsump-tion values of the building.PVGISalso has the function of investigating the optimization of thePVgenerated values.
Load Match Factors are essential to verify the different behaviour between twoPV
technologies to the same consumption values. To ascertain the building interaction with the distribution grid,LMI’s have to be calculated to describe the degree of use of on-site energy generation related to the local energy demand. LMalso checks if the optimization of the energy consumption by its user, is possible to achieve through energy consumption reduction measures.
The scope of Load Shifting is to validate the potential of the building energy flexibility as an operational measure ofDemand Side Management (DSM), and to show how much flexibility is available at a given instant or interval of time during a day. PVgenerated energy is not 100% reliable because it is dependent on natural factors, meaning that energy flexibility can also help on avoiding periods of overproduction.
The aggregatedLMand Energy Flexibility studies give a robust analysis on how good can the use of thisNZEBbe, as discussed in chapter5.
The general scope of goals of this thesis, having in mind the work projected at Solar XXI, is given below.
Experiment at Solar XXI
• Perform detailed energy analysis using energy analysers with 15 minutes time reso-lution
• Use ofEnergyPlussoftware and a survey to model the annual energy consumption
• Calculate Load Matching Factors using the detailed energy analysis data
C
h
a
p
t
e
2
S t a t e o f t h e A rt
The State of the Art comprehends the objective of displaying all the relevant concepts linked to the work, found out through an exhaustive literature review, containing a slight description of the main concepts to be accounted in the work. This is followed by an overview of theNZEBconcept, with an extent set of known cases, finishing with central information regarding energy flexibility.
2.1 Net Zero Energy Building - NZEB
A realNZEBcan be defined, as a building that is able to produce the same amount of en-ergy as its consumption. The periodicity is an essential point regarding the benchmarking of this relation.
Such buildings need to have a particular care in a matter of energy efficiency during
the design period, and this particular requirement gives the possibility to reach the gen-eralNZEBdefinition. With low energy consumption and good energy generation through renewable energies, it is possible to achieve the zero balance expected value.
As highlighted before the time resolution is critical when it comes to energy variations in a NZEB. The relationship between energy generation and consumption can be, for example, daily, or yearly, which is the typically employed time fraction, and in addition covering all the operation settings concerning the meteorological conditions is essential. Even if the building can produce a high amount of energy by renewable technologies, in order to be considered aNZEB, the consumption levels also need to be low, always depending on its users.
in United States of America [1]. Other data shows that the energy used by the construction sector continues to increase, electrical energy consumption in the commercial building sector doubled between 1980 and 2000 and is expected to increase another 50% by 2025 [1].
Europe has been giving more importance and credibility to NZEBs. The proof is thatEnergy Performance of Buildings Directive (EPBD)recast established that all state members of European Union have to guarantee from 2021 on that all new buildings need to be Nearly Zero Energy Building (nZEB). From 2019 on all the new public buildings need to be as wellnZEB[2]. Figure 2.1shows an exceptional example of a public building considered a NZEB presented in Subtask C of Solar Heating and Cooling Programme of the International Energy Agency [3].
Figure 2.1: NZEB example of a primary school in Italy [4]
2.1.1 Conventional definitions
A variety of authors definedZero Energy Building (ZEB)differently depending on the
objectives to achieve and its characteristics.
According to Torcellini [5] the definition of a ZEB is a residential or commercial building with greatly reduced energy needs, through efficiency gains and construction
techniques using renewable resources instead of fossil fuels. Iqbal [6] definesZero energy homeor aResidential Zero Energy Buildingin a similar way but considering only residential buildings.
Globally, fourZEB definitions can be coined [5] [7],Net Zero Site Energy, Net Zero Source Energy,Net Zero Energy CostandNet Zero Energy Emissions.
Net Zero Source Energyis aZEBthat produces at least as much energy as it uses in a year when accounted for at the source. Source energy refers to the primary energy used to generate and deliver the energy to the site. To calculate a total source energy of the building, imported and exported energy is multiplied by the appropriate site-to-source conversion multipliers or energy carriers [5].
Net Zero Energy Costsis aZEBwhere the amount of money, that the owner receives, for the energy that the building exports to the grid, is at least equal to what this owner pays for the energy used over the year [5].
Net Zero Energy Emissionsis a building that produces at least as much emissions-free renewable energy as it uses from emissions-producing energy sources [5]. If the build-ing is over a year carbon neutral, it is consideredZero Carbon Building. These buildings can use electrical energy produced by CO2 free sources, such as large windmills,
nu-clear power, andPVsolar systems which are not integrated into the buildings or at the construction site [8].
Nevertheless, other authors defined different kinds ofZEB. Kilkis [9] explained a
con-cept calledNet Zero Exergy Buildingwhere quantity and quality (exergy) are considered. ANet Zero Exergy Buildinghas a zero annual balance of exergy transfer, during all electric transfer, in a certain period of time, across the “building-district boundary in a district energy system”.
The European Union Commission and Parliament have, in their recast of the Directive on the Energy Performance of Buildings [2], definedZEB as “a building that has a very high energy performance, determined in accordance with Annex I”. In Europe each country is giving its ownnZEBdefinition regarding its position, necessity and objective having in mind the previous mentioned recast [10]. AnZEBshould be covered by energy from renewable sources, including renewable energy produced on-site or nearby [2].
Laustsen [8] defined buildings depending on the kind of grid connection, where they can be ‘self-sufficient’, ‘autonomous’ or ‘standalone’. A good definition for Zero Stand
Alone Buildingscould be “a building that does not require connection to the grid or only as a backup”. This building has the supply capacity of all the energy that it needs and also to storage for night-time or winter time use.
The on-gridZEB, also known asNet Zero Energy,Grid ConnectedorGrid Integrated, is always connected to one or more energy infrastructures, as electrical energy grid, district heating, and cooling system, gas pipe network, biomass, and biofuels distribution net-works [7]. Therefore, it has the possibility of both purchasing energy from the grid and injecting energy to the grid.
Salom [11] also referred a concept related to ZEB called “prosumers” where these buildings are not only consumers but at the same time producers of heat and electrical energy.
depending on the aim of its construction in terms of energy efficiency.
2.1.2 NZEB: Design
As discussed in the previous section2.1.1, renewable sources inNZEBare fundamental to achieve most of the conventional definitions. The renewable sources can either be available on the site (e.g. sun, wind) or need to be transported to the site (e.g. biomass) [7]. The integration of these renewable sources is directly connected with the levels of comfort, efficiency and some of the NZEB characteristics. This integration also brings further
issues concerning the interaction with the grid which will be reviewed in subsection 2.1.4.
Even if the investment in renewable energy generation in buildings is growing this proves not to be enough to reach a generic definition ofNZEB. For that, on the design and construction stage, the building has to consider a big amount of characteristics to make possible the energy consumption reduction to maximum levels.
The building features should include, form and sun exposure; isolation of the walls, floor, and roof; window type and ventilation system.
The building’s need to warm up in the winter and cool down in the summer is directly connected to all these design features. Its sun orientation in winter allows the interior comfort levels to rise, reducing the energy consumption in warm systems. The opposite situation also happens in the summer. The isolation of the walls and windows and the type of floor and roof are as well important to the energy balance, as these characteris-tics allow to maintain high temperatures inside the building in the winter and the high temperatures outside in the summer.
No less important are the kind of warm up and cool down systems. The most used and known are central heating andHeating, Ventilation and Air Conditioning (HVAC), but there are other solutions such asBuilding Integrated Photovoltaic - Thermal (BIPV-T) systems or earth-tubes. These will be explained in chapter3.
Lighting represents just 10% of the total energy consumption of a building but con-cerningNZEBall kind of energy use reduction counts. The use ofLight-Emitting Diode (LED)lamps is an extra cost but, in a long term, it can be a helpful way of reducing energy consumption.
NZEB: Characteristics
The following items are used as mainNZEBcharacteristics and enabled the cross-case analysis presented in section2.1.5.
• Building use, a building can be Office, Educational, Industrial, Commercial or
Resi-dential building.
• Net Floor Area, is the considered area of the building.
• Annual primary energy demand, is the value that shows the amount of primary energy which each building needs along one year.
• Annual primary energy generation, represents the capability of energy generation along one year.
• Annual primary energy balance, is the difference between Annual primary energy
demand and generation.
• Climate Challenge, regards to if the building isHeating Dominated challenge (HD)1, Heating and Cooling Dominated challenge (HCD)2orCooling Dominated challenge
(CD)3.
• U-Value, indicates the heat transmission through a building part and if its low, indicates a better isolation of the building.
• g–value, is the solar heat gain or incident solar radiation of a building part.
• Heating and/or cooling system, includesSolar Water Heating System (SWH),BIPV, earth-tubes, Ground Source Heat Pumps (GHP) or Combined Heat and Power (CHP).
As mentioned below in Energy EfficiencyandEnergy Comfort, the first principle in theNZEBdesign focuses on decreasing the amount of energy demand throughPassive Approach (PA). The second principle aims at implementing Energy Efficient Systems (EES), given the inherent needs of artificial lighting and possible heating and/or cooling. TheRenewable Energy Systems (RES)are essential to offset the energy demand required
for lighting, heating, and cooling [12].
This procedure enables the identification of the set of relevantNZEBdesign issues by combining the three previously mentioned issues as displayed on figure2.2.
Figure 2.2: Overview of the three main design issues [12]
Energy Efficiency
Agency for Energy of Portugal (ADENE) [13] presents a brief definition ofEnergy Efficiency: “The energy efficiency is the optimization of the energy consumption by its user”, all this through energy consumption reduction measures without loss of comfort and un-necessary waste of energy. A realZEBdefinition should first encourage energy efficiency,
and then use renewable energy sources available on-site. Efficiency measures such as
daylighting or combined heat and power devices cannot be considered on-site generation in theZEBcontext. However, efficiency measures must have good persistence and should
be “checked” to make sure they continue to be energy savers [5]. The main efficiency
measure will be presented in figure2.4.
There are two ways of expressing recommendations on energy efficiency: prescriptive
requirements, applied to, for example, U-values of walls and windows orHVACsystems; performance requirements, used to energy needs, such as, heating, cooling, lighting or total weighted primary energy demand [14].
Passive sustainable design strategies play the main role concerning NZEB design as they directly affect the heating, cooling, ventilation and lighting loads put on the
Appliance of passive sustainable design strategies is achieved throughout the execu-tion of [12]:
• Building energy demand reduction;
• Generation of electrical energy by means ofRESaiming an effective energy balance.
The annual measurability of energy consumption is an excellent aspect of the net zero energy principle. By including the electrical energy consumption, the need to reduce the electrical demands is evident. Figure2.3covers a wide range of energy saving measures [15].
Figure 2.3: Selected Energy saving measures applied in Net ZEBs [15]
Energy Comfort
Energy Comfortis not the main focus on this work, being that the reason for presenting just a slight overview with the purpose of enhancing its importance in terms of energy efficiency in buildings.
Using passive strategies in a building is the best way to reduce discomfort indexes and at the same time, reduce the energy needs especially in heating and cooling matters [16].
Aelenei [17] says that the main principles applied in passive sustainable design are well known. The fundamental issue is to find if the same applies in ZEB design as well. The three main steps required to achieve the ZEB performance, are related to specific challenges in terms of lighting, heating and/or cooling and power generation. This procedure has the advantage of facilitating the identification of the set of relevant ZEBdesign issues, through a combination ofPA,EESandRESwhich are more likely to succeed in reaching the desired energy performance. The three main design issues are well described inNZEB: Characteristics.
The Baruch Givoni psychrometric-bioclimatic chart 2.4can be considered the easiest and most practical tool, based on the comfort zones defined inAmerican Society of Heat-ing, Refrigerating and Air-Conditioning Engineers (ASHRAE)Standard 55, to know and understand the best way to use this passive measures [16].
This chart crosses 4 different scales including, Wet bulb or Saturation temperature,
Enthalpy, Humidity ratio and Dry-bulb temperature. Each region in the planet can be displayed by an area on this chart, as an example, Solar XXI area stands out in red. Depending on the region, different bioclimatic strategies can be taken into account in
terms of passive measures and other constructive characteristics towards better comfort indexes and energy building performance [19].
2.1.3 NZEB Boundaries
The definition of the goal will influence designers of buildings in conceiving high-performance infrastructures. The way aZEBgoal is defined is crucial to understand the combination of appropriate efficiency measures and renewable energy supply options.
The boundary of each case can be way larger than the building footprint, which is why there is a high importance of pre-defining boundary conditions as the first step of net balance calculations. A building or a cluster of buildings, depending on where the system boundaryis placed, is characterized by the load and the types of load, and also by the energy generation capacity [20].
Renewable energy sources available on-site are used passively like solar gains through windows and actively like atmospheric or ground source heat pump to partially satisfy the load of the building. These on-site renewables are also used as energy generators that cover the load and are feed back into the grid, depending on the temporal matching between generation and load and the available storage possibilities [20].
These supply systems, to which a building may be connected, are named with the generalized term of energy grids, or simply grids.
Delivered energyis supplied by the grid to the building andFeed-in energyis the one produced but not used in the building and consequently flows to the grid.
The two primary boundary conditions areSystem BoundariesandWeighting/Crediting System.
Boundary Conditions
Sartori [14] definedBuilding system boundaryas “necessary to identify what energy flows cross the boundary”. System Boundarycan be split asFunctionality and effectiveness, that indicates which kind of building is it (Office, Educational, Residential). This type of
boundary is important to check the energy needs of the building based on the population of the building. It can also be split inClimate and Comfort, which is also relevant because of the user behaviour and comfort needs that may change radically with the climate challenge considered [14]. The physical boundary is useful to identify if the generation system is within or without the boundary being respectively addressed as on-site or off
Weighting/Crediting System
For theWeighting SystemSartori [14] considers the four types of metrics mentioned in ZEB definitions[5]. This system“converts the physical units of different energy carriers into a uniform metrics, hence allowing the evaluation of the entire energy chain”.
Marszal [20] uses the same four type of metrics and includes exergy, environmental credits or even politically factors as deciding factors, but the term used isCrediting System.
2.1.4 Grid Interaction, Net Zero Balance and Load Matching in ZEB
TheNet Zero Balancehas to consider on-site generation and building loads (often called LM), and the resulting import/export interaction with the surrounding energy grid, com-monly namedGrid Interaction (GI).
Grid Interaction
In most ofZEBdefinitions, the building connection type to the grid is not considered. The only author who does this reference is Kilkis [9]. Marszal cites Kilkis indicating that “due to different energy qualities between exported and imported energy, the utility grid is often in a worst position than the building”, therefore proposes a Net Zero Exergy Building definition that better accounts for different energy qualities. It is stated that energy
feedback into the grid has to have the same usability as the energy taken from the grid [7]. Figure 2.5shows an overview of possible renewable supply options.
NZEBs are also part of a general concept ofDistributed Energy Resources (DER), also known as distributed generation, and development in thatDERunits has to ensure the possibility of high power injections to the grid [11].
When the on-site generation is bigger than loads of the building, excess electrical energy is exported to the utility grid. By using the grid to account for the energy balance, excess generation can offset later energy consumption. Achieving aZEBwithout the grid
would be tough, as the current generation of storage technologies is limited [5]. Off-grid
buildings may be grid independent, but for that, they rely on storage systems. These cannot feed their excess energy generation back onto the grid, so this energy is wasted if the storage capacity limit is reached.
Torcellini [5] developed a ranking of renewable energy sources in theZEBcontext. Table2.1shows this ranking in order of preferred application.
Table 2.1: ZEB Renewable Energy Supply Option Hierarchy [5]
Option Number ZEB Supply-Side Options Examples
0 Reduce site energy use through low-energy Daylighting, high-efficiency HVAC equipment,
building technologies natural ventilation, evaporative cooling, etc.
On-Site Supply Options
1 Use renewable energy sources available within the PV, solar hot water, and wind located on the
building’s footprint building
2 Use renewable energy sources available at the site PV, solar hot water, low-impact hydro, and wind
located on-site, but not on the building.
Off-Site Supply Options
3 Biomass, wood pellets, ethanol, or biodiesel that
Use renewable energy sources available off-site to can be imported from off-site, or waste streams
generate energy on-site from on-site processes that can be used on-site to
generate electrical energy and heat.
4 Utility-based wind,PV, emissions credits, or other
Purchase off-site renewable energy sources "green" purchasing options. Hydroelectric is sometimes considered.
Sartori defines that the GI index represents “the variability (standard deviation) of the energy flow (net export) within a year, normalized on the highest absolute value”. The difference between exported and delivered energy, within a period of time, is the net
export from the building, representing the grid interaction [14].
Grid Interaction Flexibility
An important characteristic from the viewpoint of the grids is theGIflexibility of a NZEB. This is understood as the grids ability to respond to signals, like price fluctua-tions, “and consequently adjust loadDSM, generation and storage control strategies” aiming at serving more efficiently the grid and building needs together [21].
Flexibility is provided by the storage capacity in the building, or its ability to vary its load or curtail its generation system. Curtailmentof exported energy during a limited amount of time (1–5%) during the year has a significant impact on the energy exported from the building to the grid.
To evaluate the flexibility potential from the owner/user perspective, two important factors, cost and user acceptance, must be considered [11].
Net Zero Balance
Thebalance boundarydefines which energy uses are considered for theNet Zero Balance. This balance is another condition and has two important aspects,Items of the balanceand Balancing period. The balance or weighting can be weightedsymmetrically, using the same weighting factors for both delivered and exported quantities, orasymmetrically, using different elements [14].
In a matter ofItems of the balance, they are essential to quantify the energy that flows in or out the grid considered in the balance. To make this balance possible, all energy delivered to the building from the utility grid and all energy feed-in to the grid by the building needs to be accounted as delivered energy/load and exported energy/generation [20] [21] [22].
For aNZEB, the balance between import and export over a period must be zero, or even positive. Building exchange energy with the electrical grid in the form of energy carriers is converted from or on to primary sources using credits, and the final balance then is calculated by the following equation [20]:
N ZEB=|export| − |import| ≥0 (2.1)
where
import=X
i
delivered_energy(i)×credits(i) (2.2)
export=X
i
f eed−in_energy(i)×credits(i) (2.3)
Figure 2.6represents the overallNet Zero Balanceconcept.
Figure 2.6: Graph representing theNet Zero Balanceconcept [14]
Load Matching
A higher degree ofLMdecreases the effective load on a distribution grid, which lowers
distributed volumes, counteracts voltage drops and reduces losses. With large amounts of distributed generation, the degree ofLMhas impacts on the design and operation of distribution grids.
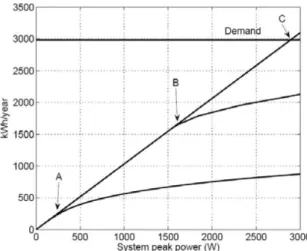
Figure 2.7showsLMbehaviour with 10 minutes, monthly and annually time resolu-tions considering an annual balance line.
Figure 2.7: LMbehaviour with 10 minutes time resolution considering an annual balance line [23]
On the figure above the lower curve (A) represents the LM based on 10 min net metering (max. 28%); the middle one (B) the monthly balance (max. 68%). The straight line (C) considers the annual balance and shows the match with the demand (103%).
DSMand Energy Storage have a direct impact on the improvement of theLM. Storage is, in general, the most effective option, but DSMappears to be a realistic alternative
to storage at moderate overproduction levels. For a system with an annual, theoretical perfect, daily match between the generation and the demand, the solar fraction increases from 35% to 65%. This situation can only be reached by storage, but with Load Shifting this solar fraction can reach 41% to 48%. There is theoretical potential for increasingLM, but for that there are still some practical obstacles in order to achieve it [24].
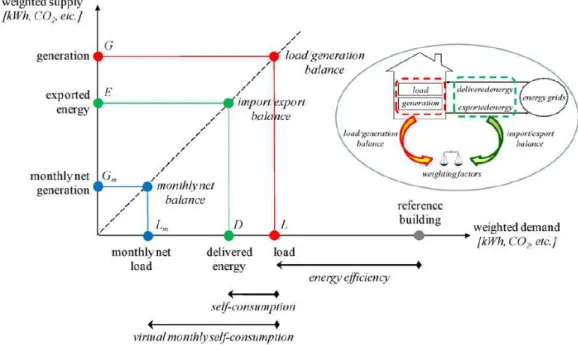
Figure 2.8 highlights the three types of balance, import/export balance between weighted exported and delivered energy; weighted generation and load, and monthly net balance between weighted monthly net values of generation and load.
Figure 2.8: Graphical representation highlighting the three previously mentioned types of balance [14]
As it can be seen the virtual monthly self-consumption is the difference between
the monthly net load (Lm) and a reference load value (L); the self-consumption value
is the difference between the delivered energy (D) andL and the energy efficiency is
the difference betweenLand a building reference value. The figure also shows that the
mentioned differences are based upon the weighted demand that can be defined as kWh
2.1.5 ZEB known cases
To present a variety ofZEBexamples, the Task40 report4was taken as the main source. Some of the examples are represented in 2.9. Task40 was a work from the Solar Heating and Cooling Programme of the International Energy Agency focused on Net Zero Energy Solar Buildings that aimed to discover a clear and international agreement on theZEB definition and the measures of building performance [25].
Figure 2.9: Map of ZEB examples across the world [25]
The choice was to include the areas where it was possible to find more examples of ZEB, which is the reason for the exclusion of some examples.
Some years laterEPBDmade a report where only European examples were included. This report encloses some restrictions to building construction in the near future of Europe, including all the knowledge adjacent to it [2].
Some of the examples from Task40 andEPBDare described in [25]. The description is composed by characteristics such as Building Use, Net Floor Area, Annual primary en-ergy demand, Annual primary enen-ergy generation, Annual primary enen-ergy balance, Climate Challenge, U-Value, g–value and Heating and/or cooling system. Those characteristics were already explained in subsection2.1.2.
With the intention of analysing a few NZEB examples from all over the world three tables were created containing the constructive characteristics previously mentioned in this section. Tables2.2,2.3and2.4examples can be found in [26] and [3].
Table 2.2: ZEB worlwide examples I
Building/Country Building Use Net Floor Area
(m2)
Solar XXI-Portugal Non-Residential - Office 1500
BCA Academy-Singapore Non-Residential - Office 2180.5
Meridian Building-New Zealand Non-Residential - Office 4795
Green Office-France Non-Residential - Office 21500
Marché Kempthal-Switzerland Non-Residential - Office 1550
Primary School of Laion-Italy Non-Residential - Educational 62511 Die Sprösslinge-Germany Non-Residential - Educational 969116.61 Hauptschule Schrobenhausen-Germany Non-Residential - Educational 7080 Leaf House-Italy Residential - Individual 477151.24 Urban Semi-Detached House-Ireland Residential - Individual 16047.10
“Le Charpak”-France Residential - Dwelling 64729 Ecoterra-Canada Residential - Individual 23450.80 Plus Energy-Austria Residential - Dwelling 7890
Sems Have-Denmark Residential - Dwelling 3388
Table 2.3: ZEB worlwide examples II
Building Energy Demand Energy Generation Energy Balance (kWh/m2.year) (kWh/m2.year) (kWh/m2.year)
Solar XXI 60.00 63.00 3.00
BCA Academy 80.00 87.00 7.00
Meridian Building 154.00 154.00 0.00
Green Office 97.00 51.00 -46.00
Marché Kempthal 97.00 80.93 -16.07
Primary School of Laion 11.00 27.00 16.00
Die Sprösslinge 116.61 113.62 2.99
Hauptschule Schrobenhausen 104.50 0 -104.5
Leaf House 151.24 128.00 -23.24
Urban Semi-Detached House 47.10 0 -47.1
“Le Charpak” 29.00 5.00 -24.00
Ecoterra 50.80 16.35 -34.45
Plus Energy 70.65 113.95 43.3
Table 2.4: ZEB worlwide examples III
Building Climate Challenge New/Renovated U-Value Wall g-Value Heating/Cooling System
(W/m2.K) (%)
Solar XXI HCD New 0.45 75 Earth-tubes;SWH;BIPV-T
BCA Academy CD New 4.05 33 SWH;CHP
Meridian Building HCD New 0.38 44 SWH;CHP;GHP
Green Office HCD New 14 - SWH;CHP;GHP
Marché Kempthal HD New 0.12 49 SWH;CHP;GHP
Primary School of Laion HCD New 0.22 34 Earth-tubes;SWH;CHP;GHP
"Die Sprösslinge" HD New 0.14 51 SWH;CHP;GHP
Hauptschule Schrobenhausen HD Renovated 17 -
-Leaf House HCD New 0.15 61 Earth-tube;SWH;CHP;GHP
Urban Semi-Detached House HCD Renovated 19 -
-“Le Charpak” HCD New 0.26 53 SWH;CHP
Ecoterra HD New 0.16 53 SWH;CHP;BIPV-T;GHP
Plus Energy HD New 0.09 55 SWH;CHP;GHP
Sems Have HD Renovated 0.2 -
-Cross-case Analysis
After thisZEB cases review, a choice of some buildings was taken, not only based on climate challenge, but also on the type of building, to perform a cross-case analysis represented in the chart 2.10.
For different values ofAnnual primary energy balance, for each kind of building type
and climate challenge, theHeating and/or cooling systemhave an important role. Even with a negative balance, it is impressive, how small are the values of primary energy demand for large area buildings. HDbuildings have the lowestU-Valuewall mainly because of their higher isolation levels need.
Figure 2.10: Cross-Case Analysis of Annual Primary Energy Balance
Concerning the g-values, they are around 50%, but BCA Academy and Laion have smaller values because they are notHDbuildings. These U-values and g-values have to be balanced depending on the climate challenge. One can draw the conclusion that low U-valuesalong with highg-valuesare appropriate for a cold climate.
In educational and office buildings energy demands are mostly driven by the
inter-nal loads of the building as can be seen in the Meridian Building and Die Sprösslinge Kindergarten [17].
Every example presented had a substantial energy demand reduction. In Hauptschule Schrobenhausen and Urban Semi-Detached House, there were no generation systems included and that is the reason for the energy balance of 0% and to not be represented on the graphic above. Nevertheless, the energy demand reduction was substantial. Other buildings could reach more than 100% which is perfect and means that they produce even more than they need.
2.2 Energy Flexibility
With the growing investment on the introduction of renewable energies in society, in-vestments and studies on energy flexibility of buildings are getting more important. The improvement of building energy flexibility allows to take advantage of renewable energy and adapt it to the design of buildings towards a sustainable energy development.
With the integration of renewable energy, grows the amount of intermittent energy that flows to the grid, causing ocasional periods of overproduction, otherwise the gener-ated energy would not be 100% reliable since it is of natural factors dependent [27].
To suppliers, the gap between generation and consumption is always a problem. This issue can be solved if there is an introduction of flexibility in the energy supply through-out carbon intensive generators. However, this goes against the sustainable development and should be solved throughout cleaner solutions [28].
Considering energy flexibility, the electric system of a building should not be simply a problem of the supplier. For the supplier, this flexibility can be enhanced throughout clean Demand Response (DR) measures [28]. This measures, represent the ability of customers to modify their usual consumption profile due to different electrical energy
prices in different periods of time. DR measures aim to improve the performance of
power systems and, consequently, to reduceCO2emissions [27].
• Thermal Energy Storage (TES) is usually used to anticipate the energy consump-tion of an individual electrical device (air condiconsump-tioner, electrical water tank or heat pump), typically by taking in mind the thermal properties of the device itself or of the respective building. Consequently reducing the consumption of electrical energy during off-peak times, one has into consideration the thermal comfort needs
of the users in the building [28].
• Operation shifting is one of the main approaches typically used to deviate the elec-trical energy consumption of a specific building from the common plan through Load Shifting [28]. It is based on an approach that shifts the electrical energy de-mand, from on-peak to off-peak periods, through the control of some electrical
devices (washing machines, clothes dryers, and dishwashers), to periods of lower electrical energy prices or bigger renewable energy generation [29].
2.2.1 The importance of Flexibility
Similarly toNZEB, there is no generic definition of energy flexibility, as this typically depends on the system under study. R. Amaral [28] in his literature review concludes that “flexibility can be split into two main approaches”. They are deviation of electrical energy consumption byTESorLoad Shifting, where electrical energy demand shifts, to periods of lower electrical energy prices or greater renewable energy generation, through the control of some electrical devices. De Coninck [30] gives his definition as “the possibility to deviate the electrical energy consumption from theBusiness as Usual (BAU)consumption at a certain point in time and during a certain time span”. De Jonghe [31] defines flexibility as the elasticity of the demand as a function of the electrical energy price. It is important to say that this Load Shifting cannot contribute to a comfort reduction [32].
There are two different kinds of renewable energy technologies. Technologies such as
hydropower, biomass and geothermal are reliable for the generation of electrical energy on demand. Technologies such as wind, wave power, and solar photovoltaics are consid-ered variable types that depend on intermittent resources that fluctuate on timescales of seconds to days.
The introduction of these variable types or distributed renewable energy technologies, enhances the role of energy flexibility. This flexibility ensures that not only is there sufficient generation capacity available to meet future demand but that those resources
can be operated in a sufficiently flexible manner making also possible to account for
expected system ramps and reserve requirements [35]. With this share of intermittent renewable energy growing, also increases the renewable electrical energy generation injected in a decentralized manner, the electrical load caused by the change from fossil fuelled systems toward high efficient electrical equipment and the stagnating number of
traditional controllable power plants [36].
Reduction ofpeak power, consumption, emissions, and costs are the main reasons to invest in energy flexibility in De Coninck perspective [30]. Ottesen [37] shows a more consumer-orientated view, as he states that energy flexibility, based on demand side activities, is integrated with smart grid technologies leading to a significant cost reduction for energy consumers, to the ability of intermittent renewable energy generation and electric vehicles integration improvement, enabling a bigger reliability over the energy system, and to less costly network reinforcements.
2.2.2 Flexibility Potentials and Time Scales
The flexibility potential is stated as “the power consumption increase and decrease that can be realized at a particular time of day, combined with how long this power increase or decrease can be sustained” [36]. This flexibility potential can be used as an instrument to determine the impact or economic viability of any demand response program.
Flexible capacity can be used to respond to unexpected peaks or “last-minute imbal-ances” [38] [39]. Flexibility Time Scales can be categorized into the following way:
• Very short duration (From milliseconds to 5 minutes), which is a too sharp deviation that can damage equipment, lead to tripping of power generating units, or even to a system collapse over 80% of the power line disturbances last for less than a second.
• Short duration (From 5 minutes to 1 hour), a time scale where spinning reserve refers to online power generation capacity synchronized to the grid having a short response time for ramping up but allowing several hours of use. Non-spinning reserveis similar tospinning reserve, but without immediate response requirement.
2.2.3 Operational measures to increase flexibility
Intermittent resources cannot be trustworthy because of their “meteorological forecasting” dependency. This situation increases the doubts regarding the power systems ability to manage the balance between supply and demand with a bigger integration ofVariable Renewable Energy (var-RE), maintaining a “secure and stable operation” [38].
In smaller systems, which are less able to absorb large fluctuations, the combination of some technologies and storage, is useful in such a way that the aggregated output at the point of connection to the grid is relatively smooth. If the combined outputs of many variable resource power plants, which are based on different resources and located over
a wide area, are to be considered jointly, their net variability becomes smoother than individual plants.
Different measures to optimize flexibility are given below.
Demand side management
DSMcan provide flexibility through a balance between electrical energy generation and load, which is necessary forvar-REgeneration, and response in various time scales. Figure 2.11illustrates the measure possibilities on the demand side which offer
substan-tial opportunities to reduce system costs, due to demand peaks. The level of demand peaks can be reduced by introducing incentives to consumers to reduce their consumption at such times.
Figure 2.11: Illustration of different approaches to Demand Side Management [39]
Electric heating in combination with a hot water storage tank, dishwashers, and elec-tric vehicles have a very high potential for DSMand all household appliances have a potential of about 20% to 30% of their load without restriction of consumer needs. Dif-ferent descriptions forDSMwere given by some others.
• Lund perspective: “Demand Side Management comprises a broad set of means to affect the patterns and magnitude of end-use electrical energy consumption”. Through oper-ational measuresDSMcan be categorized to reduce (peak shaving, conservation), increase (valley filling, load growth) or reschedule (load shifting), energy demand [39].
• Lannoye perspective: “Demand Side Management could be available either to curtail demand, where a consumer will reduce demand when the price rises above a certain level, shift demand where moving a load from a time of higher prices to a time of lower prices or assisting the integration of Variable Generation”. Periods of high Variable Generation should correspond to low prices [34].
Important to regard is also Puchegger’s [42] work, as he shows how is the behaviour of loads with and withoutDSM, comparing this two approaches.
Demand Side Response
One other important concept is the concept ofDemand Side Response. Following a def-inition of Lannoye [34], “the development of the smart grid should become a more widespread resource, as customers participate actively in the market”. CurrentlyDemand Side Response is considered the least utilized form of a flexible resource as it is not stimulated by the markets.
Gottwalt [43] states that to assess the value of flexible residential devices for a De-mand Response aggregator, first the reduction in microgrid generation costs is estimated. Therefore, the uncontrolled scenario is compared with the integrated optimization where devices can be scheduled. In terms of flexibility, it is indeed a relevant matter.
Load Shifting
One of the primaryDSMapproaches used to deviate the electrical energy consump-tion of a concrete building from the regular plan is Load Shifting. It is based on an approach which shifts the electrical energy demand to later times through the control of some electrical devices (washing machines, clothes dryers, and dishwashers), to periods of lower electrical energy prices or bigger renewable energy generation.
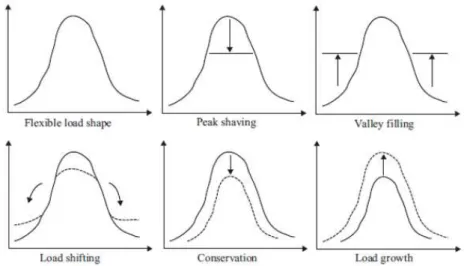
There are four types of load units described below [37]:
• Curtailable load units, that may be reduced without being replaced, at a possible loss of comfort for the user.
• Reducible load units, where the load can be reduced down to a certain level without switching off.
• Disconnectable load units, where the unit is either on or completely off.
• Inflexible loadunit class, that covers all load units where load must be met under any circumstance.
Figure 2.12below displays different load flexible classes.
Figure 2.12: Illustration of the different load flexible classes [37]
2.2.4 Methodologies to quantify Energy Flexibility
The quantification of energy flexibility, in light of what has been mentioned throughout this chapter, proves to be a significant measure to accomplish.
From De Coninck [30] [46] point of view, the first step in the quantification process is to create a simple but appropriate and accurate system model in order to be able of predicting the behaviour of the system. “At least threeOptimal Control Problems (OCP)
need to be solved to determine the flexibility at a particular point in time and during a certain time span”.
Cost functionsrepresent the amount of flexibility and associated costs. Aggregation of multiple cost curves can also be done. It is clear that an aggregated system can provide more flexibility than a single system. Also, by aggregating costs functions, it is often possible that a certain amount of flexibility can be offered at a lower price than any of the
C
h
a
p
t
e
3
Ca s e S t u d y : S o l a r X X I
Solar XXI is aNZEBliving lab, which was designed and constructed as result of a research project coordinated byLaboratório Nacional de Energia e Geologia (LNEG).
The building has a high energy performance integratingRES, including active and passive, composed by façadeBIPV, aSWHsystem on the roof and a parking lotPV avail-able at the site. All energy generated by theBIPVsystem is immediatly consumed by the building needs, however, knowing that the parking lot PVenergy generation is rather high, when not consumed, instead of being feed-back into the grid, is used by the other buildings which compose the campus of Solar XXI. Pointing out the integrated technolo-gies, several construction methods were implemented for a higher thermal comfort level. It comprehended methods such as thermal and solar radiation, as well as isolation, and south oriented windows that allow the building to have solar gain in winter time and shade in the summer time.
Regarding cooling systems, the building has no HVAC but a system composed of buried tubes, generally called earth-tubes, which allow natural ventilation.
The innovative aspect of this building is related to the integration of photovoltaic modules on the façades which combines energy generation and heat recovery.
Since the opening of Solar XXI in 2006, it was monitored several times, becoming a case study of several investigation projects. In one of the monitoring periods it was concluded that the building has around 80% of the energy consumption produced by renewable sources and this is the reason why it is considered anZEB.
Figure 3.1: Representation of the Case Study: Solar XXI [47]
Following will be presented the diverse systems which compose Solar XXI split into two kinds of systems based on the type of energy. Heat Systemsdescribed in section3.1 are systems related to heat transfer,Sunlight Systems present in section3.2are systems directly connected with solar energy.
3.1 Heat Systems
3.1.1 Heating Strategies
In the interior, the permanently occupied offices are south oriented to allow the direct
insulation and solar gains in the winter time. North oriented rooms are casually occupied, so they do not need the same comfort levels as the permanently occupied offices.
Thermal building characterization
In this matter, just the most important thermal aspects will be referred so, in table3.1 some of these characteristics are presented.
Table 3.1: Constructive characteristics of Solar XXI [47]
U-Value Wall 0.45 (W/m2.K)
U-Value Roof 0.26 (W/m2.K)
U-Value Ground Floor 0.55 (W/m2.K)
U-Value Windows 4.5 (W/m2.K)
Solar XXI as different levels of thermal isolation thickness reducing the heat losses of
Heat Recovery
The south façade was projected with the combination of the photovoltaic modules and the windows allowing to produce some of the building used energy. This system, known asBIPV-Tand represented in figure 3.2, is also used to recover the heat generated by the photovoltaic modules and using it as natural heat in the winter throughout a cavity by natural convection system that can be opened or closed by the user.
Figure 3.2: BIPV-T system used as a heat recovery system [47]
TheSWHsystem is connected to a natural gas boiler in the basement of the building which allows it to have always central heating especially in the north areas in the winter time. The solar direct gain through windows located on the south façade and the building orientation with the main façade south oriented especially for capturing high level of radiation is also a heating strategy.
3.1.2 Cooling Strategies
Passive cooling through the ground
The cooling comes from an exterior air entrance that is connected to the building by 32 tubes. Knowing that the underground temperature is lower than the surface temperature, the objective of the tubes is to enable the contact of the air that goes naturally to the building to be pre-cooled. In each office, the user can control the exit of the air by just
opening or closing a door. This system is represented in figure 3.3.
Figure 3.3: Earth-Tubes system used as a main cooling strategy [47]
Natural Ventilation
Particularly in the summer, Solar XXI has natural ventilation because of its characteris-tics that allow transversal ventilation. For example, every office door has frames that lead
to the natural ventilation of the offices. Some of all ventilation strategies determine the
thermal loads level in the interior of the building, essential to cool down the temperature levels during the night in the summer, coming from the outside source.
3.2 Sunlight Systems
Natural Light
The windows are a major source of light and their size in the south façade is essential for that. The central open space that connects all floors is also an important source of light that makes unnecessary, the use of electrical light in that area. The north oriented offices
have also light communication with the central open space through the door frames. Both main ways of natural light are showed in the next figure 3.4.
Figure 3.4: Representation of natural light for winter and summer periods [47]
3.2.1 Renewable Energy Systems
Photovoltaic Systems
The photovoltaic system integrated into the south façade includes about 100 m2of photovoltaic modules of multi crystalline silicon, producing an average of 12 kWp di-rectly used by the building.
In the parking lot of the building, anotherPVCIS1system was installed with around 12 kWp. This system was integrated into the project but is completely separated from the building electrical system.
Solar Water Heating System
The building is also composed by aSWHsystem installed on the roof which includes 7 modules and which purpose was previously described on3.1.1.
3.3 Building Design and Energy features
Main features representation
According to the features described in subsection2.1.2one can relate them as in the following scheme (figure 3.5).
Energy Balance analysis and Index
Energy balance analysis is crucial in a building such as Solar XXI due to its importance as an NZEB and energy efficiency unit ofLNEG. The analysis of 2009 is represented on
table3.2.
Table 3.2: Daily average values of energy produced and consumed in Solar XXI until 2009 [47]
Energy Produced Consumption Energy Produced
(kWh) (kWh) (%)
Parking lot PVFaçade PVTotal Solar XXI PV/Consumption
23 31 54 78 78
In order to explicitly assess the impact of constructive solutions, an evaluation study has been made by means of heat and energy simulations of the building. The simulations considered only the actual distributions of occupation, lighting power and equipment by thermal zone based on data from the building usage [47].
3.4 Electrical panel boards description
Solar XXI is composed of 10 electrical panel boards that will be described from the highest to the lowest floor. The cover of the roof has its own electrical panel board (Q.COB.) linked to the main board (Q.G.), such as the first floor (Q.P1) and the underground floor (Q.P-1). The scholarship holders office has one electrical panel board (Q.S.B.) as well as the
conference office (Q.S.P.), both also directly wired to the main board. An auditorium on
the first floor has its own panel board connected to the Q.P1 also as (Q.D.C.) present in a room currently without a specific function. The underground electrical panel board is connected to two other boards, one for Biomass Lab (Q.L.B) and another for a lab called the wind tunnel lab (Q.T.V). ThePVmonitoring is also made through the main board. No loads such as aHVACor other big loads compose Solar XXI, therefore, that kind of description was not performed. The electrical panel boards diagram of the building can be found below in figure 3.6.
C
h
a
p
t
e
4
M e t h o d o l o g y
This chapter contemplates all the data retrieval description, including energy in the form of electricity and compares real and simulated data fromEnergyPlusandPVGIS. It also considers Net Zero Balance and Load Matching Indicators applied in the case study, leading to the acquisition of useful information to verify the Energy Flexibility potential of the building.
All the steps concerning the methodology, including simulations, are performed in a realistic way using all the building characteristics and data retrieved.
4.1 Experimental Analysis
4.1.1 Consumption and Generation data collection corresponding to winter and summer periods
In Solar XXI, every load and generation values are monitored with 10 minutes precision but only corresponding to the total amount of the entire building energy consumption and generation. In this sense, a decision was taken to collect the data with the discretization of the load andPVgeneration. The purpose was to allow an easier analysis of the loads. Several energy analysers were used and installed in different electrical panels of the
building, enabling the achievement of the exact consumption per electrical panel and the PVgeneration associated with the respective panel. The energy analysers employed were Chauvin Arnouxmodels8334, 8334B[48] and8331[49]. The analysis started at 05:30 PM and ended at the same hour, one week after.
In July the process was repeated, which represented the summer period. The only difference was that this new data collection was obtained from the beginning, with a 15
minutes precision, to avoid a possible mismatch from the energy analysers.
Following a monthly comparison between consumption and generations is presented as well as the experimental periods with a weekly time resolution symbolized by seasonal load diagrams.
4.1.2 Annual consumption-generation contrast
To have a better understanding of the building’s load behaviour along one year some data was provided by LNEG. Figure 4.1 represents the comparison between energy consumption and generation per month, on an annual basis.
Figure 4.1: Solar XXI comparison between energy consumption and generation
4.1.3 Seasonal load diagrams
For the further analysis, both data sets from March and July were considered. Figure 4.2 is an example of one of the Load Diagrams created for each electrical panel of Solar XXI, indicated in chapter3, to allow a better understanding of the load behaviour collected in a discretised manner.
Figure 4.2: Load diagram of the electrical panel of 1st floor (Q.P1) for summer period
Figure 4.3represents the total energy used in that week, which had to be calculated adding thePVgeneration values to the Energy Balance values.
Figure 4.3: Load diagram of Power Consumption of the building for winter period
![Figure 2.1: NZEB example of a primary school in Italy [4]](https://thumb-eu.123doks.com/thumbv2/123dok_br/16573267.738103/22.892.246.649.438.705/figure-nzeb-example-primary-school-italy.webp)
![Figure 2.2: Overview of the three main design issues [12]](https://thumb-eu.123doks.com/thumbv2/123dok_br/16573267.738103/26.892.250.629.157.531/figure-overview-main-design-issues.webp)
![Figure 2.5: Overview of possible renewable supply options [7]](https://thumb-eu.123doks.com/thumbv2/123dok_br/16573267.738103/30.892.165.728.716.1115/figure-overview-possible-renewable-supply-options.webp)
![Figure 2.9: Map of ZEB examples across the world [25]](https://thumb-eu.123doks.com/thumbv2/123dok_br/16573267.738103/36.892.136.756.316.653/figure-map-zeb-examples-world.webp)
![Figure 3.1: Representation of the Case Study: Solar XXI [47]](https://thumb-eu.123doks.com/thumbv2/123dok_br/16573267.738103/48.892.269.621.150.419/figure-representation-case-study-solar-xxi.webp)
![Figure 3.2: BIPV-T system used as a heat recovery system [47]](https://thumb-eu.123doks.com/thumbv2/123dok_br/16573267.738103/49.892.277.612.337.733/figure-bipv-t-used-heat-recovery.webp)
![Figure 3.3: Earth-Tubes system used as a main cooling strategy [47]](https://thumb-eu.123doks.com/thumbv2/123dok_br/16573267.738103/50.892.215.672.333.730/figure-earth-tubes-used-main-cooling-strategy.webp)
