ABSTRACT. In this paper we present the development of a modulated web based statistical system, hereafter MWStat, which shifts the statistical paradigm of analyzing data into a real time structure. The MWStat system is useful for both online storage data and questionnaires analysis, as well as to provide real time disposal of results from analysis related to several statistical methodologies in a customizable fashion. Overall, it can be seem as a useful technical solution that can be applied to a large range of sta-tistical applications, which needs of a scheme of devolution of real time results, accessible to anyone with internet access. We display here the step-by-step instructions for implementing the system. The structure is accessible, built with an easily interpretable language and it can be strategically applied to online statistical applications. We rely on the relationship of several free languages, namely, PHP, R, MySQL database and an Apache HTTP server, and on the use of software tools such as phpMyAdmin. We expose three didacti-cal examples of the MWStat system on institutional evaluation, statistididacti-cal quality control and multivariate analysis. The methodology is also illustrated in a real example on institutional evaluation. A MWStat mod-ule was specifically built for providing a real time poll for teacher evaluation at the Federal University of S˜ao Carlos (Brazil).
Keywords: Online Survey, Statistical System, Real Time Results, Statistical Methods.
1 INTRODUCTION
For decades the pattern of rationality based on statistical analysis has experienced slowness, which begins with the data collection, passes by the statistical analysis itself, and ends up in the final presentation of the results obtained in form of a report. For instance, in traditional data collect research there is a gap in time between the application of a questionnaire, the obtainment of the answers of respondents, the application of statistical techniques and the visualization of informative reports on the final results, i.e., possibly a slow process that often may involve a high cost. On the other hand, on account of internet democratization, online surveys are becoming
*Corresponding author.
1Instituto de Ciˆencias Matem´aticas e de Computac¸˜ao, Universidade de S˜ao Paulo – USP, S˜ao Carlos, Brazil. E-mail: [email protected]
widely used. In an informal survey over the network, Kaye & Johnson (1999) identified over 2000 surveys in 59 different areas that benefit from the technology focused on online question-naires. Solomon (2001), Fricker et al. (2005) and Cox & Cox (2008), amongst others, show internet based surveys offer significant advantages over traditional survey techniques. However, despite the wide use of online research, the gap in time between the begin of a survey and the final presentation of the statistical analysis results remains. Thus, there is a real need for a en-vironment which facilitates the application of a survey while directly connecting the responses in a customizable real time informative report in order to quickly provide all the information generated by the survey.
Over the world wide web we can find some environments that organize national statistics datasets, such as the Virtual Statistical environment housed on:
http://www.virtualstatisticalenvironment.org/,
as well as, there are environments which collect online data focusing on creating and publishing online surveys, such as the SurveyMonkey (http://www.surveymonkey.com/) and QuestionPro (http: //www.questionpro.com/). It is also easily found statistical systems for specific statistical analysis, such as Young Tung & Schuenemeyer (1991), Krtolica et al. (1991), Hatanaka & Yamada (2003), Analyt-ica (http://www.lumina.com/), and Plug&Score (http://plug-n-score.com), just to name a few.
Moreover, some online statistical environments are capable to produce some simple plots, frequency ta-bles, cross-tabulation and summary measures. SOCR (Dinov, 2006) (http://www.socr.ucla.edu/) proposes a suite of Java applets for statistical online computation, visualization, analysis and virtual exper-imentation, EasyCalculation environment (http://easycalculation.com/) is a free online math website which helps users to learn mathematics and statistics. The above environments cannot carry out cus-tomized statistical analysis which may involve more sophisticated procedures, such as a regression analysis, a multivariate analysis, quality control charts, among others.
Other environments such as the R-PHP (Mineo & Pontillo, 2006) (http://dssm.unipa.it/ R-php/), RStudio (RStudio, 2012) and rApache (Horner, 2012) allow the utilization ofRsoftware di-rectly online, that may be installed on any server. These environments have a sophisticated communication between theRsoftware and servers, but do not interact dynamically with users who do not have knowl-edge of theRlanguage. The environment JStatCom (Kr¨atzig, 2007) defines some classes to connect ex-isting math libraries (Ox, Matlab orRprogramming languages) with Java client. The Rweb environment (Banfield, 1999) has three different versions, the first allows to type the code, click the submit button and a page with the results is returned, the second is based on Javascript procedures and the third is designed as a point click interface that can be used in introductory statistic courses. Also, Online Analytical Statistical Information System (OASIS, 2015) is a online system that provides some sophisticated and public analysis of health and social science data. And, R-fiddle (R-FIDDLE, 2015) provides a free environment to write, run and share R-code right inside the browser.
considered an system, since it replaces the manual collecting data and is able to expose more targeted results to real problems.
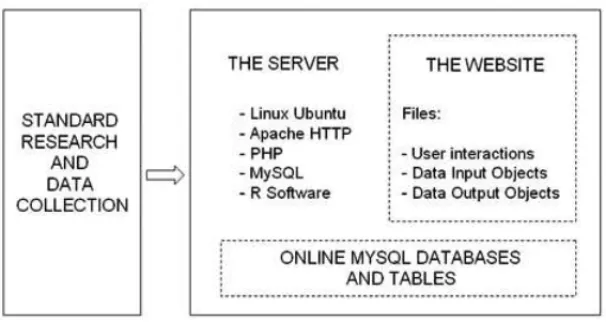
The MWStat relies on the relationship of several free open-source languages, namely, PHP (http//: www.php.net),R(http//:cran.r-project.org), MySQL database (http//:www.mysql.
com) and an Apache HTTP server (http//:www.apache.org), the latter for hosting and interpreting other languages. Moreover, we used the phpMyAdmin interface (http//:www.phpmyadmin.net) as an auxiliary tool, related to the administration of MySQL database using PHP language. These technologies were gathered in a LAMP server (Linux, Apache, MySQL and PHP), which is a popular solution of free open source software to build a viable web server of general purpose with a low costing structure and high performance (Neiderauer, 2004).
Combining all the technologies above, the MWStat can perform online collection and data analysis, and the obtained results are provided in real time, depending only on the processing time of the statistical analysis to be considered. Moreover, the MWStat is also very flexible, since it is completely customizable and it can be built into independent modules, according to the user needs.
The main objective of the present paper is to present the MWStat and the softwares involved in its con-struction, displaying some technical procedures on how to building it. Following this paper, anyone with some computational knowledge may build a web based statistical system environment that performs online statistical analysis for any purposes. The versions of the software used in this work are provided, but the same procedures can be extended to different versions or even other operating environment platform and database software. We provide the basic codes for the implementation of theRenvironment on any LAMP server, but more detailed codes are available in our homepage (http://www.mwstat.com) as well as in the Supplementary Material.
2 SOFTWARES APPLIED FOR BUILDING THE MWSTAT ENVIRONMENT
In this section, we present a list of the auxiliar softwares used in the construction of the MWStat. Essentially, they are free softwares which can be easily found on the web.
• Linux Ubuntu Server 9.10 (or higher):Ubuntu is a complete Linux operating environment, com-pletely free, with great practicality, configuration and use (Tarng & Liou, 2006). The installation file of this operating environment is available on websitehttp://www.ubuntu.com, where the image of its installation CD can be downloaded.
• Rsoftware:computing environment for the performance of statistical analysis and graph building. It compiles and runs on a wide variety of UNIX platforms, Windows and MacOS. In our case, we used theRimplemented in UNIX through a Linux server.
• MYSQL 5.0 (or higher): database management environment (DBMS) that uses the SQL (Struc-tured Query Language) as interface. It is currently one of the most popular databases, with over 100 million installations worldwide.
• PHP 5.0 (or higher): (James & Ware, 2003) acronym for Hypertext Preprocessor, is a language for creating script directly into the server designed specifically for the web. Within an HTML page, PHP codes can be executed every time the page is visited. This code is interpreted on the web server and generates HTML viewing or other display type. Below are listed some advantages of PHP: high performance; interfaces for many different database environments; integrated libraries for many common tasks from the web; Low cost, Easy to learn and use, portability, availability to source code. Version 5.0 was developed to improve to Object Oriented Programming and is available now in version 5.2.13 (http://www.php.net).
• phpMyAdmin 2.7.0-pl2: (or higher): computer program developed in PHP to administer MySQL over the Internet. From this environment you can create and remove databases; create, delete and modify tables; insert, delete and edit fields, execute SQL code and manipulate key fields. For this paper, we used implemented features and bug fixes up to version 2.6.2 (http: //www.phpmyadmin.net).
These softwares should be installed in order to build a LAMP server capable to gathering, storage data and show the results through the Apache, MySQL and PHP as well as perform statistical analysis and process the data through theRSoftware. Figure 1 shows the overall MWStat environment server structure.
The Appendix describes the implementation procedures focused on listing the procedures for creating the MWStat environment, as well as the software installation, settings and programming, at the expense of displaying the best hardware configuration for a computer (server) to implement the system, which is out of the scope of the paper.
3 Some Applications
Figure 1–General structure of the system environment.
3.1 Some introductory examples
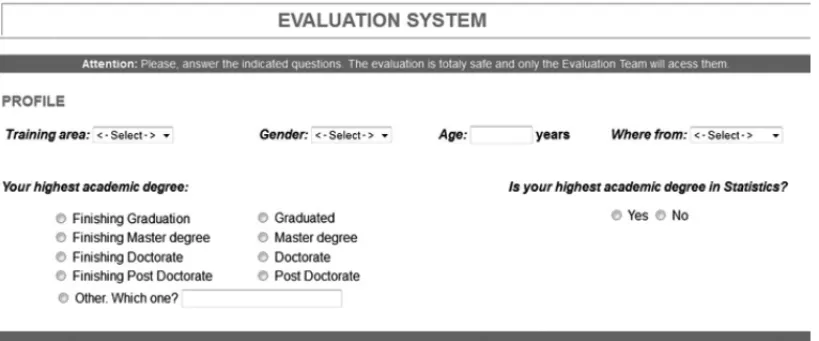
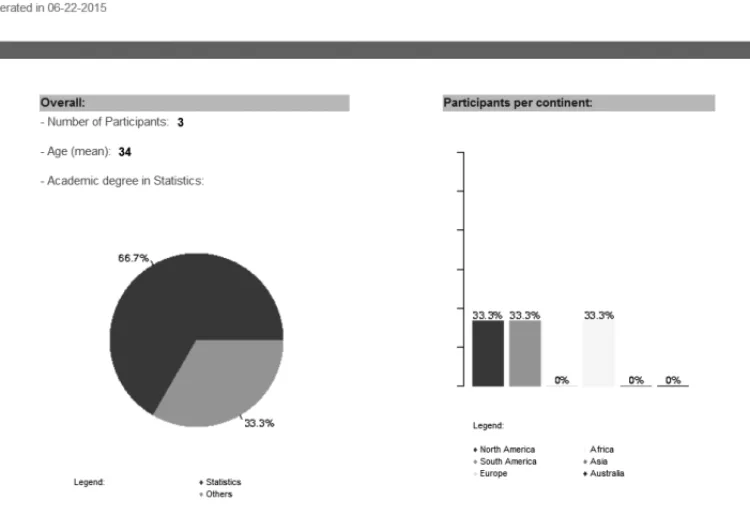
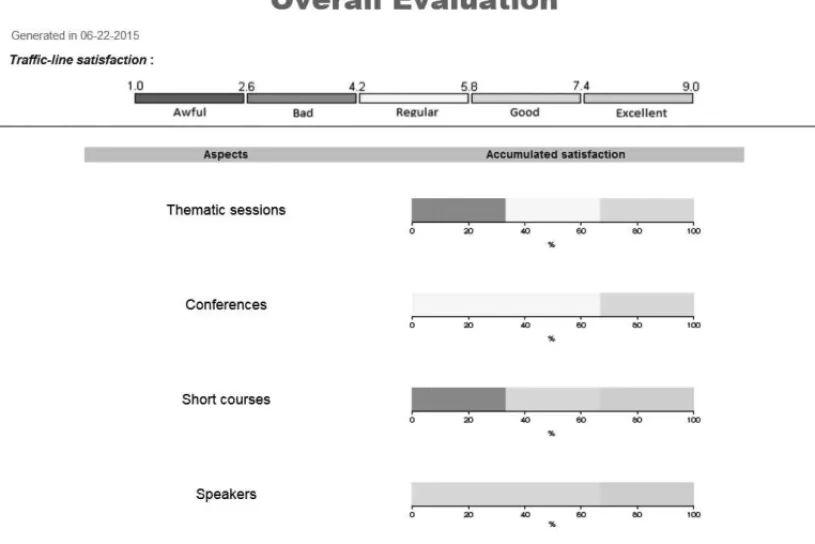
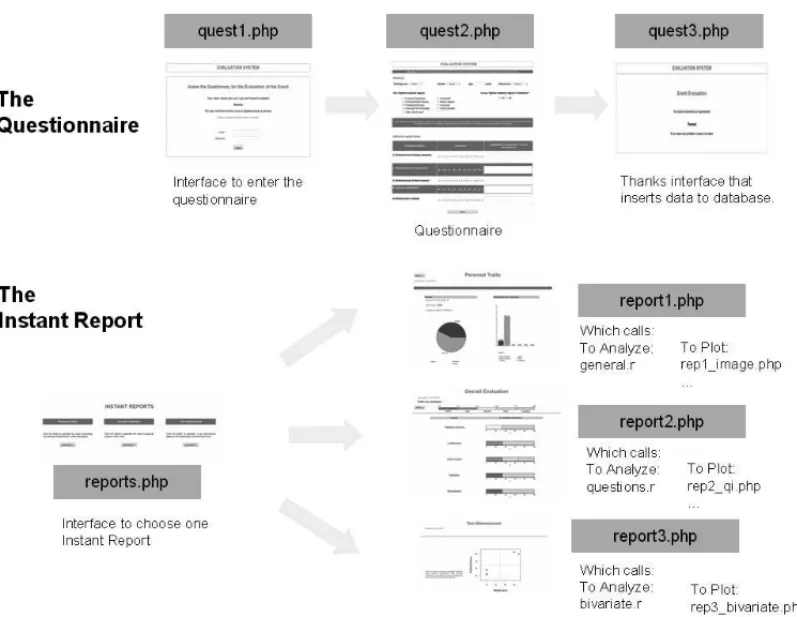
In this section, we display more three general didactical applications of the MWStat. The first one is based on a dynamic event evaluation which allows to measure the quality of scientific events, such as, confer-ences, symposia, meetings, workshops, among other. This example consists in 11 questions about academic purposes in a generic event. Participants answer an online questionnaire and an instant online report is pro-vided in real time. The files and their relationship for this example are shown in Figure 9. The files may be downloaded fromhttp://www.mwstat.comin a standalone fashion or can be found in the Sup-plementary Material, in the sense that an interested reader can easily reproduce the overall example. The Figure 2 shows the online questionnaire and Figures 3 and 4 show a part of the instant report.
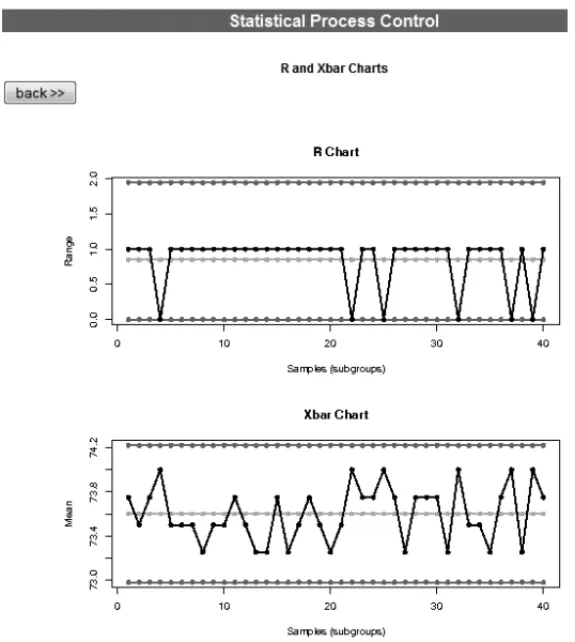
The second application is focused in statistical process control, the default dataset was taken from Mont-gomery’s book (Montgomery, 1991). It consists of 40 samples of size 4 to control of the diameter of the piston rings. The Figure 5 shows the online reports with a default dataset in SPC analysis.
The third example is based on a principal component analysis, the default dataset (Drapper & Smith, 1966) is composed by a sample of 4 variables about 21 days of operation of a plant oxidizing. The Figure 6 shows the online report with a default dataset for PCA analysis. The files may be downloaded fromhttp: //www.mwstat.comin a standalone fashion or can be found in the Supplementary Material, in the sense that an interested reader can easily reproduce the overall example.
Figure 2–Online questionnaire for the event evaluation example.
3.2 Institutional Evaluation Example
Figure 3–A part of the Instant personal traits report for the event evaluation example.
random password, with which it was possible to access the restricted area designated to the students. The password was randomly generated and encrypted in the database.
After each student answered the questionnaires designated to them, the environment sent a new e-mail thanking and confirming the successful storage of the responses. The answers are properly inserted into a MySQL database that safely only the database administrator (researcher) has access.
After each student performed his responses successfully, the homepage of the website is updated and a link to the evaluation results is provided. An instantaneous report can be viewed throughout all the evaluation.
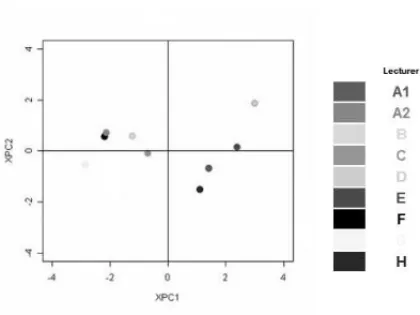
In the authentication area, programmed in PHP, the login and password of the individual are verified and, furthermore, the level of hierarchy of information compatible with his status is identified. In other words, how much information is provided to him. For instance, students may have a different level of information in comparison with the lectures they evaluated. In terms of illustration, let us consider that the login was made by the director for undergraduate studies in statistics. The director has access to the overall online report of his departmental lectures evaluation. An illustration of such report is shown in Figure 7. The report displays a principal component analysis, and the general evaluation of each particular aspect. However, other statistical methodologies can be straightforwardly considered.
Figure 4–Another part of the Instant personal traits report for the event evaluation example.
payment; remembering 165 students were sampled. Besides, their statistical analysis are based only on descriptive statistics and basic graphs; a principal component analysis could not be considered. SOCR has many possible statistical analyses but the environment is restricted by the developer’s Java applets and it is not customizable. R-PHP does not have any online procedure enabling data collection and analysis in real time.
Thus, each in its turn is overcome by the MWStat. Through the steps exposed in this paper, the MWStat arises as a environment which is able to carry out any number of online surveys, with unlimited number of questions and responses. Besides the MWStat performs any customized statistical analysis that may involve more general sophisticated procedures. With our open source technology it is possible to perform any kind of data collection and analysis in virtual environments, allowing the monitoring of the real-time results.
4 FINAL COMMENTS
Figure 5–A online report of the statistical control process example.
There is plenty of room for future developments of the MWStat. We believe almost all statistical techniques can be implemented by using the strategy proposed in the paper shifting the statistical paradigm from offline to online analysis, accessible to anyone with only internet access. For instance, we envisage new MWStat modules on methodologies such as time series for financial online analysis, online statistical quality con-trol, parametric and non-parametric bioequivalence tests, and so on. In general terms, by means of any method implemented on the R software, the MWStat can perform online collection, data analyses, results and even reports, providing real time up-to-date statistical methods available online to practitioners and researchers.
A possible challenge is to consider the MWStat for educational purposes, since it may provide a straight-forward path for learning statistics, without the need of installing any software but only an internet access.
Figure 8 presents the MWStat homepage (http://www.mwstat.com), where the presented examples may be tried as well as the entire codes of the first and second examples may be downloaded as a supple-mentary material, providing an straightforward way of interested readers to reproduce the statistical analysis presented here in their own servers, as well as develop their own R web based statistical applications.
Figure 6–A online report of the principal component analysis example.
Figure 7–Online report on view at course coordinator.
ACKNOWLEDGMENTS
The researchers of Francisco Louzada and Anderson Ara are supported by the Brazilian organisations CNPq and FAPESP.
REFERENCES
[1] BANFIELDJ. 1999. Rweb:Web-based Statistical Analysis.Journal of Statistical Software,4: 1–15. [2] COXJB & COXKB. 2008. Your Opinion, Please: How to Build the Best Questionnaires in the Field
of Education. Corwin Press, New York. 2nd Edition. 136 pp.
[3] DINOVID. 2006. Socr: Statistics online computational resource.Journal of Statistical Software,16: 1–20.
[4] DRAPPERNR & SMITHH. 1966. Applied Regression Analysis. John Wiley & Sons, New York. 1st Edition. 407 pp.
Figure 8–Website of the MWStat where possible developers may provide their statistical analysis modules for general users.
[6] FERNANDESS, CAPTIVOME & CLIMACOJA. 2007. Sabiloc: um sistema de apoio a decis˜ao para an´alise de problemas de localizac¸˜ao bicrit´erio.Pesquisa Operacional,27(3): 607–628.
[7] FRICKERS, GALESICM, TOURANGEAUR & YANT. 2005. An experimental comparison of web and telephone surveys.Public Opinion Quarterly,69(2): 370–392.
[8] GONDZIOJ &OTHERS. 1995. Hopdm (version 2.12)-a fast lp solver based on a primal-dual interior point method.European Journal of Operational Research,85(1): 221–225.
[9] GOULDNI, ORBAND & TOINTPL. 2015. Cutest: a constrained and unconstrained testing environ-ment with safe threads for mathematical optimization.Computational Optimization and Applications,
60(3): 545–557.
[10] HATANAKAM & YAMADAH. 2003. Co-trending: A Statistical System Analysis of Economic Trends. Springer-Verlag, Tokyo. 1st Edition. 115 pp.
[11] HORNER J. 2012. rApache: Web application development with R and Apache.http://www. rapache.net/
[12] JAMES DA & DEBROY S. 2006. RMySQL: R interface to the MySQL database. R pack-age version 0.5-11. Edition. https://cran.r-project.org/src/contrib/Archive/ RMySQL/RMySQL\_0.5-11.tar.gz
[13] JAMESL & WAREB. 2003. Open Source Web Development with LAMP: Using Linux, Apache, MySQL, Perl, and PHP. Addison Wesley. 1st Edition. 496 pp.
[14] KAYEB & JOHNSONT. 1999. Research methodology: Taming the cyber frontier.Social Science Computer Review,17(1): 323–337.
Statistical Software,17: 1–12.
[21] MONTGOMERYDC. 1991. Introduction to Statistical Quality Control, 2nd Edition. John Wiley & Sons, New York. 2nd Edition. 702 pp.
[22] NEIDERAUERJ. 2004. Php para quem conhece php: recursos avanc¸ados para a criac¸˜ao de websites dinˆamicos. S˜ao Paulo: Novatec Editora Ltda. 2aEdic¸˜ao. 480 pp.
[23] OASIS. 2015. Oasis.http://www.oasisdataarchive.org/
[24] PETTANKB. 2010. A pol´ıtica nacional de assistˆencia t´ecnica e extens˜ao rural (pnater): Percepc¸˜oes e tendˆencias. Ph.D. thesis, Universidade Estadual de Campinas – UNICAMP, Brazil.
[25] R-FIDDLE. 2015. R-fiddle.http://www.r-fiddle.org
[26] RSTUDIO. 2012. Integrated development environment for R (Version 0.96.122) [Computer software]. Boston, MA.http://www.rstudio.org/
[27] SALVADOREV. 2011. Percepc¸˜ao arquitetˆonica do espac¸o de trabalho pela comunidade universit´aria. Estudo de caso da UFSCar – Campus S˜ao Carlos. Master’s thesis, Universidade Federal de S˜ao Carlos, Brazil.https://repositorio.ufscar.br/handle/ufscar/4325. 142 pp.
[28] SCHRAMMF & MORAISDC. 2012. Decision support model for selecting and evaluating suppliers in the construction industry.Pesquisa Operacional,32(3): 643–662.
[29] SOLOMONDJ. 2001. Conducting web-based surveys.Practical Assessment, Research & Evaluation,
7(19): 1–4.
[30] TARNGW & LIOUH. 2006. The development of an internet virtual zoo.Advanced Technology for Learning,3(2) (E2): 69–81.
[31] YOUNG TUNG ST & SCHUENEMEYER JH. 1991. An expert system for statistical consulting.
Journal of Applied Statistics,18: 35–47.
APPENDIX: IMPLEMENTATION PROCEDURES
In this appendix we show the implementation of the environment in an Ubuntu LAMP server. The Linux operating environment was installed on a specific computer, following these steps:
1. Through the installation file from the Ubuntu 9.10 Linux, we create a CD to start the computer from it, in other words, do the boot from the CD. If the CD does not run automatically, we must configure the Setup (BIOS) for boot priority.
Figure 9–The files and their relationship in the event evaluation Example.
3. Start the installation, click Install Ubuntu Server.
4. After the detection of the network cards on the computer, we must perform the configuration of the static IP, in other words, the number for the network interface card eth0.
5. Name the server: OnlineSytem.
6. Choose a location: for example, S˜ao Paulo, Brazil.
7. After that, we started the disk partitioner through the “assisted partitioning – use entire disk” where in this case, all necessary partitions will be created automatically.
8. Inform the administrator user name and password.
9. Inform the Proxy server address, if any.
10. We must select the packages to be installed along with the environment: the LAMP Server.
11. Once the environment and the chosen services are installed, the server will restart.
After performing the procedures above, the server created can be accessed from any browser (eg. Internet Explorer, Mozilla, Opera etc) through its IP address, showed in Step 4.
Notice that in this case we use thenanotext editor, which is a traditional editor of the Linux Ubuntu. After opening this file, insert the following lines:
Alias /dados/home/usertest/
<Directory /home/usertest/>
Options Indexes FollowSymLinks
AllowOverride All
Order allow,deny
Allow from all
</Directory>
After running the commands above, files that are in the home directory/usertest/ can be accessed directly through a browser using the addressIP/data/.
Inside the directory/usertest/ we can create a new directory and save the phpmyadmin files there, where we can manage the tables in MySQL.
In this context, we must install theRsoftware on our server. We must enter the addresshttp://cran. r-project.org/bin/linux/ubuntu/and after that, perform the installation. The entire procedure can be done through the following commands:
sudo nano /etc/apt/sources.list
sudo apt-get update
sudo apt-get install r-base
After the construction to this entire structure, we still have to provide theRsoftware with the ability to generate graphics in the Linux environment. We applied ghostscript technology and used the following command line:
We must also provide theRsoftware with the ability to connect with the MySQL database. For such, we used the package RMySQL (James & DebRoy, 2006), installed with the command:
sudo apt-get install r-cran-rmysql
Directly from the server, we can run the software just by typing R in any directory. The commands inR
language to access the MySQL database are displayed below (they must necessarily be in .r format and saved on the server):
require(RMysQL)
con<-dbConnect(dbDriver("MySQL",)
user="username", dbname = "databasename", password="passwd")
dados=dbGetQuery(con,paste("select * from tablename"))
Since, we can edit.phpfiles using the resources installed on the server. By programming in PHP, we can run directly from web pages files written inRlanguage. The codes below access files.rthrough the PHP language, statistical.r. This file refers to calculations that have value vectors or images as output. For example, a vector of means, which will be assigned to the variable php$resor graphs generation codes.
$command=”echo′argv <− \”statistical.r\”;
source(argv)′”|”.”/usr/bin/R\\ − −vanilla − −slave”;