2017
Miguel Ignez Jorge de Ramirez Cordeiro
Licenciado em Ciências de Engenharia CivilEfficiency Assessment of
Seismic Retrofitting
Using Buckling Restrained
Braces
Dissertação para obtenção do Grau de Mestre em Engenharia Civil - Perfil Estruturas
Orientador: Professor Doutor Corneliu Cisma¸siu, Professor Associado, FCT/UNL
Júri:
Presidente: Professor Doutor João C. G. Rocha Almeida
i
Efficiency Assessment of Seismic Retrofitting
Using Buckling Restrained Braces
“Copyright” Miguel Ignez Jorge de Ramirez Cordeiro, FCT/UNL e UNL
Acknowledgements
First and foremost, I would like to thank Dr. Corneliu Cisma¸siu for his guidance, knowledge and specially his patience. When things didn’t go as expected Dr. Corneliu’s understanding and trust were key, and for that I am grateful.
Second, I would like to thank Faculdade de Ciências e Tecnologia da Universidade Nova de Lisboa for providing full access to the Civil Engineering Departement’s Computer lab, without which it was impossible to conclude this dissertation. A word of acknowledgement to Dr. Corneliu, again, for speeding up the access process and trusting me with the faculty’s precious equipment.
A special thanks to my FCT friends and colleagues, specially Jorge Cruz, Delcio Macaia, Nuno João Monteiro, Hugo Rebelo, Bernardo Albergaria and César Campos, for the support, uncountable discussions, unlimited work breaks and good times. To you all my very sincere thank you and wish you nothing but good fortune for the future to come.
To my childhood and long time friends, I leave you the greatest of acknowledgements, you’re friendship and support means the world to me. I hope we can continue to cherish it for countless years to come. Life has its ups and downs and it hasn’t always been easy. Specially to Gaio, Gonçalo, Inês, Joana, Jorge and Tomé you’ve been there through them all, you make the ups higher and the downs shallower. Wish you nothing but the best and will be there whenever you need me.
Last but not least, my most sincere and biggest thank you to my family, for their unconditional love and support. Everything I am today its because of you, of what you’ve provided and the belief you’ve deposit in me. My special sign of gratitude to my parents, for being the perfect parents for an imperfect child. Hope you’re proud.
Abstract
The main purpose of the present dissertation is to study the efficiency of buckling restrained braces (BRB) when used as seismic dampers in reinforced concrete frame structures.
The study was conducted on the RC frame structure reported by Sarno and Manfredi. Their experimental campaign results, available for the structure with and without BRBs, were used to calibrate a numerical model implemented in the FE programSeismoStruct.
A probabilistic approach was used next to assess the efficiency of the BRBs. Following the provisions of the Probabilistic Model Code of the Joint Committe of Structural Safety, several key parameters in the FE model were assumed to have a probabilistic distribution. Random generation of their values allowed to create 50 numerical models of the structure.
Subsequent non-linear incremental dynamic analysis preformed on these structures without any type of bracing, provided with BRB and traditional bracing, yielded fragility curves that can be used to estimate the damage reduction in the controlled structures and assess efficiency of the BRBs when used as seismic retrofitting.
Buckling restrained braces have shown to be capable of reducing the damage caused by strong ground motions due to seismic actions.
Keywords:
Non-linear dynamic analysis, Finite Elements, Buckling Restrained Braces, Fragility.
Resumo
O principal objetivo da presente dissertação é o estudo da eficácia dos contraventamentos de encurvadura impedida (BRB) como amortecedores sísmicos em estruturas de betão armado.
O estudo foi conduzido na estrutura porticada de betão armado apresentada no estudo experimental de Di Sarno e Manfredi. Os resultados da sua campanha experimental, disponíveis para a estrutura com e sem BRBs, foram usados como base para a calibração de um modelo numérico implementado no software de elementos finitosSeismoStruct.
Foi adotada uma abordagem probabilística para aferir a eficácia dos BRBs. Seguindo as provisões doProbabilistic Model Code da Joint Committe of Structural Safety, alguns parâmetros chave do modelo de EF considerou-se terem uma
distribuição probabilística. Através da geração aleatória dos seus valores 50 modelos numéricos da estrutura foram criados.
Subsequentemente, através de análises dinâmicas incrementais (IDA) realizadas nessas estruturas, sem qualquer contraventamento e com BRBs, foram desenvolvidas curvas de fragilidade que possibilitam uma estimativa da redução de dano nas estruturas controladas e uma avaliação da eficácia dos BRBs quando utilizados como reforço sísmico.
Os BRBs mostraram serem capazes de reduzir o dano causado por fortes ações sísmicas neste tipo de estruturas.
Palavras chave:
Análise dinâmica não-linear, Elementos Finitos, Contraventamentos de encurvadura empedida, Fragilidade.
Resumo alargado
Introdução
Os sismos são conhecidos por causar graves problemas à sociedade, especialmente em regiões com alta sismicidade. São dos fenómenos naturais mais perigosos, não só pelo elevado número de perdas humanas e patrimoniais, mas também devido à sua elevada imprevisibilidade.
Um acontecimento sísmico de grande importância para Portugal ocorreu em Novembro de 1755. Lisboa foi abalada por um sismo de 8.5 na escala de magnitude de momento, despoletando vários incêndios e um tsunami. O ano de 1755 foi um grande marco, uma vez que na reconstrução da cidade foram utilizados sistemas de mitigação das ações horizontais. Foram utilizadas estruturas porticadas de madeira capazes de resistir às cargas verticais, mas flexíveis o suficiente para não sofrerem danos significativos quando sujeitas a ações sísmicas.
Desde então, a engenharia tem vindo a evoluir e novos códigos e regulamentações de projeto foram aparecendo assim como soluções de reforço estrutural. No entanto, nem todos os edifícios existentes foram construídos segundo as exigências atuais, sendo que muitos destes edifícios antigos possuem fraca resistência lateral. Estas estruturas não possuem o espaçamento adequado dos estribos nas vigas, pilares e nós estruturais, resultando numa fraca resistência ao corte destes elementos. Baixa percentagem de armadura longitudinal, betões de baixa resistência e varões de aço lisos são encontrados em muitos desses edifícios.
Para atenuar estas deficiências uma técnica de reforço bastante utilizada consiste na utilização de contraventamentos para conferir à estrutura resistência horizontal adicional. O mais comum, consiste na utilização de perfis metálicos dispostos num determinado padrão por forma a dar ao edifício alguma resistência lateral. Este tipo de reforço funciona até um certo ponto, uma vez que a encurvadura destes perfis esbeltos reduz significativamente a capacidade que estes têm de absorver esforços.
Uma técnica alternativa utilizada correntemente são os contraventamentos com a sua encurvadura impedida. O principio base destes dispositivos é de impedir a ocorrência da encurvadura e, dessa forma, permitir que os perfis continuem a absorver esforços. Na Figura 1 é apresentada uma ilustração de um contraventamento de encurvadura impedida (BRB) e os seus principais componentes.
Como foi mencionado anteriormente, os sismos causam grandes perdas quer ao
x
Figura 1: Composição típica de um BRB [1]
nível de vidas humanas, quer ao nível de património edificado, traduzindo-se em grandes perdas socioeconómicas. Assim sendo, o estudo e investigação, não só de novas técnicas de projeto, mas também técnicas de reforço sísmico são de grande importância em Engenharia Civil. Na presente dissertação é investigada, através de um estudo de vulnerabilidade e fragilidade, a eficiência do uso de BRBs como reforço sísmico.
Contraventamentos de Encurvadura Impedida
Contraventamentos convencionais são utilizados correntemente em Engenharia Civil para resistir a ações horizontais, no entanto devido à sua esbelteza estes ao sofrerem encurvadura perdem a capacidade de suster essas solicitações, e exibem ciclos histeréticos fechados, Figura 2.
Figura 2: Comportamento típico dos contraventamentos convencionais (adaptado de [2]).
xi
transversal no caso de cedência à compressão; e por fim, um segmento de transição reforçado, responsável por fazer a ligação à estrutura e por garantir que a cedência ocorre no núcleo restringido e não nos segmentos de ligação. Na Figura 3 podemos observar algumas das configurações propostas até hoje.
Figura 3: Configurações da secção transversal dos BRBs. [3]
Ao restringir a ocorrência da encurvadura, o contraventamento passa a exibir comportamentos semelhantes à compressão e tração, demonstrando um comportamento histerético melhorado, com ciclos de carga e descarga mais abertos, Figura 4.
Figura 4: Comparação do comportamento de contraventamentos convencionais e dos BRBs. [4]
Para obter este comportamento o sistema de separação entre o núcleo e o membro restringente é de extrema importância, pois garante que o núcleo desliza livremente e permite a expansão do núcleo em caso de cedência à compressão. Muitos materiais, como silicone, telas de vinil, diferentes tipos de espumas, entre outros, foram testados como sistema de separação, assim como o recurso a espaçamentos de espessura variada.
As ligações destes dispositivos também foram alvo de vários trabalhos de investigação: ligações aparafusadas, ligações pin, diferentes placasgusset, entre
outros.
Atualmente, na Europa, o dimensionamento de BRBs não está presente nos regulamentos [5], no entanto, existem regulamentos que permitem o uso destes dispositivos fornecendo recomendações de teste, performance e manutenção, como em [6] e [7].
xii
capacidade de absorver energia. Em 2000 a Nippon Steel & Sumitomo publicou um relatório técnico [8] onde 11 BRBs com diferentes características foram ensaiados em 5 ensaios experimentais. Os resultados demonstraram que os dispositivos podiam aguentar cerca de 200 ciclos de carga e uma extensão de ±0.75% correspondendo a um ângulo de drift de 1/100, antes da rutura.
Os autores concluíram que os ensaios clarificaram as propriedades de fadiga dos dispositivos, assim como o suficiente comportamento histerético para serem aplicados como amortecedor sismico.
Nos dias de hoje existem edifícios a tirar partido deste tipo de dispositivos. A Nittele Tower no Japão, sede da Nippon Television [9], é um exemplo da utilização prática destes dispositivos, assim como o edifício federal Wallace F. Bennett em Salt Lake City, nos Estados Unidos da América, no qual se recorreu ao uso de BRBs, não só como uso estrutural, mas também arquitetónico.
Caso de Estudo
Na presente dissertação, o trabalho experimental desenvolvido por L. Di Sarno e Manfredi [10] serviu de base para a calibração dos modelos numéricos e consequente validação.
Modelos Experimentais
Foram ensaiadas duas estruturas porticadas de betão armado idênticas, à escala real. As estruturas contêm dois pórticos de 2,55m numa direção e um único pórtico de 4,40m na outra direção ortogonal. Contêm dois pisos com alturas de 3,5m e 3,44m para o primeiro e segundo piso respetivamente. As lajes dos pisos têm uma espessura de 25cm para o primeiro e 20cm para o segundo piso. As plantas e cortes transversais das estruturas são apresentados na Figura 5. Por sua vez, na Figura 6 estão representadas as secções transversais das vigas e pilares das estruturas, juntamente com a armadura longitudinal e transversal. As fundações são compostas por um ensoleiramento geral de 6m por 7m, e uma espessura de 50cm.
As estruturas foram deliberadamente dimensionadas com deficiências estruturais, sem estarem em concordância com os códigos vigentes. Os materiais de construção, tanto o betão como as armaduras, possuem baixas resistências quando comparadas com o exigido pelos regulamentos.
O betão possui uma resistencia média à compressão defcm=19,4MPa, calculada através de ensaios realizados em 21 provetes cubicos retirados de vigas, pilares e vigas, e apresenta um módulo de elasticidade deEcm =26672MPa. Através de ensaios realizados em varoes de aço, aferiram-se os valores médios apresentados na Tabela 1.
A estrutura foi dimensionada tendo em conta apenas as cargas verticais, de acordo com [11]. A laje de 25cm do primeiro piso inclui as cargas permanentes, recobrimento e paredes divisórias, perfazendo um total de 8,13kN/m2. O mesmo
princípio foi aplicado à laje de cobertura, perfazendo um total de 5,43kN/m2. A
xiii
Figura 5: Plantas e cortes transversais das estruturas de teste [10]
Sistema de Reforço
xiv
Figura 6: Representação das secções transversais das vigas e pilares das estruturas de teste [10].
Tabela 1: Propriedades mecânicas das armaduras [10]
Rácio tensão última/tensão de
cedência Tensão de
cedência (Limite inferior)
Tensão de cedência
(Limite superior)
Tensão de rutura
Limite inferior
Limite superior
Extensão última
[MPa] [MPa] [MPa] [-] [-] [%]
Média 334.1 348.1 444.0 1.33 1.28 41
DP* 14.4 10.8 36.62 0.07 0.09 5
COV (%) 4.3 3.1 8.25 5.55 7.21 13
*Desvio padrão
Os tubos estruturais foram dimensionados por forma a não prejudicarem o funcionamento dos BRBs, com uma força última superior à dos dissipadores.
Campanha Experimental
xv
Tabela 2: Parâmetros mecânicos dos BRBs do primeiro e segundo piso
Comprimento Força de
cedência Força máxima
Rigidez axial elástica
[m] [kN] [kN] [kN/mm]
Piso térreo 0.91 75 90 70
Primeiro piso 1.10 40 50 40
rutura (Pushover). As frequências modais da estrutura foram estimadas através da análise do ruído ambiente e de vibrações impostas, com recurso a martelo de impacto. Por forma a recolher os dados do ensaio, as estruturas foram devidamente instrumentadas, com acelerómetros, extensómetros, transdutores e medidores laser, Figura 7. Na presente dissertação, quando referidos os eixos ortogonais X e Y estes referem-se aos representados na Figura 7.
Figura 7: Posicionamento dos acelerómetros durante a campanha experimental [10].
Resultados Experimentais
Resposta Modal
Na Tabela 3 estão apresentados os valores das frequências de vibração para a estrutura simples e reforçada.
Resposta Lateral Monotónica
Foi executado um teste pushover estático e posteriormente foram obtidas as curvas de capacidade para cada uma das estruturas, simples e reforçada. Na Figura 8 está representada a curva de capacidade da estrutura simples.
xvi
Tabela 3: Frequências de vibração, em hertz, estimadas experimentalmente para a estrutura simples e reforçada [10]
Modos de vibração
1º 2º 3º 4º 5º 6º
Input Estrutura Lateral
X
Lateral
Y Torção
Lateral X
Lateral
Y Torção
Ruído ambiente
Simples 3.15 3.30 4.75 8.80 9.31 13.10
Reforçada 3.15 3.30 n.a. 8.85 9.36 n.a. Impacto
martelo
Simples 3.15 3.40 4.75 9.13 9.24 13.08
Reforçada 3.15 3.30 4.84 8.76 9.25 12.94
Figura 8: Curva de capacidade da estrutura simples (adaptado de [10])
Figura 9: Curva de capacidade da estrutura reforçada (adaptado de [10])
Desenvolvimento e Calibração do Modelo Numérico
xvii
e outro modelo da estrutura reforçada com os BRBs, daqui em diante denominada "‘Estrutura BRB"’. Foi criado um modelo adicional da estrutura de teste, desta vez reforçada com contraventamentos tradicionais, denominada "‘Estrutura CBF"’. Os modelos numéricos foram desenvolvidos no programa de elementos finitos
SeismoStruct, com base nos desenhos de projeto (Figuras 5 e 6) e os materiais
definidos anteriormente.
Estrutura Simples
Inicialmente, todos os materiais foram corretamente definidos e introduzidos no SeismoStruct, tendo sido utilizada uma relação não linear e uniaxial de
confinamento constante para modelar as relações constitutivas do betão.
As relações constitutivas do aço utilizado nas armaduras foram moduladas recorrendo a uma simples relação tensão-extensão proposta por Menegotto e Pinto [13] com regras de endurecimento isotrópico sugeridas por Filipou et al. [14]. Com os materiais devidamente definidos, as secções transversais e distribuição das armaduras foram implementadas no programaSeismoStruct, de acordo com
o estipulado na Figura 6.
Foram definidos os tipos de elementos numéricos para representar cada um dos elementos estruturais. Um elemento de frame 3D force-based inelástico
foi adotado para as vigas e colunas, permitindo considerar a não linearidade geométrica e dos materiais. Para a configuração destes elementos têm de ser selecionados uma secção transversal, o número de secções de integração e o número de fibras. Nas vigas, 200 fibras individuais e 7 secções de integração foram selecionadas. Por sua vez, os pilares foram subdivididos em 300 fibras longitudinais e foram adotadas 7 secções de integração.
Para a modelação das lajes, foi considerada uma combinação de elementos de frame elásticos, juntamente com restrições do tipo diafragma rígido, como
demonstrado na Figura 10.
Os elementos de frame elásticos adicionados ao modelo numérico possuem as
mesmas características da respetiva laje: rigidez axial, rigidez de flexão nas duas direções e ainda rigidez de torção.
Adicionalmente, elementos de massa pontual foram adicionados para considerar o peso próprio e as cargas de projeto. Uma vez que a estrutura é simétrica, foram definidos apenas dois elementos de massa pontual dispostos de acordo com o ilustrado na Figura 10.
Finalmente, para simular o ensoleiramento geral todos os pilares foram considerados encastrados.
Após a definição do modelo numérico, a campanha experimental foi recriada numericamente para calibrar e validar o modelo.
Resposta Modal
xviii
Figura 10: Solução adotada para a modelação das lajes
Tabela 4: Frequências de vibração: Estrutura Real vs. Modelo Numérico
Modo Estrutura Real Modelo
Numérico Erro
[Hz] [Hz] [%]
1 3.15 3.157 0.233
2 3.30 3.261 1.183
3 4.75 4.695 1.151
4 8.80 8.280 5.913
5 9.31 8.383 9.952
6 13.10 12.046 8.045
Para os três primeiros modos de vibração existe uma grande proximidade dos valores das frequências, com o erro relativo para estes abaixo dos 2%. Nos três restantes modos verificou-se uma maior disparidade, mas sempre com erros abaixo dos 10%, o que foi considerado aceitável.
Pushover Estático
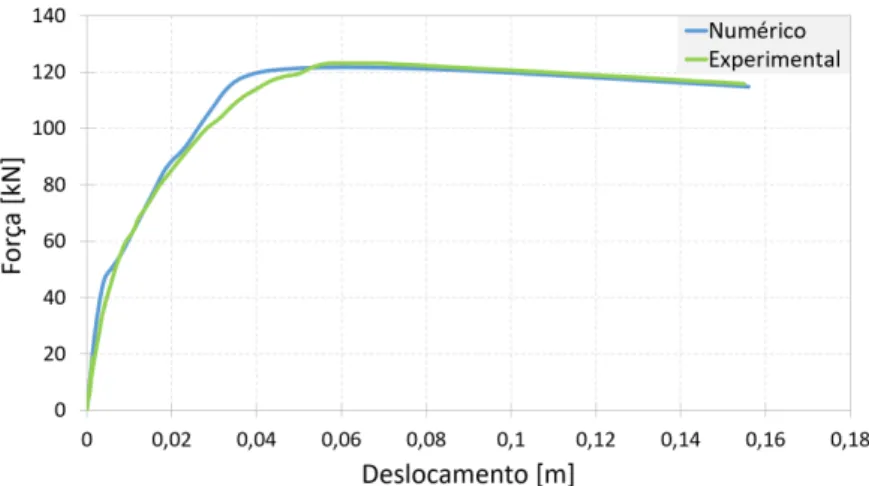
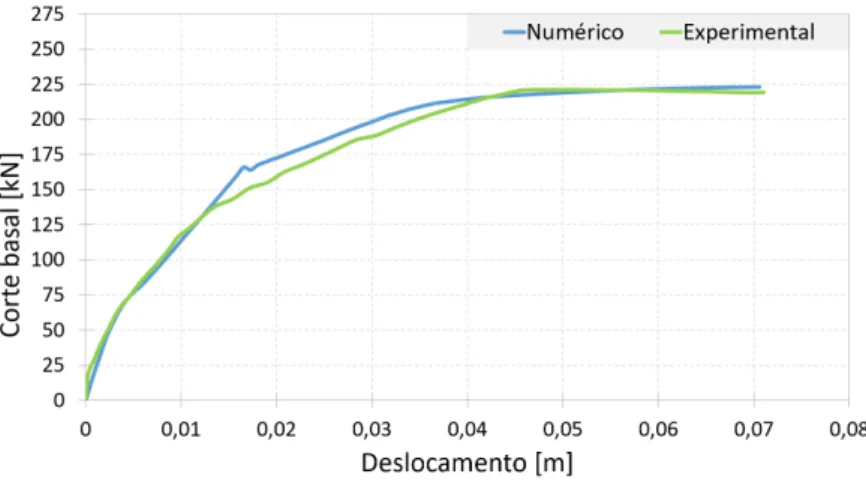
Foi recriada a análise pushover estática na direção longitudinal (Y), resultando desta análise a curva de capacidade numérica da estrutura. Na Figura 11 é apresentada uma comparação entre as curvas de capacidade da estrutura real e do modelo numérico. As curvas apresentam um traçado idêntico, sendo o maior erro relativo de aproximadamente 5%.
Foi também realizada uma análise pushover na direção transversal (X) e obteve-se a respetiva curva de capacidade. Na Figura 12 apresenta-se uma comparação das curvas de capacidade em ambas as direções.
xix
Figura 11: Comparação entre as curvas de capacidade da estrutura real e do modelo numérico
Figura 12: Comparação das curvas de capacidade numéricas em ambas as direções ortogonais
foi considerado calibrado e validado.
Estrutura BRB
Para proceder à validação da Estrutura BRB é de extrema importância que o sitema de reforço, seja corretamente calibrado e validado.
Calibração dos BRBs
Para tal, três modelos numéricos foram desenvolvidos: modelo do BRB isolado, modelo do conjunto BRB com o tubo estrutural e um modelo de um só elemento equivalente ao conjunto anterior. Para cada modelo foi realizado um teste de compressão e de tração numéricos.
xx
de±20mm.
Modelo Numérico do BRB Isolado
Para a modelação dos BRBs foi considerada uma secção circular com diamêtro de 0.1016m, juntamente com a relação constitutiva Dodd-Restrepo para o aço, assim como um elemento de treliça presente noSeismoStruct.
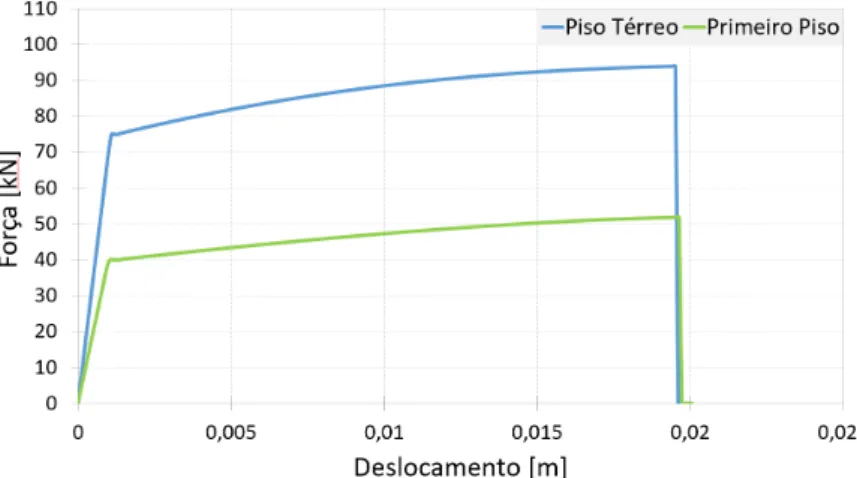
Nas Figuras 13 e 14 são apresentadas as curvas força-deslocamento dos ensaios numéricos de tração e compressão, respetivamente. Pode ser observado que estão em conformidade com os dados da Tabela 2.
Figura 13: Curvas força-deslocamento do ensaio de tração do modelo numérico do BRB isolado.
Figura 14: Curvas força-deslocamento do ensaio de compressão do modelo numérico do BRB isolado.
Modelo Numérico do Conjunto Tubo e BRB
Com os BRBs calibrados procedeu-se à adição dos tubos estruturais no
xxi
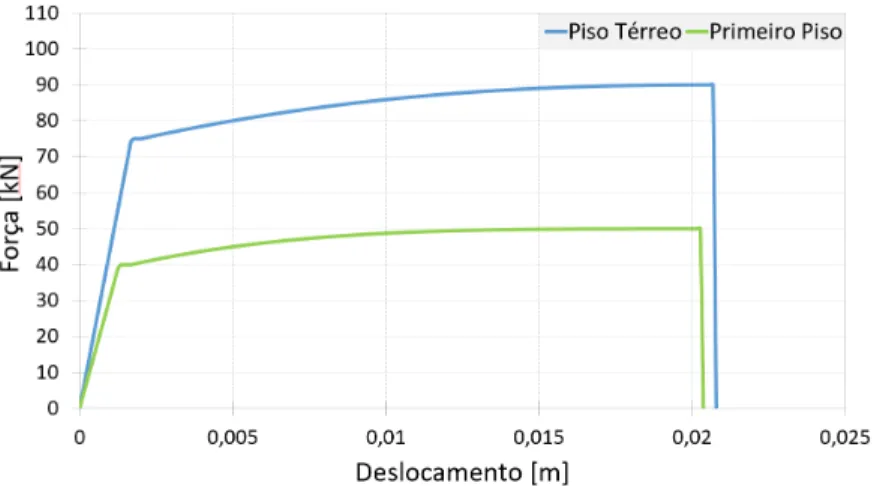
e 6.3mm de espessura, constituído por um aço de classe de resistência S275. Nas Figuras 15 e 16 estão representadas as curvas força-deslocamento para os dois ensaios numéricos conduzidos, onde se pode observar que a presença dos tubos não prejudica de maneira alguma o comportamento dos BRBs.
Figura 15: Curvas força-deslocamento do ensaio de tração do modelo numérico do conjunto tubo e BRB.
Figura 16: Curvas força-deslocamento do ensaio de compressão do modelo numérico do conjunto tubo e BRB.
Modelo Numérico Equivalente
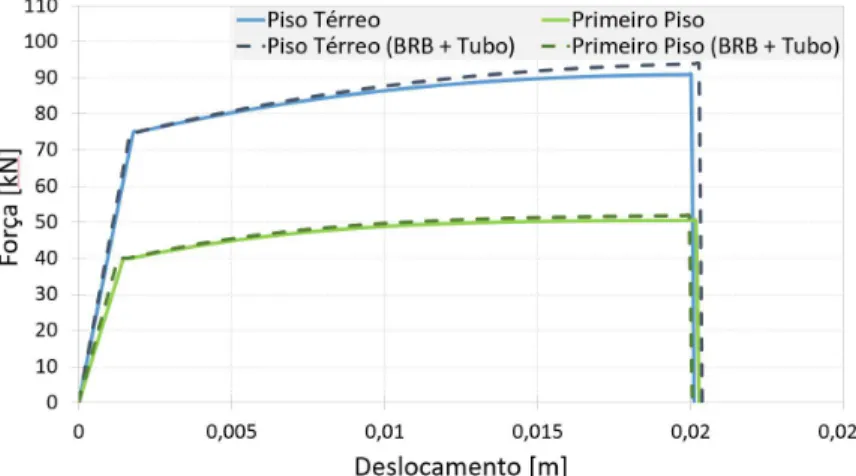
No modelo anterior era necessário um nó estrutural a fazer a ligação entre o tubo e o BRB, sendo que este pormenor levanta problemas em termos de compatibilidade de deslocamentos, uma vez que este nó de ligação tem de restringir todas as rotações nas três direções ortogonais. Para tal, foi considerada uma solução equivalente, composta por um só elemento de treliça capaz de substituir os dois componentes, mantendo o mesmo comportamento mecânico. Foi adotada uma secção circular sólida com os mesmos 101.6mm de diâmetro.
xxii
ensaios numéricos do modelo do conjunto tubo e BRB, e o modelo equivalente. Pode ser observado que o modelo equivalente representa bem o comportamento do conjunto.
Figura 17: Curvas força-deslocamento do ensaio de tração do modelo equivalente.
Figura 18: Curvas força-deslocamento do ensaio de compressão do modelo equivalente.
Com o sistema de reforço devidamente calibrado, procedeu-se à validação da Estrutura BRB, começando por recriar o esquema de reforço experimental e, posteriormente, proposta uma nova solução de reforço.
Validação do Esquema de Reforço Experimental
xxiii
Tabela 5: Frequências de vibração: Estrutura real reforçada vs. Modelo numérico reforçado
Modo Estrutura real Modelo
numérico Erro
[Hz] [Hz] [%]
1 3.15 3.157 0.233
2 3.30 3.261 1.183
3 4.84 4.695 2.989
4 8.76 8.280 5.484
5 9.25 8.383 9.369
6 12.94 12.046 6.908
Na Figura 19 é apresentada uma comparação das duas curvas de capacidade, tanto da estrutura real como do modelo numérico, podendo ser constatado que as curvas têm um traçado similar nunca passando um erro relativo de 8%.
Figura 19: Comparação entre as curvas de capacidade da estrutura real e do modelo numérico.
Validação dos Esquema de Reforço Proposto
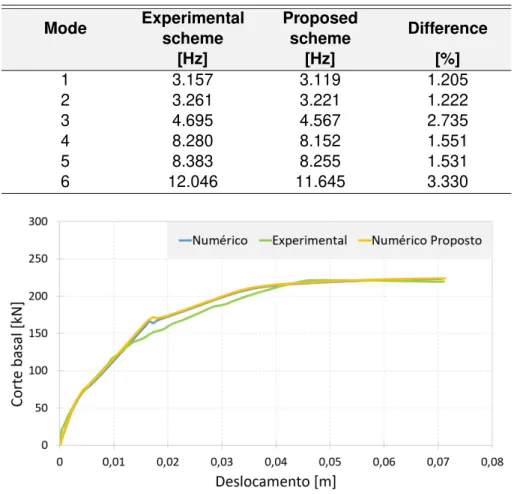
O esquema de reforço proposto consiste em aplicar a mesma "‘quantidade"’ de BRBs nas duas direções ortogonais, sendo que na direção longitudinal o reforço é aplicado nos dois pórticos. Esta proposta surge no sentido de mitigar os efeitos de torção resultantes da excentricidade entre o centro de massa e o centro de rigidez que ocorre no esquema experimental. Foi realizada uma análise modal e pushover para comparar o esquema proposto com o esquema experimental. Na Tabela 6 são comparados os valores das frequências de vibração. Na Figura 20 é apresentada uma comparação entre as curvas de capacidade da estrutura real reforçada, do modelo numérico reforçado com o esquema experimental e o modelo numérico reforçado com o esquema proposto.
xxiv
Tabela 6: Frequências de vibração: Esquema de reforço experimental vs. Esquema de reforço proposto.
Mode Experimental scheme
Proposed
scheme Difference
[Hz] [Hz] [%]
1 3.157 3.119 1.205
2 3.261 3.221 1.222
3 4.695 4.567 2.735
4 8.280 8.152 1.551
5 8.383 8.255 1.531
6 12.046 11.645 3.330
Figura 20: Comparação entre as curvas de capacidade da estrutura real reforçada, do modelo numérico reforçado com o esquema experimental e o modelo numérico reforçado com o esquema proposto.
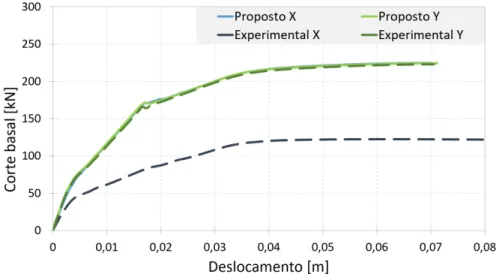
esquemas de reforço, ficando evidente a disparidade de comportamento entre as duas direções no esquema de reforço experimental.
A Estrutura BRB foi então validada e considerada como ponto de partida para criação dos 50 modelos para o estudo de fragilidade.
Avaliação da Vulnerabilidade Sísmica
Uma vez validados os modelos numéricos, o passo seguinte passou pela realização da avaliação da vulnerabilidade sísmica.
Ação Sísmica
xxv
Figura 21: Comparação entre as curvas de capacidade para os dois tipos de reforço, nas duas direções ortogonais.
não-estacionário considerando os efeitos de falha finita, através do programa RSSIM integrado no simulador LNECloss desenvolvido pelo LNEC [15]. Foram consideradas várias direções de rutura, norte-sul, sul-norte e aleatória ao longo da extensão das falhas, assim como magnitudes de 7.2 e 7.5 para a falha de Marquês de Pombal, e de 7.8 para falha da Ferradura, na escala de Richter. A título de exemplo, é apresentado na Figura 22 um dos acelerogramas gerados.
Figura 22: Acelerograma Faro falha da Ferradura direção Norte-Sul
Com os acelerogramas gerados, 50 cenários sísmicos foram considerados, com durações entre 20.57s e 94.64s. Todos os acelerogramas foram escalados para uma aceleração máxima de 1g, por forma a serem introduzidos no SeismoStruct
xxvi
Parâmetros Chave e Variabilidade Probabilística
Para entrar em consideração com incertezas físicas e mecânicas, os modelos numéricos foram desenvolvidos assumindo para alguns parâmetros chave uma distribuição probabilística, de acordo com o JCSS model code [16]. A Tabela 7
aprensenta esses parâmetros chave e as respetivas distribuições.
Tabela 7: Caraterização probabilística dos parâmetros chave.
Parâmetros chave Distribuição Média DP Unidades Resistência à compressão do
betão (fc) Lognormal 19.4 1.3
MPa
Peso volúmico do betão (ρc) Normal 24 0.96 kN/m3
Tensão de cedência do aço (fy) Normal 341.4 12.6 MPa
Assim, 50 cenários foram gerados, com os paramêtros a variar segundo as respetivas distribuições probabilísticas, estando estes apresentados na Figura 23.
Resistência à compressão do betão [MPa]
16 18 20 22 24
Número de amostras 0 5 10 15 20
(a) Resistência à compressão do betão
Peso volúmico do betão [kN/m3]
20 22 24 26 28
Número de amostras 0 5 10 15 20
(b) Peso volúmico do betão
Tensão de cedência do aço [MPa]
300 320 340 360 380 Número de amostras 0
5 10 15 20
(c) Tensão de cedência do aço
Figura 23: Distribuição probabilística dos parâmetros chave.
xxvii
Figura 24: Evolução do desvio padrão ao longo do espaço amostral.
Figura 25: Evolução do erro relativo do desvio padrão ao longo do espaço amostral.
Análise Dinâmica Incremental
Definidos os 50 cenários sísmicos e os 50 modelos numéricos, de acordo com as variações probabilísticas, podem ser realizadas as 150 análises dinâmicas incrementais. Numa análise dinâmica incremental a estrutura é submetida a um série de análises dinâmicas não lineares no tempo de intensidade crescente. É depois gerado um gráfico que relaciona o valor máximo de deslocamento com o correspondente valor da força de corte basal para cada análise não linear no tempo de diferente intensidade, dando origem à curva IDA ou pushover dinâmico, Figura 26.
Estados de Dano
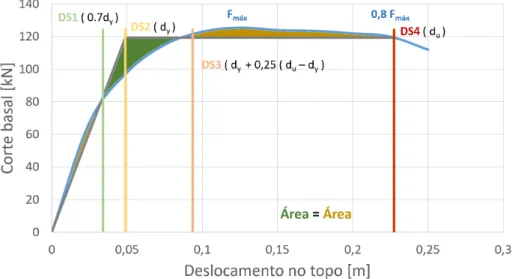
Com as curvas IDA definidas, definiram-se os estados de dano associados a cada curva, de acordo com Vargas [17], sendo que a definição de cada estado de dano pode ser consultada na Tabela 8 e na Figura 26.
Curvas de Fragilidade
xxviii
Figura 26: Curva IDA, juntamente com a sua representação bilinear e respetivos estados de dano.
Tabela 8: Definição dos estados de dano.
Estados de dano
DS1 = 0.7·Dy
DS2 =Dy
DS3 =Dy+ 0.25·(Du−Dy)
DS4 =Du
P[DS|Sd] = Φ
1
βDS ·ln
Sd
Sd,DS
(1)
e os valores de probabilidade para cada estado de dano são dados por:
P(D0) = 1−P[ds1|Sd] (2)
P(Dk) =P[dsk|Sd]−P
dsk+1|Sd
(3)
P(D4) =P[ds4|Sd] (4)
com k = 1, 2 e 3.
Foram construídos três conjuntos de curvas de fragilidade para cada uma das estruturas (Simple e BRB), uma na direção X, na direção Y e uma combinando as duas direções, contemplando o estado de dano mais gravoso. Daqui resultaram três conjuntos de curvas globais para cada uma das estruturas.
Resultados e Comparação
xxix
solo (Peak Ground Aceleration - PGA) de 0,3g, para o qual foram calculadas as
probabilidades de atingir determinado dano. Este nível de PGA corresponde ao nível de projeto estipulado no Eurocódigo 8 [18], na região de Faro, Portugal. Devido a problemas de análise de resultados as curvas de fragilidade foram refeitas ao nivel dos pilares da estrutura em vez da estrutura global.
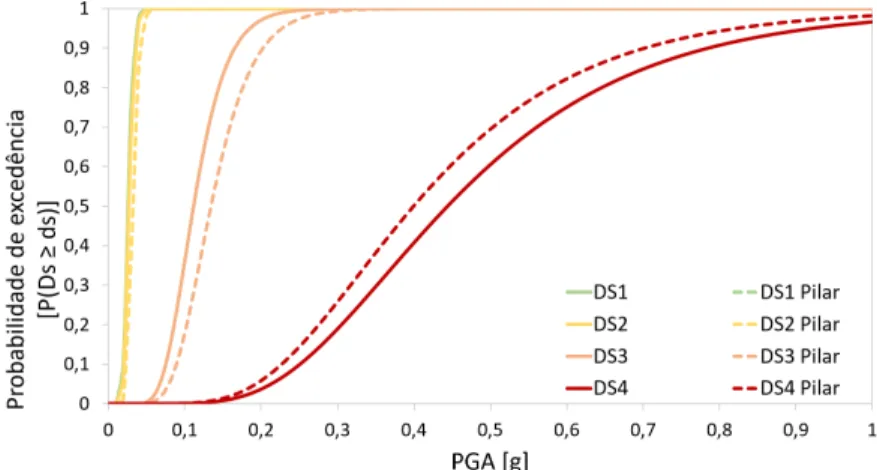
Nas Figuras 27 e 28 apresentam-se as curvas de fragilidade globais e os valores das probabilidades de cada estado de dano para um nível de PGA de 0,3g para a Estrutura Simples.
Figura 27: Comparação entre as curvas de fragilidade ao nível do topo e ao nível dos pilares da Estrutura Simples.
Figura 28: Comparação entre os valores de probabilidade de excedência dos estados de dano ao nível do topo e ao nível dos pilares da Estrutura Simples, para um nível de PGA de 0,3g.
No caso da Estrutura BRB podem ser observadas nas Figuras 29 e 30 as respetivas curvas de fragilidade e os valores de probabilidade de excedência dos estados de dano.
xxx
Figura 29: Curvas de fragilidade da Estrutura BRB.
Figura 30: Valores de probabilidade de excedência dos estados de dano para um nível de PGA de 0,3g, da Estrutura BRB.
verificavam os valores máximos admissíveis de probabilidade de atingir os estados limites últimos, p′
f u, de acordo com a regulamentação inglesa [19] e Henriques [20]. Na Tabela 9 são apresentados os valores máximos admissíveis calculados para a estrutura em estudo.
Tabela 9: Máxima probabilidade de excedência admissíveis,p′
f u, forKs= 0,05 Nível de Período de vida da estrutura,Tr
segurança,np 50 anos
Reduzido (0.1) 2.5×10⁻³
Normal (1.0) 2.5×10⁻⁴
xxxi
Considerando que:
Pf u;Simple= 2.57×10⁻¹
Pf u;BRB = 1.72×10⁻¹
Realizou-se a seguinte verificação:
• Sep′
f u≥Pf u;Simple;BRB Verifica • Sep′
f u≤Pf u;Simple;BRB Não Verifica
Nas Tabelas 10 e 11 são apresentadas as verificações para a Estrutura Simples e BRB, respetivamente.
Tabela 10: Verificação Estrutura Simples
Nível de Período de vida da estrutura,Tr
segurança,np 50 anos
Reduzido (0.1) 2.5×10⁻³
Normal (1.0) 2.5×10⁻⁴
Elevado (10) 2.5×10⁻⁵
Tabela 11: Verificação Estrutura BRB
Nível de Período de vida da estrutura,Tr
segurança,np 50 anos
Reduzido (0.1) 2.5×10⁻³
Normal (1.0) 2.5×10⁻⁴
Elevado (10) 2.5×10⁻⁵
Conclusão
A avaliação da eficiência do uso de contraventamentos de encurvadura impedida (BRB) como reforço sísmico de um edifício porticado de betão armado foi realizada com sucesso. Após a calibração do modelo numérico no programa de elementos finitos SeismoStruct, baseado nos resultados experimentais de Di Sarno e
Manfredi [10], uma abordagem probabilística permitiu contemplar incertezas ao nível da ação sísmica, das propriedades dos materiais e do comportamento estrutural, e, juntamente com as curvas IDA, definir os respetivos estados de dano e por fim gerar as curvas de fragilidade.
xxxii
de colapsar, evidenciando assim a necessidade deste tipo de estruturas sofrerem uma intervenção de reforço sísmico.
Após a instalação dos BRBs, a estrutura continuou a exibir 100% de probabilidade de sofrer danos para um PGA de 0,3g. Apesar de se verificar uma redução dos valores de excedência nos estados de dano mais gravosos e um aumento nos mais leves, a estrutura não se encontra em cumprimento do exigido pelos códigos em termos dos estados limites últimos.
Contents
Copyright i
Acknowledgements iii
Abstract v
Resumo vii
Resumo alargado ix
Contents xxxiii
List of Figures xxxv
List of Tables xxxix
List of Abbreviations, Acronyms and Symbols xli
1 Introduction 1
1.1 Background . . . 1 1.2 Objectives and Scope . . . 3 1.3 Dissertation Outline . . . 4
2 Buckling Restrained Braces 5
2.1 BRB. The early years . . . 5 2.2 BRB Configurations . . . 9 2.3 Key Issues and Detailing . . . 12 2.3.1 Debonding Materials . . . 12 2.3.2 Connections and Contraction Allowance . . . 14 2.3.3 General Stability . . . 17 2.4 Design Overview . . . 19 2.4.1 Codes and Provisions . . . 19 2.4.2 Design Procedures . . . 20 2.5 Hysteretic Behavior . . . 21 2.6 Application Cases . . . 32
xxxiv CONTENTS
3 Case Study 35
3.1 Experimental Models . . . 35 3.1.1 General Description . . . 35 3.1.2 Material properties and Details . . . 35 3.2 Experimental Test Campaign . . . 40 3.2.1 Experimental Set-up and Loading Protocol . . . 40 3.3 Experimental Test Results . . . 42 3.3.1 Modal Response . . . 42 3.3.2 Monotonic Lateral Response . . . 42 3.4 Numerical Model Development and Calibration . . . 44 3.4.1 Simple Frame . . . 44 3.4.2 BRB Frame . . . 49
4 Seismic Vulnerability Assessment 61
4.1 Seismic Action . . . 61 4.2 Key Parameters Probabilistic Variability . . . 64 4.2.1 Introduction . . . 64 4.2.2 Material Properties . . . 65 4.2.3 Uncertainties in Material Modelling . . . 65 4.2.4 Case Study Implementation . . . 66 4.3 Incremental Dynamic Analysis . . . 69 4.3.1 Basic Principles and Scope . . . 69 4.3.2 Concepts and Fundamentals . . . 69 4.3.3 IDA Procedure and Application . . . 71 4.4 Damage States . . . 71 4.4.1 Procedure and Application to the Case Study . . . 72 4.5 Fragility Curves . . . 74 4.5.1 Introduction and Background . . . 74 4.5.2 Fragility Curves Development . . . 74 4.5.3 Typology . . . 75 4.5.4 Intensity Measures . . . 76 4.5.5 Uncertainties Consideration . . . 76 4.5.6 Fragility Curves Deriving Methods . . . 77 4.6 Results and Comparison . . . 82
5 Conclusions and Future Work 91
5.1 Conclusions . . . 91 5.2 Future Work . . . 92
List of Figures
1 Composição típica de um BRB . . . x 2 Comportamento típico dos contraventamentos convencionais. . . . x 3 Configurações da secção transversal dos BRBs. . . xi 4 Comparação do comportamento de contraventamentos
convencionais e dos BRBs. . . xi 5 Plantas e cortes transversais das estruturas de teste . . . xiii 6 Representação das secções transversais das vigas e pilares das
estruturas de teste. . . xiv 7 Posicionamento dos acelerómetros durante a campanha experimental xv 8 Curva de capacidade da estrutura simples . . . xvi 9 Curva de capacidade da estrutura reforçada . . . xvi 10 Solução adotada para a modelação das lajes . . . xviii 11 Comparação entre as curvas de capacidade da estrutura real e do
modelo numérico . . . xix 12 Comparação das curvas de capacidade numéricas em ambas as
direções ortogonais . . . xix 13 Curvas força-deslocamento do ensaio de tração do modelo
numérico do BRB isolado. . . xx 14 Curvas força-deslocamento do ensaio de compressão do modelo
numérico do BRB isolado. . . xx 15 Curvas força-deslocamento do ensaio de tração do modelo
numérico do conjunto tubo e BRB. . . xxi 16 Curvas força-deslocamento do ensaio de compressão do modelo
numérico do conjunto tubo e BRB. . . xxi 17 Curvas força-deslocamento do ensaio de tração do modelo
equivalente. . . xxii 18 Curvas força-deslocamento do ensaio de compressão do modelo
equivalente. . . xxii 19 Comparação entre as curvas de capacidade da estrutura real e do
modelo numérico. . . xxiii 20 Comparação entre as curvas de capacidade da estrutura real
reforçada, do modelo numérico reforçado com o esquema experimental e o modelo numérico reforçado com o esquema proposto. . . xxiv 21 Comparação entre as curvas de capacidade para os dois tipos de
reforço, nas duas direções ortogonais. . . xxv 22 Acelerograma Faro falha da Ferradura direção Norte-Sul . . . xxv
xxxvi LIST OF FIGURES
23 Distribuição probabilística dos parâmetros chave. . . xxvi 24 Evolução do desvio padrão ao longo do espaço amostral. . . xxvii 25 Evolução do erro relativo do desvio padrão ao longo do espaço
amostral. . . xxvii 26 Curva IDA, juntamente com a sua representação bilinear e
respetivos estados de dano. . . xxviii 27 Comparação entre as curvas de fragilidade ao nível do topo e ao
nível dos pilares da Estrutura Simples. . . xxix 28 Comparação entre os valores de probabilidade de excedência dos
estados de dano ao nível do topo e ao nível dos pilares da Estrutura Simples, para um nível de PGA de 0,3g. . . xxix 29 Curvas de fragilidade da Estrutura BRB. . . xxx 30 Valores de probabilidade de excedência dos estados de dano para
um nível de PGA de 0,3g, da Estrutura BRB. . . xxx
1.1 Typical retrofitting using concentric steel braces . . . 2 1.2 Typical composition of a buckling restrained brace . . . 3
2.1 Typical behaviour of concentric brace frames . . . 5 2.2 Conventional brace vs. BRB hysteretic behaviour . . . 6 2.3 Wakabayashi et al.’s 1973 experiment of a concrete panel encased
steel brace . . . 7 2.4 Wakabayashi et al.’s 1973 experiment of a X configured BRB frame . 8 2.5 Typical unbonded brace configuration . . . 9 2.6 Two categories of BRBs: a) Steel brace encased by RC or steel
element and b) Steel braced encased by concrete panels . . . 10 2.7 BRB cross sections configurations . . . 10 2.8 iBRB assembly . . . 11 2.9 Axial load difference under cyclic loading . . . 13 2.10 Typical single core BRB connection detail. . . 15 2.11 Schematic representation of double-cored buckling restrained brace
(DCBRB). . . 15 2.12 Beam-column-brace connection detail . . . 16 2.13 Proposed gusset connection detail . . . 17 2.14 Schematic configuration and forces of an unbonded brace under
LIST OF FIGURES xxxvii
2.26 (left) UC Berkeley BRBF-3 beam flange fracture (rigth) UC Berkeley
BRBF-3 brace rotation at peak displacement. . . 31 2.27 UC Berkeley BRBF-3 lateral beam displacement versus base shear. 31 2.28 UC Berkeley BRBF-3 BRB estimated hysteresis. . . 31 2.29 "‘Nittele tower"’ Shiodome, Japan. Head office building of Nippon
Television Network Corporation. . . 32 2.30 COREBRACE, LLC patent, the first in the USA. . . 33 2.31 STAR SEISMIC, LLC patent, the second in the USA. . . 33 2.32 Wallace F. Bennet Federal Building, USA:(left)Before BRB seismic
retrofitting,(right)after BRB seismic retrofitting. . . 33
2.33 FIP INDUSTRIALE S.r.l. patent, the Buckling Restrained Axial Damper (BRAD). . . 34 2.34 Building of the Faculty of Engineering of Ancona, Italy, retrofitted with
BRADs. . . 34
3.1 Floor plans and cross sections of the RC test frames. . . 36 3.2 Beam and column cross-sections layout and steel reinforcement of
the RC frames. . . 38 3.3 Schematic sub-assemblage of the diagonal braces: Conventional
steel tube brace and BRB. . . 40 3.4 Accelerometers positioning for the experimental tests. . . 41 3.5 Schematic drawing of test set-up. . . 42 3.6 Unretrofitted frame capacity curve . . . 43 3.7 Retrofitted frame capacity curve . . . 44 3.8 Adopted slab modelling solution. . . 47 3.9 Comparison between the experimental and numerical pushover
curves. . . 49 3.10 Comparison between the two orthogonal directions, X and Y,
numerical pushover curves. . . 49 3.11 Numerical model of the single BRB . . . 50 3.12 Force-displacement curve of the single BRB numerical pull-test . . . 52 3.13 Force-displacement curve of the single BRB numerical compression
test . . . 52 3.14 Numerical model of the BRB and steel pipe set-up . . . 52 3.15 Force-displacement curve of the BRB and steel pipe set-up
numerical pull-test . . . 53 3.16 Force-displacement curve of the BRB and steel pipe set-up
numerical compression test . . . 53 3.17 Numerical model of the equivalent single element model . . . 54 3.18 Force-displacement curve of the equivalent single element
numerical pull-test . . . 54 3.19 Force-displacement curve of the equivalent single element
numerical compression test . . . 55 3.20 Experimental retrofitting scheme BRB distribution. . . 56 3.21 Comparison between the capacity curves of the real structure and
xxxviii LIST OF FIGURES
3.23 Comparison between the capacity curves of the real structure, the experimental numerical model and the proposed retrofitting scheme 58 3.24 Comparison between the capacity curves of the proposed retrofitting
scheme in both directions, X and Y. . . 59
4.1 Major seismic zones in the SW of the Portuguese coast: GBF Gorringe Bank Fault, PAF Príncipes de Avis Fault, MPF -Marquês de Pombal Faut, HF - Horseshoe Fault, NGBF - Northern Guadalquivir Bank Fault, SGBF - Southern Guadalquivir Bank Fault, PSNF - Pereira de Sousa Normal Fault, LTVF - Lower Tagus Valley Fault. . . 62 4.2 Finite-fault geometry . . . 63 4.3 Schematic representation of the finite fault model . . . 63 4.4 Faro HF M7.8 accelerogram . . . 64 4.5 Faro MPF M7.2 accelerogram . . . 64 4.6 Parameters probabilistic distributions . . . 67 4.7 Standard deviation’s evolution throughout the sample space . . . 68 4.8 Relative error of the standard deviation’s evolution throughout the
sample space . . . 68 4.9 Bilinear representation of the IDA curve and associated damage states 72 4.10 Damage state’s threshold values obtained from the bilinearization of
the IDA curves . . . 73 4.11 Examples of vulnerability and fragility functions . . . 75 4.12 Simple frame fragility curves in both directions, X and Y . . . 82 4.13 Simple frame global fragility curves . . . 83 4.14 Simple frame’s exceedance probability values of each damage state
for a PGA level of 0.3g . . . 83 4.15 BRB frame fragility curves in both directions, X and Y . . . 84 4.16 BRB frame global fragility curves . . . 84 4.17 BRB frame’s exceedance probability values of each damage state
for a PGA level of 0.3g . . . 85 4.18 Comparison between the Top and Column fragility curves of the
Simple Frame . . . 86 4.19 Comparison between the Top and Column probability values for
each damage state . . . 86 4.20 New BRB Frame fragility curves in both directions, X and Y . . . 87 4.21 New BRB Frame global fragility curves . . . 88 4.22 New BRB Frame’s exceedance probability values of each damage
List of Tables
1 Propriedades mecânicas das armaduras . . . xiv 2 Parâmetros mecânicos dos BRBs do primeiro e segundo piso . . . . xv 3 Frequências de vibração, em hertz, estimadas experimentalmente
para a estrutura simples e reforçada . . . xvi 4 Frequências de vibração: Estrutura Real vs. Modelo Numérico . . . xviii 5 Frequências de vibração: Estrutura real reforçada vs. Modelo
numérico reforçado . . . xxiii 6 Frequências de vibração: Esquema de reforço experimental vs.
Esquema de reforço proposto. . . xxiv 7 Caraterização probabilística dos parâmetros chave. . . xxvi 8 Definição dos estados de dano. . . xxviii 9 Máxima probabilidade de excedência admissíveis,p′
f u, forKs = 0,05 xxx 10 Verificação Estrutura Simples . . . xxxi 11 Verificação Estrutura BRB . . . xxxi
2.1 Summarized Test Specimens Characteristics . . . 13 2.2 Material mechanic properties . . . 22 2.3 Properties and Results of CoreBrace Subassemblage Tests . . . 25 2.4 Properties and Results of Associated Bracing Uniaxial Tests . . . 25 2.5 Loading protocol definitions . . . 28 2.6 Deformation values for testing . . . 28
3.1 Mechanical properties of the reinforcement bars . . . 37 3.2 Frequencies of vibration, in hertz, estimated with experimental
methods for both the unretfofitted and retrofitted RC structures . . . 42 3.3 Concrete characteristics implemented in the numerical model . . . . 45 3.4 Steel reinforcement characteristics implemented in the numerical
model . . . 46 3.5 Slab’s elastic frame elements characteristics . . . 47 3.6 Slab’s concentrated mass values . . . 47 3.7 Frequencies of vibration: Real Structure vs. Numerical Model . . . . 48 3.8 BRB’s mechanical parameters for both the first and second floor. . . 50 3.9 Steel mechanical properties implemented on the ground floor single
BRB model. . . 51 3.10 Steel mechanical properties implemented in the first floor single
BRB model. . . 51
xl LIST OF TABLES
3.11 Steel mechanical properties implemented on the ground floor steel equivalent model model. . . 54 3.12 Steel mechanical properties implemented in the first floor steel
equivalent model model. . . 55 3.13 Frequencies of vibration: Real Retrofitted Structure vs. Retrofitted
Numerical Model . . . 56 3.14 Frequencies of vibration: Experimental Retrofitting Scheme vs.
Proposed Retrofitting Scheme . . . 58
4.1 Probabilistic characterization of the key parameters . . . 66 4.2 Damage states definition . . . 72 4.3 Threshold values of the damage states according to the Risk-UE
approach . . . 81 4.4 Example of the damage state definition of the BRB Frame . . . 87 4.5 Damage state’s benchmark values from the Simple Frame IDA
curve’s bi-linearization . . . 87 4.6 BRB Frame IDA curve points . . . 87 4.7 Maximum admissible probability values,p′
List of Abbreviations, Acronyms
and Symbols
Abbreviations
DT-BRB Double-Tee Double Tube BRB EC2 Eurocode 2
EC8 Eurocode 8 iBRB Inspectable BRB
PMC Probabilistic Model Code
Acronyms
AISC American Institute of Steel Construction BRAD Buckling Restrained Axial Damper BRB Buckling Restrained Braces
BRBF Buckling Restrained Braced Frame CEN European Committee for Standardization DCBRB Double-core buckling restrained braces
DM Damage Measure
DS Damage State
FE Finite Element
FEM Finite Element Method
FEMA Federal Emergency Management Agency GBF Gorringe Bank Fault
HAZUS Hazards United States HF Ferradura Fault
IDA Incremental Dynamic Analysis IM Intensity Measure
JCSS Joint Committee on Structural Safety JSCA Japan Structural Consultants Association JSSI Japan Society of Seismic Isolation LTVF Lower Tagus Valley Fault
MPF Marquês de Pombal Fault
NEHRP National Earthquake Hazards Reduction Program NGBF Northern Guadalquivir Bank Fault
PAF Príncipes de Avis Fault
xlii LIST OF ABBREVIATIONS, ACRONYMS AND SYMBOLS
PGA Peak Ground Acceleration PGD Peak Ground Displacement PGV Peak Ground Velocity
PSNF Pereira de Sousa Normal Fault RC Reinforced Concrete
SD Standard Deviation SDOF Single degree of freedom
SEAOC Structural Engineers Association of California SF Scale Factor
SGBF Southern Guadalquivir Bank Fault
SW South West
UC University of California VM Vinyl Mastic
WT Wire transducers
Symbols
α2 Fraction of building height at location of pushover mode displacement
β Imperfect unbonding factor
βc Compression strength adjustment factor
βC Random variable related to the response and resistance capacity of the element uncertainties
βD Random variable related to the earthquake input motion uncertainties
βDS Random variable related to the damage state definition uncertainties
βM(DS) Uncertainty on the definition of the damage state threshold
βtot Total standard deviation Γ Axial load difference
δ Fault dip
δy BRB’s yield axial deformation
∆b Deformation quantity used to control the loading of the test specimen ∆bm Design story drift of the bay in which the BRB will be located
∆by Deformation at the first significant yielding in the brace ∆DS Inter-story drift ratios threshold values of a damage state ∆L Subfault length
∆u Ultimum drift ∆W Subfault width ∆y Yielding drift
ε Axial strain
εDS Lognormally distributed variable with standard deviationβDS
ζ Damping
η Cumulative inelastic axial deformation
λ Load factor
λyield Lowest scaling factor needed to cause yielding for a given record and structural model
ν Poison Ratio
LIST OF ABBREVIATIONS, ACRONYMS AND SYMBOLS xliii
Φ Reinforcement bars diameter
Φ Standard cumulative probability function
ω Tension strength adjustement factor
Ω Steel core’s material over-strength factor Ωh Steel core’s material strain hardening factor
A Brace’s deformed cross section area
A0 Brace’s original cross section area
Asc Cross sectional area of the BRB core plate c Center of subfault
Cmax Maximum compressive brace forces
d2 Collapse prevention limit state
dbL Minimum diameter of longitudinal rebars
dbW Stirrup’s diameter
Dby Brace’s yield axial elongation
Du Ultimum spectral displacement
Dy Yielding spectral displacement
E0 Encasing member’s Young Modulus
Ecm Concrete’s Young Modulus
Eh Total hysteretic energy
Ei Steel core’s Young Modulus
EA Axial stiffness EI Flexural stiffness EItrans Flexural stiffness
fcm Concrete’s mean compressive cylinder strength
Fysc Nominal yield strength of the core material
fy Nominal yield strength
Fy,1 Ground floor BRB’s yield force
Fmax,1 Ground floor BRB’s maximum force
Fy,2 Upper floor BRB’s yield force
Fmax,2 Upper floor BRB’s maximum force
GJ Torsional stiffness
h Depth to fault upper edge h Typical roof height
HW Beam’s height
I0 Encasing member’s moment of inertia
Ii Steel core’s mnoment of inertia
IMmi Median threshold value of the earthquake IM required to cause the ith DS
kel,1 Ground floor BRB’s elastic axial stiffness
kel,2 Upper floor BRB’s elastic axial stiffness
Ks Coefficient responsible of translating society’s aversion to accept structural rupture occurrence
KL Brace’s effective/equivalent length L Brace’s deformed length
xliv LIST OF ABBREVIATIONS, ACRONYMS AND SYMBOLS
np Average number of people victimized in case of structure rupture/ security threshold
Ne Encasing member’s Euler buckling load
Ny Steel core’s yielding force
O Origin
Os Surface projection of origin P Applied incremental load
P Axial load
P Observation point
Pcr Brace’s critical buckling load
Pf() Probability of being present or exceeding a particular damage state
Pf u;Simple Probability value of reaching the ultimate limit states for the Simple Frame
Pf u;BRB Probability value of reaching the ultimate limit states for the BRB Frame
Pf u;CBF Probability value of reaching the ultimate limit states for the CBF Frame
Py Nominal yield strength of the core section
P+
y Brace’s effective compressive yield capacity
P−
y Brace’s effective tensile yield capacity
P∗
y Brace’s average of the effective compressive and tensile yield capacities
Po Nominal loads pattern
p′
f u Maximum admissible probability value of reaching the ultimate limit states q(x) Unknown distributed load
r Distance from hypocenter to subfault center R Distance from subfault to observation point s Stirrup’s spacing
Sa Spectral acceleration
Sd Spectral displacement
Sd,DS Median value ofSdof damage state,DS
Te True elastic fundamental-mode period of the building
Tmax Maximum tensile brace forces
Tr Lifetime period of structures to consider in the design V Rupture velocity
Chapter 1
Introduction
1.1
Background
During their life time, structures are susceptible to various solicitations that endanger their stability and, therefore, their function and safety. Firstly, vertical loads and displacements were the major concern for engineers when designing building structures. Afterwards, the concern with the lateral loading and displacements caused by wind and seismic actions was developed.
Seismic events are known to cause major problems to societies, specially in regions with high seismicity. They are one of the most dangerous natural phenomena, not only because of the structural damage in the building stock and human causalities, but also because of its unpredictability. Therefore, it becomes necessary to design buildings capable to resist ground motion solicitations.
One important seismic event, in Portugal, was Lisbon’s 1755 earthquake. On November 1st1755 an earthquake of approximately 8.5 on the moment magnitude
scale struck Lisbon, causing major fires throughout the city and a Tsunami. The 1755 earthquake was one milestone in the Portuguese seismology development, since in the city’s reconstruction special structural systems were employed to grant some resistance to seismic actions. Two structural systems were used to replenish the building stock, which already contemplated the contemporary concept of ultimate limit state and service limit state:
• Wood framed structures, which resisted the gravitational loads but also provided the necessary flexibility to not be significantly damaged when subjected to seismic action;
• Masonry walls which assured comfort and privacy in normal situations, but in case of intense ground motions their collapse was acceptable.
It was one of the first times that seismic mitigation systems were applied in buildings and these solutions remained to be used in the following decades. Afterwards, with the RC boom these solutions were abandoned and, the wood and masonry gave place to cement, steel and aggregates.
2 CHAPTER 1. INTRODUCTION
Since then, seismic engineering came a long way and many design guidelines and retrofitting techniques were developed and proposed for mitigation of the seismic induced damage. Solutions vary according to the solicitation intensity, building type and function.
Currently, in Europe, the Eurocode 8 (EC8) is the seismic code applied. It contains all the guidelines and recommendations for a proper structural design of seismic resistant structures. In EC8, structures are assigned a importance class and coefficient, according to their functional needs before a seismic event, as well as the consequences of its collapse in social, economical and human loss terms. This way, and according to this importance class, the importance coefficient is applied to the seismic action. Being superior to one, increasing the seismic action, for structures with a higher importance class and one, or lower, for lower importance classes. This way, structures with a higher class can withstand more severe earthquakes reducing the damages due to seismic action.
However, not all the current building stock was build recently, and respects the EC8 guidelines. Many old RC buildings lack adequate lateral resisting systems. These structures do not include closed-spaced stirrups in beams, columns and structural joints, thus endangering the shear capacity of these elements. Smooth bars, insufficient percentage of longitudinal steel reinforcement, low strength concrete, inadequate lap splices and anchorage, low concrete confinement, are typically found in many existing deficient buildings.
One currently used retrofitting technique is the use of bracing systems to add lateral stiffness to structures. Many configurations of these systems exist and are used in many types of buildings. The most common one consists on steel profiles added to RC frames, with various patterns, to allow them to have some lateral resistance, Figure 1.1. This system performs well to a certain degree, since the buckling behaviour of steel slender profiles reduces their load carrying capacity.
Figure 1.1: Typical retrofitting using concentric steel braces [21]
1.2. OBJECTIVES AND SCOPE 3
buckling occurrence and therefore allow the brace to continue to absorb the horizontal loads. In Figure 1.2 is presented an illustration of the typical so called buckling restrained brace (BRB) along with its basic components.
Figure 1.2: Typical composition of a buckling restrained brace [1]
As mentioned before, seismic events cause major losses both in terms of human lives and building stock, translating into major social/economic losses. Therefore, the study and research of not only seismic design, but also seismic retrofitting is of major importance in Civil Engineering. Currently, due to the advances in technology, computers are capable of accurately simulate seismic scenarios and predict the structural behaviour of buildings, allowing engineers to study many retrofitting configurations, materials and design strategies. In the present dissertation those advances were used and through numerical simulation, vulnerability assessment and a fragility analysis we seek to study the efficiency of BRBs.
1.2
Objectives and Scope
Taking into account what was previously mentioned, this dissertation aims to assess the efficiency of Buckling Restrained Braces in reinforced concrete (RC) structures through vulnerability assessment and fragility analysis. The objectives of the present document are:
• Literature research and review on Buckling Restrained Braces, their properties, behaviour and application.
• Development of a numerical model capable of reliably simulate the behaviour of a real RC framed structure.
• Literature research on Seismic vulnerability assessment and fragility analysis.
4 CHAPTER 1. INTRODUCTION
1.3
Dissertation Outline
In this section, an overview of the dissertation structure is provided. The text is organized in the following five chapters:
• Chapter 1 Introductory overview on the subject of the dissertation, its objectives and structure;
• Chapter 2 Review on Buckling Restrained Braces, addressing six main subjects: a brief history, configurations, key issues and detailing, design overview, histeretic behaviour and application cases.
• Chapter 3Description of the experimental campaign developed by Di Sarno and Manfredi [10]. Development and calibration of numerical models to accurately simulate the test specimens.
• Chapter 4 Description of the considered seismic action. Seismic vulnerability study and description of the required procedures, such as the Incremental Dynamic Analysis and Fragility Curves. Results presentation and comparison.
Chapter 2
Buckling Restrained Braces
The present chapter presents a review of buckling restrained braces. A brief introduction of these devices is provided, along with the various configurations developed and studied along the years. Afterwords, key topics of BRB’s functionality and design are addressed, such as debonding between components, global stability and connections. Design codes and provisions are also briefly reviewed. Finally, the global hysteric behaviour of BRBs is assessed and examples of practical applications worldwide are provided.
2.1
BRB. The early years
Throughout the years, concentric steel braces have been used to counteract both wind and seismic actions in structures. However, the high slenderness of such braces results in global buckling under compression due to seismic excitation, causing strength and stiffness degradation. To prevent this behaviour, concentric steel braces have been applied using two opposed braces, so that when one is in tension the other is in compression. Nonetheless, the braces still exhibit pinched hysteretic cycles [2], as ilustrated in Figure 2.1.
Figure 2.1: Typical behaviour of concentric brace frames (adapted from [2])
In order to avoid this behaviour, alternative systems have been developed and suggested. One alternative device is the buckling restrained brace (BRB). As the name implies, it consists of a steel brace with its buckling inhibited by an appropriate system. By restraining buckling, the braces exhibit the same strength in compression as they do in tension, displaying a better hysteretic behaviour
6 CHAPTER 2. BUCKLING RESTRAINED BRACES
and increased energy absorption capability [1]. A comparison between the typical behaviour of both concentrically braced and BRB frames is illustrated in Figure 2.2.
Figure 2.2: Conventional brace vs. BRB hysteretic behaviour [4]
Many configurations of BRBs have been proposed, but they generally follow the same principle and components: a yielding core, responsible for withstanding the axial forces; a restraining/casing member, capable of preventing the core buckling; a separation system between the former two components, to ensure the yielding core can slide freely inside the restraining member and that transverse expansion can occur in case of yielding in compression; and a strengthened transition segment, which is responsible for the link between the brace and the connections to the structure, and also ensures the yielding occurs along the length of the steel core and never in the transition segments.
According to Xie Q. [1] the first scientific appearance of a bracing system with its buckling behaviour inhibited was in 1971, in a study carried out by Yoshino et al. [22]. Two specimens consisting of a flat steel plate encased by RC panels with some debonding materials between them where cyclically tested. One with a 15mm gap between the plate and restraining panel whilst the other was not provided with any spacing. The former specimen displayed larger deformations and energy dissipation capacity than the later.
2.1. BRB. THE EARLY YEARS 7
(a) Test set-up
(b) Result hysteresis
Figure 2.3: Wakabayashi et al.’s 1973 experiment of a concrete panel encased steel brace [23, 24]
The authors show that the load carrying capacity of the unbonded brace was higher than that of the bonded brace. In terms of lateral drift, test results showed that the maximum lateral drift of the unbonded brace was almost four times that of the bonded brace. Finally two 1/2 scale, two story and two spans, steel frames equipped with such devices were tested cyclically, one with the braces arranged diagonally and the other arranged in a chevron pattern. As shown in Figure 2.4 the hysteretic behaviour prior to local buckling was stable, showing good absorption capacity with spindle shape loops. From the conducted study the authors concluded that the debonding layer on the brace’s surface was crucial to allow the steel brace to resist the horizontal loading while the concrete panels only prevent the brace from buckling.
8 CHAPTER 2. BUCKLING RESTRAINED BRACES
(a) Test set-up
(b) Result hysteresis
Figure 2.4: Wakabayashi et al.’s 1973 experiment of a X configured BRB frame [23, 24]
system consisted of a conventional brace encased in a square steel pipe filled with mortar. No gap or debonding material was applied between the core brace and the mortar. However, the system showed some buckling restrainment of the core brace during the first loading cycles. Tests demonstrated that the brace showed higher resistance in compression than in tension and longitudinal strains on the encasing tube were proximately 85-90% less than the measured in the steel core plates. In their following research [26], four full-scale specimens were tested under cyclic loads, with two of them having a gap between the core brace and the enclosing mortar. The results showed that if the ratio between the outer tube’s Euler load and the yielding strength of the core brace were larger than 1.9 no buckling would take place and a good hysteretic behaviour would be observed.
2.2. BRB CONFIGURATIONS 9
et al. [29] carried further research on this concept leading to the refinement of the now called unbonded brace [30], Figure 2.5. The unbonded brace is the most common type of BRB and typically consists in a low yielding steel core encased in a concrete infilled tube. Both the steel core brace and encasing member can have multiple cross sections, and throughout the years many different configurations varying these two elements have been proposed and tested.
Figure 2.5: Typical unbonded brace configuration [31]
2.2
BRB Configurations
Although buckling restrained systems can have multiple configurations, according to Xie [1] they can be summarized in two large categories: one consists of a steel brace core encased by either RC, mortar infilled steel tube or steel profiles, the other consist of the same steel brace core encased by concrete panels. Figure 2.6 shows an example of the first and second categories respectively.
Many researchers tested, developed and proposed various cross sections configurations for restrained braces, all following the concept of using infilled steel tubes/steel profiles to restrain transversal displacements while allowing axial deformations to occur on the core. Figure 2.7 shows some of those cross sections.
10 CHAPTER 2. BUCKLING RESTRAINED BRACES
Figure 2.6: Two categories of BRBs: a) Steel brace encased by RC or steel element and b) Steel braced encased by concrete panels [1]
Figure 2.7: BRB cross sections configurations [3]
the effect of the ratio between the encasing member’s Euler buckling load and the steel core’s yielding force, Ne/Ny. Two of the five specimens were designed with
said ratio below 1 and the remaining three specimens were designed with a ratio superior to 1. After being cyclically tested both specimens with the ratio below 1 buckled under compression, revealing the same behaviour as a conventional brace, while the other three specimens remained stable, displaying symmetric behaviour under both tension and compression. For practical approaches, the authors suggested that a Ne/Nyratio should be, at least, 1.5.
Nagao et al. [32, 33, 34, 35, 36] developed, tested and theoretically studied BRBs either with wide flanges H-section steel cores or square steel tubes cores covered by RC members, Figure 2.7, and evaluated the reinforcement, strength and stiffness requirements of the concrete casing.
2.2. BRB CONFIGURATIONS 11
tubes [3]. Many researchers studied all steel BRB configurations using a steel tube as a restraining unit. Through the careful selection of the material strengths and the lengths of the portions expected to yield and the ones to remain elastic a wide range of braces can be designed [30].
According to D’Aniello [30], Kuwahara and Tada in 1993, Suzuki et al. in 1994, Manabe et al. in 1996 and Shimizu et al. in 1997 were some of the first investigators to study the use of an all steel BRB configuration, recurring to the use of hollow steel tubes as a restraining member. Besides these, more configurations of only steel braces have been suggested, such as the use of two to four steel tubes connected together, either by bolted or welded connections, in direct contact with the axial forces bearing steel core. The use of bolted connections offers the possibility of relatively easy inspection, maintenance and replacement of the devices after a seismic event or even during its life time [3]. As it happens in the “unbonded brace” an appropriate gaping space between the core brace and the restraining unit should be kept in ”all steel” BRBs, to allow the relative deformation between both elements.
With the aim to reduce the connections dimensions Tsai and his co-workers [3, 42, 43, 44], studied extensively a new configuration of all steel BRB. The brace was composed of a double tee core, each encased in a steel tube (DT-BRBs: Double-Tee Double Tube BRBs).
More recently An-Chien et al. [45] proposed a new configuration of all steel BRB, the so called inspectable BRB (iBRB) which consisted of a steel core member and a pair of identical restraining members connected by bolted connections, Figure 2.8. Six specimens with different core plate cross-sections were tested with 6 different loading protocols.
Figure 2.8: iBRB assembly [45]
![Figura 6: Representação das secções transversais das vigas e pilares das estruturas de teste [10].](https://thumb-eu.123doks.com/thumbv2/123dok_br/16602205.739351/16.892.121.686.148.569/figura-representação-secções-transversais-vigas-pilares-estruturas-teste.webp)