Engineering
ISSN: 1809-4430 (on-line)
_________________________
2 Universidade Estadual Paulista (UNESP), Faculdade de Ciências Agrárias e Veterinárias/ Jaboticabal - SP, Brasil. 3 Universidade Federal de Viçosa/ Viçosa - MG, Brasil.
STATISTICAL CONTROL OF PROCESSES APLIED FOR PEANUT MECHANICAL DIGGING IN SOIL TEXTURAL CLASSES
Doi:http://dx.doi.org/10.1590/1809-4430-Eng.Agric.v37n2p315-322/2017
CRISTIANO ZERBATO1*, CARLOS E. A. FURLANI2, ROUVERSON P. DA SILVA2,
MURILO A. VOLTARELLI3, ADÃO F. DOS SANTOS2
1*Corresponding author. Universidade Estadual Paulista (UNESP), Faculdade de Ciências Agrárias e Veterinárias/
Jaboticabal - SP, Brasil. E-mail: cristianozerbato@hotmail.com
ABSTRACT:Thedigging of peanut, which has the pod production in the subsurface, is directly affected by soil conditions, physical or environmental characteristics, at the time of operation and may be the cause of unwanted losses. Therefore, the quality of the operation is very important for minimizing these losses. Thus, this study aimed to evaluate the quality of mechanizeddiggingoperation of peanut according to three soil textural classes(Sandy, Medium and Loamy) and their water content conditions at operation through statistical process control. The experiment was conducted at three locations in the state of São Paulo, Brazil, under sampling scheme arranged in tracks and 40 sampling points for each textural class of soil, using the mechanical digging variables as indicators of quality. We found that the mechanized digging operation in Sandy soil was the most critical, just meeting the specifications of quality indicators, reflecting higher losses and lower quality of the operation. Medium soil showed at the digginggood and homogeneous conditions in relation to water content in soil and pods, and because it has favorable characteristics it obtained the lower total losses and higher quality of operation. Loamy soil showed satisfactory quality, meeting the specifications as well, but with poorer quality than the Medium Soil.
KEY WORDS: Arachis hypogaea L., losses, quality, soil water content, water content of the pods.
INTRODUCTION
The harvest is one of the most important stages of the agricultural production process and, as in other crops, in the peanut crops it must be finished in the shortest possible time, because the occurrence of adverse climatic factors facilitates the increase of losses. In addition, there are other factors related to the regulation and operation of the machines that can also cause losses during the harvest.
Among the conditions that influence the peanut digging, BRAGACHINI & PEIRETTI (2009) highlight the soil type and conditions, since peanuts produce pods below the soil surface. In this sense, the resistance of the gynophore to the rupture is an important factor to designate the losses in the peanut digging, being dependent on the structure and soil water content (INCE & GUZEL, 2003).Thus, textural differences of the soil related to the water content of the soil at the time of digging are primordial for the accomplishment of the operation, which needs to be carried out with the highest possible quality, aiming at the reduction of losses.
ORMOND et al (2016) in the harvest and sowing of soybean, SILVA et al. (2013) in the harvest of bean CASSIA et al. (2013), TAVARES et al. (2015) in the harvest of coffee and SANTOS et al. (2016) in peanut digging with autopilot.
In the view of the above and with the pretension of identifying critical points that cause variability due to the process, the aim was to evaluate the quality of thepeanut mechanized digging in function of three soil textural classes and their water content conditions at the time of the digging.
MATERIAL AND METHODS
The study was carried out in three locations in the state of São Paulo - Brazil, in soils classified according to OLIVEIRA et al. (1999), the municipalities of Tupã (1) with soil classified as eutrophic red-yellow argissol, sandy texture, smooth wavy relief, moderate A. In Dobrada (2), the soil was classified as eutrophic red-yellow argissol, abrupt, moderate A, medium texture, smooth wavy relief. And in the municipality of Luzitânia (3), this area was classified as dystrophic red latosol, moderate A, loamy texture, flat and smooth wavy relief.
The geographic coordinates of the locations are as follows (Latitude and Longitude):
22º00’05”S and 50º33’02”W, 21º30’38”S and 48º28’09”W, 21º05’25”S and 48º16’00”W, and
altitudes of 475, 580, 560 m for the areas 1, 2 and 3, respectively, all are smooth wavy relief (favorable to the mechanization) and Aw climate according to the Köppen-Geiger classification (PEEL et al., 2007).
The analysis of the textural class (EMBRAPA, 2013) was carried out at the UNESP/Jaboticabal Soil Laboratory, Brazil, from the samples of 0 to 0.20 m of depth.
In the implantation of the crop, the soil of the areas was prepared by the conventional method,
and the “Granoleico” cultivar was used. At the time of digging, the crop showed 73, 68 and 71% of
maturity and yield of 5299, 5089 and 5497 kg ha-1, in the areas 1, 2 and 3, respectively.
The maturation of the pods was determined at six sample points for each soil textural class, using the Hull Scrape method (WILLIAMS & DREXLER, 1981).At the same points, the productivity was measured through the manual digging, in six points of each treatment, of all the
peanut plants contained in the frame area of 2 m2, then the pods that remained up to the depth of
approximately 15 cm on and under the soil were collected, placing them, after the sifting, in paper bags for later weighing. The water content of all samples was corrected to 8% (water content of
peanut storage), and later, these values were extrapolated to kg ha-1.
Due to the homogeneity of the study areas, the experiment was arranged in bands, with the collection of 20 points in one direction of the displacement of the tractor-digging set and another 20 in the opposite direction for greater randomization, and they were spaced in 50 m longitudinally and in parallel to each pace of the tractor-digging set. As basis for comparison, considering the proposed aim, the treatments were denominated, according to the textural class, as Sandy, Medium and Loamy.
For the peanut mechanized digging in Sandy, Medium and Loamy soils, a 2x1 digger was used (two lines forming a plot), pulled by a 4X2 FWD tractor of 110 kW (150 hp) in the engine at
nominal speed and at a speed of 7 Km h-1. In the Loamy soil, the digging was carried out using a
4x2 digger (four lines forming two plots) pulled by a 4x2 FWD tractor, with 139.7 kW (190 hp) in
the engine at nominal speed, traveling at 7.3 km h-1.
The digging depth was set at approximately 0.15 m, where is found the pods production, but oscillations occur due to irregularities of the ground, sharpening and angle of the knives, among others.
For the water content of the pods, 50 pods were removed from the plots at each sampling point, shortly after the passage of the digger, which were weighed before and after being placed in an oven for drying, according to BRASIL (2009).
The visible, invisible and total losses were collected after the digging, placing a frame of 2 m2
(1.11 x 1.80 m). This frame measure was determined to achieve the exact width of the digger, which was positioned over two rows of the crop. In the case of the double digger (4 rows x 2 plots) the frame was positioned twice parallel.
The water content of all samples was corrected to 8% (water content of peanut storage), and
later, these values were extrapolated to kg ha-1.
The operation quality was evaluated based on the analysis of the process variability of peanut mechanized digging, through the statistical control, using control charts by variables, being the previously described variables used as quality indicators.
The control chart model used was "Individual with Moving-Range" (I-MR), which contains two graphs: the first corresponding to the individual values sampled at each point, and the second, obtained by the calculated amplitude between two successive observations. The control limits of these charts are established based on the standard deviation of the variables, with the Upper Control
Limit (UCL) calculated by X + 3σ and the Lower Control Limit (LCL) calculated by X - 3σ.
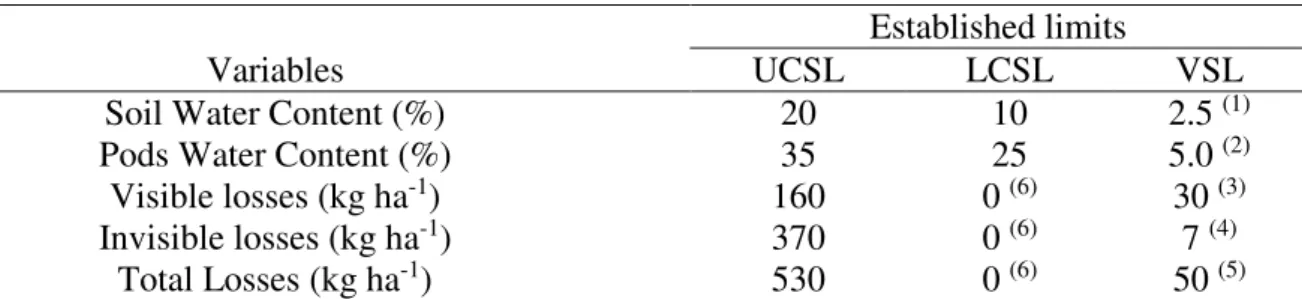
In addition to the statistical control limits, specific limits were calculated (UCSL and LCSL: upper and lower, respectively) stipulated from the acceptable limits of each variable, and a variation specific limit in the mobile amplitude chart (VSL), determined from the largest possible variation to be accepted for the operation to be considered of good quality (Table 1).
TABLE 1. Control limits established for the analyzed variables.
Established limits
Variables UCSL LCSL VSL
Soil Water Content (%) 20 10 2.5 (1)
Pods Water Content (%) 35 25 5.0 (2)
Visible losses (kg ha-1) 160 0 (6) 30 (3)
Invisible losses (kg ha-1) 370 0 (6) 7 (4)
Total Losses (kg ha-1) 530 0 (6) 50 (5)
(1)Calculated due to the environmental conditions and adapted by the recommendation of Santos et al. (2010); (2) Calculated due to
the environmental conditions and adapted by recommendation of Segato and Penariol (2007); (3) Stipulated from the acceptable value of 3% of the average pod yield of the three treatments; (4) Stipulated from the acceptable value of 7% of the average pod yield of the three treatments; (5) Stipulated from the acceptable value of 10% of the average pod yield of the three treatments; (6) not stipulated because null is the desirable of losses.
RESULTS AND DISCUSSION
The soil water content at the time of digging showed to be stable (Figure 1), that is, under statistical control, indicating that the existing variability for this variable can be attributed only to common (random) causes, that is, intrinsic to the process. This fact demonstrates, from the point of view of quality control, that regardless of the soil textural class, an adequate quality standard was maintained, in this case demonstrating homogeneity of soil water content in the area.
The difference between the soils for the water content is in the averages obtained, in the number of points within the specified limits and in the presented variability. The lowest average obtained was showed by the Sandy soil, considered a low water content, and the average was below the specified lower limit. The Loamy soil showed the highest average, but also considered low, since SANTOS et al. (2010) recommend soil water content in the digging from 18 to 20% in loamy soil.
high quality must meet the maximum specifications (MONTGOMERY, 2009). This fact is critical considering the importance of the soil water content in the efficiency of the peanut mechanized digging.
The Loamy soil showed all the points between the acceptable limits and the Medium soil showed 75% between these limits, with the rest below the specific lower limit. The difference of 25%, less than acceptable for the Medium soil, is not enough to lower its quality, because for the soil water content is essential the homogeneity of the area, so there is no occurrence of faults in the pods digging, potentially minimizing the losses. Thus, the Medium soil showed the lowest variability with the least distant statistical control limits in the individual and the mobile range charts, all the points within the specific limit of variation and the lowest standard deviation and coefficient of variation, resulting, therefore, in the most qualified.
A. 120 110 100 90 80 70 60 50 40 30 20 10 1 20 15 10 5 SW C ( % ) _ X UCSL LCL Sandy Medium Loamy
LCSL UCL 120 110 100 90 80 70 60 50 40 30 20 10 1 4 3 2 1 0 Observations M ob ile R an ge __ MR UCL LCL VSL B. 120 110 100 90 80 70 60 50 40 30 20 10 1 40 35 30 25 20 P W C ( % ) _ X UCL LCL
Sandy Medium Loamy
UCSL LCSL 120 110 100 90 80 70 60 50 40 30 20 10 1 10,0 7,5 5,0 2,5 0,0 Observations M ob ile R an ge __ MR UCL LCL VSL
(SWC: Soil Water Content. UCL: Upper Control Limit. LCL: Lower Control Limit. UCSL: Upper Control specific limit. LCSL: Lower Control specific limit. VSL: Variation Specific Limit. X : Average. AM : average of the mobile range.)
FIGURE 1. Control charts for: soil water content (E) pods water content (B).
Also in Figure 1B, the water content of the pods showed all the points located between the control limits, for the individual values and for the mobile range values, and the process is considered stable, with random variations caused by inherent natural factors to the process.
The pods water content behaved similarly to the average values of the soil water content, in which higher values of the soil water content resulted in higher values of the pods water content, and consequently of the gynophores, which are the structures that carry at their end the pods below the soil surface. Therefore, the soil and pod water contents are interlinked and important indicators for the losses behavior. In this sense, INCE & GUZEL (2003) affirm that there is an exponential relation between gynophore breakdown resistance (GBR) and soil water content, so when water content decreases, GBR decreases and consequently the total losses in the harvest increases.
The low soil water contents also resulted in low pod water contents, considering the indicated by SEGATO & PENARIOL (2007), which state that the ideal range for the digging is from 35 to 45% of water in the pods.
The variability for the water content in the Medium and Loamy soil were similar, however the Medium soil showed the majority of the points within the stipulated acceptable control limits, as well as a coefficient of variation and smaller standard deviation, thus it is considered of better quality. Finally, the Sandy soil, of lower quality, with lower acceptablevalues in the control specific limits and in the variation specific limit, also showed greater variability.
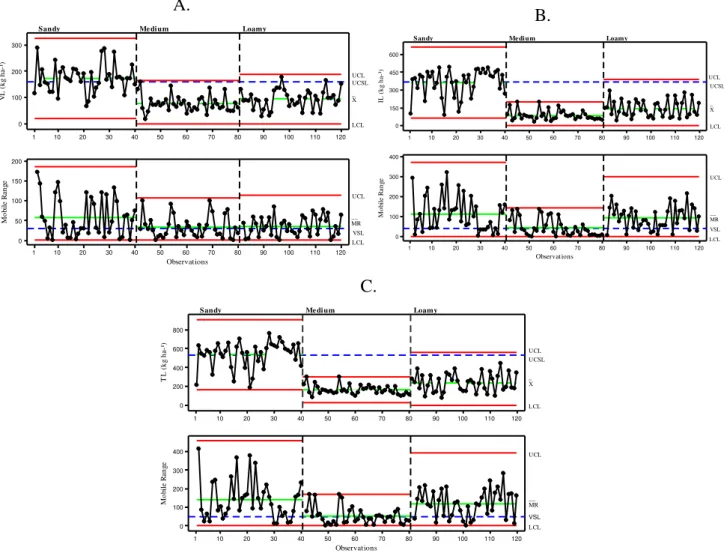
The Medium and Loamy soils showed almost totality of the points in the stipulated acceptable limit of visible losses, being the difference between them demonstrated by the lower average obtained by the Medium soil and lower variability (lower standard deviation and greater number of points within the acceptable limit of variation). The Sandy soil showed the highest average along with the most points above the uppercontrol specific limit, besides a higher standard deviation, causing greater distances between the upper and lower limits of statistical control in the individual values chart and in the mobile range chart, that is, greater variability and therefore lower quality.
The causes for the greater variation of the process for the Sandy soil can be related to the lower soil and pod water contents, well below the one recommended for the accomplishment of the mechanized digging, as already discussed in each one of these variables. The Sandy soil was affected by environmental conditions at the time of the digging, although it is the best recommended for the implantation of the peanut because it is lighter, less cohesive and easier destructuring, facilitating the digging of thepods from the soil subsurface.
Under these conditions, the drier gynophore becomes more fragile which facilitates its detachment from the pods. Thus, when the plant is plucked and raised to the vibrating mat of the digger, the pods detach from the branches and fall on the ground, thus increasing the visible losses. In this sense, the correct regulation of the mat vibration must be precise and monitored during the operation to minimize the visible losses. Therefore, the use of statistical quality control tools is essential for monitoring the process, detecting possible special causes actions, and finally to create a plan for improvements to eliminate the influence of extrinsic actions to the process, in the event, to adjust the operation to the lower soil and pod water content found, which will consequently increase the operation quality, through reduction of the variability resulting from it and potentially reduction of losses.
A behavior similar to the visible losses in relation to the process variability was obtained for invisible losses (Figure 2B).
The Medium and Sandy soil showed all the points within the control specific acceptable limit of invisible losses, being the Medium soil of higher quality, due to the lower losses average, smaller standard deviation and most of the points located within the specific limit of variation, therefore, lower losses and lower variability, a reflection from a well performed and homogeneous operation.
The Sandy soil, similar to the visible losses, obtained an average of invisible losses well above the other soils, most points above the specified limit, very high standard deviation and few points within the acceptable limit of variation that is, of low quality, which showed great variability, meeting few of the specifications.
In this case, considering again the lower resistance of the gynophore with low water content, the pods detach still in the subsurface when they are pulled out, causing greater invisible losses. Another important fact that requires continuous monitoring over time is the sharpening of the cutting knives and the maintenance of them permanently sharp, so that they make the perfect cut of the radicle roots of the peanut plants and dig them correctly, thus minimizing the effect of other factors that facilitate the occurrence of invisible losses.
A. 120 110 100 90 80 70 60 50 40 30 20 10 1 300 200 100 0 V L ( kg h a-¹) _ X UCL LCL
Sandy Medium Loamy
UCSL 120 110 100 90 80 70 60 50 40 30 20 10 1 200 150 100 50 0 Observations M ob ile R an ge __ MR UCL LCL VSL B. 120 110 100 90 80 70 60 50 40 30 20 10 1 600 450 300 150 0 IL ( kg h a-¹) _ X UCL LCL
Sandy Medium Loamy
UCSL 120 110 100 90 80 70 60 50 40 30 20 10 1 400 300 200 100 0 Observations M ob ile R an ge __ MR UCL LCL VSL C. 120 110 100 90 80 70 60 50 40 30 20 10 1 800 600 400 200 0 T L ( kg h a-¹) _ X UCL LCL
Sandy Medium Loamy
UCSL 120 110 100 90 80 70 60 50 40 30 20 10 1 400 300 200 100 0 Observations M ob ile R an ge __ MR UCL LCL VSL
VL: Visible losses. UCL: Upper Control Limit. LCL: Lower Control Limit. UCSL: Upper Control specific limit. VSL: Variation specific limit. X : Average. AM: average of the mobile range.)
FIGURE 2. Control charts for losses: Visible (A), Invisible (B) and Total (C).
The differences between the soils for the total losses can be observed in Figure 2C, which shows the mechanized digging operation in the Sandy soil as the most critical due to the soil and pods conditions found and possible errors of adjustment. The Sandy soil, although it is a class of soil with a more firm and cohesive structure and the operation was carried out with a double digger, showed acceptable quality behavior and quantity of total losses not very far from the Medium soil, which, because it has favorable characteristics (less than 20% of the clay) and shows good and homogeneous conditions in relation to soil and pods water contents that showed the lowest value of total losses and higher quality of the operation.
Considering the pod yields for each soil textural class, we observed a percentage of the total losses in relation to the yields of 10.2%, 3.3% and 4.4% for the Sandy, Medium and Loamy soils, respectively. These values are considered low taking into account studies that indicate losses ranging from 3.1 to 47.1%, in several studies found in the bibliography (SANTOS et al., 2013; ZERBATO et al., 2014; CAVICHIOLI et al., 2014).
CONCLUSIONS
The Sandy soil, although it is the one recommended for the cultivation of peanuts, showed the soil and pod water content out of the ideal and stipulated standards, meeting few of the specifications.
The physical and textural characteristics of the Medium soil, combined with the homogeneous soil water content in the digging moment, provided a better quality process with lower losses, as well as meeting most of the specifications.
The Loamy soil met the specifications well, and obtained lower quality than the Medium soil only by differences of variability, but not disqualified.
REFERENCES
BRAGACHINI, M. E.; PEIRETTI, J. Mejoras en la Eficiencia de Cosecha de Maní. Gacetilla de
Prensa: 09/2008 – Marzo 2008. Disponível em:
<http://www.cosechaypostcosecha.org/data/gacetillas/2008/20080319_mani.asp>. Acesso em: 2 jan. 2009.
BRASIL. Ministério da Agricultura, Pecuária e Abastecimento. Secretaria de Defesa Agropecuária.
Regras para análise de Sementes. Brasília, DF, 2009. 395p.
BUOL, S. W.; SOUTHARD, R. J.; GRAHAM, R. C.; MCDANIEL, P. A. Morphology and
compositions of soils. In: Buol SW, Southard RJ, Graham RC, McDaniel PA (Ed.). Soil genesis
and classification. 6th ed. Oxford: Wiley-Blackwell, 2011, p. 35-88.
CASSIA, M. T.; SILVA, R. P.; CHIODEROLLI, C. A.; NORONHA, R. H. F.; SANTOS, E. P.
Quality of mechanized coffee harvesting in circular planting system. Ciência Rural, Santa Maria,
v. 43, n.1, p. 28-34, 2013.
CAVICHIOLI, F. A.; ZERBATO, C.; BERTONHA, R. S.; SILVA, R. P.; SILVA, V. F. A. Perdas
quantitativas de amendoim nos períodos do dia em sistemas mecanizados de colheita. Científica,
Jaboticabal, v.42, n.3, p.211–215, 2014.
CHIODEROLI, C.A.; SILVA, R.P.; NORONHA, R.H.F.; CASSIA, M.T.; SANTOS, E.P. Perdas
de grãos e distribuição de palha na colheita mecanizada de soja. Bragantia, Campinas, v.71, n.1,
p.112-121, 2012.
COMPAGNON, A.M.; SILVA, R.P.; CASSIA, M.T.; GRAAT, D.; VOLTARELLI, M.A.
Comparação entre métodos de perdas na colheita mecanizada de soja. Scientia Agropecuaria,
Trujillo, v.3, n.3, p.215-223, 2012.
EMBRAPA - EMPRESA BRASILEIRA DE PESQUISA AGROPECUÁRIA. Sistema brasileiro
de classificação de solos. 3.ed. Brasília, DF, 2013. 353p.
HESSLER, C.V.; CAMARGO, M.E.; Dorion, E. Application control charts for analysis of quality in industrial painting. In: INTERNATIONAL CONFERENCE ON COMPUTERS &
INDUSTRIAL ENGINEERING, 39., 2009, Troyes. Proceedings… Troyes: IEEE Xplore, 2009.
v.1, p.1330-1334,
INCE, A.; GUZEL, E. Effects of gynophore breaking resistance on losses in mechanized peanut harvesting. In: INTERNATIONAL CONFERENCE ON CROP HARVESTING AND
PROCESSING, 2003, Louisville. Proceedings… St Joseph:ASABE, 2003. p. 1103.
MONTGOMERY, D. C. Introduction to statistical quality control. 6th ed. Nova York: John
Wiley and Sons, 2009. p. 6.
OLIVEIRA, J. B.; CAMARGO, M. N.; ROSSI, M.; CALDERANO FILHO, B. Mapa pedológico
do Estado de São Paulo: Legenda Expandida. Campinas: IAC, 1999.
ORMOND, A. T. S.; VOLTARELLI, M. A.; PAIXÃO, C. S. S., GÍRIO, L. A. S.; ZERBATO, C.;
SILVA, R. P. Características agronômicas da soja em semeadura convencional e cruzada. Revista
Agro@mbiente On-line, Roraima, v. 9, n. 4, p. 414-422, out./dez. 2015.
PEEL, M.; FINLAYSON, B.; MCMAHON, T. Updated world map of the Koppen-Geiger climate
classification. Hydrology Earth and System Sciences, Kattenburg – Lindau, v. 11, p. 1633-1644,
SANTOS, A. F., KAZAMA, E. H., ORMOND, A. T. S., TAVARES, T. O.; SILVA, R. P. Quality
of mechanized peanut digging in function of the auto guidance. African Journal of Agricultural
Research, v. 11, n 48, p. 4894-4901, 2016.
SANTOS, E. P.; SILVA, R. P.; BERTONHA, R. S.; NORONHA, R. H. F.; ZERBATO, C.
Produtividade e perdas de amendoim em cinco diferentes datas de arranquio. Revista Ciência
Agronômica, Fortaleza, v. 44, n. 4, p. 695-702, 2013.
SANTOS, E. P.; SILVA, R. P.; FURLANI, C. E. A.; BERTONHA, R. S.; MEDEIROS; R. S. Perdas na colheita mecanizada de amendoim. In: CONGRESO LATINOAMERICANO Y DEL
CARIBE DE INGENIERÍA AGRÍCOLA, 9., 2010. Anais...Vitória: SBEA, 2010,
SEGATO, S.V.; PENARIOL, A.L. A cultura do amendoim em áreas de reforma de canavial. In:
SEGATO, S. V.; FERNANDES, C.; PINTO, A.S. Expansão e renovação de canavial. Piracicaba:
Editora CP 2, 2007. p. 85-116.
TAVARES, T.O.; SANTINATO, F.; SILVA, R.P.; VOLTARELLI, M.A.; PAIXÃO, C.S.S.;
SATINATO, R. Qualidade do recolhimento mecanizado do café. Coffee Science, Lavras, v. 10, n.
4, p. 455-463, 2015.
WILLIAMS, E. J.; DREXLER, J. S. A non destructive method for determining peanut pod
maturity. Peanut Science, Perkins, v. 8, n. 2, p. 134-141, 1981.
ZERBATO, C.; SILVA, V. F. A.; TORRES, L. S.; SILVA, R. P.; FURLANI, C. E. A. Peanut
mechanized digging regarding to plant population and soil water level. Revista Brasileira de