snakes elicit earlier, and monkey
faces, later, gamma oscillations in
macaque pulvinar neurons
Quan Van Le
1,4, Lynne A. Isbell
2, Jumpei Matsumoto
1, Van Quang Le
1, Hiroshi Nishimaru
1,
etsuro Hori
1, Rafael s. Maior
3,5, Carlos tomaz
3,6, taketoshi ono
1& Hisao Nishijo
1Gamma oscillations (30–80 Hz) have been suggested to be involved in feedforward visual information processing, and might play an important role in detecting snakes as predators of primates. In the present study, we analyzed gamma oscillations of pulvinar neurons in the monkeys during a delayed non-matching to sample task, in which monkeys were required to discriminate 4 categories of visual stimuli (snakes, monkey faces, monkey hands and simple geometrical patterns). Gamma oscillations of pulvinar neuronal activity were analyzed in three phases around the stimulus onset (Pre-stimulus: 500 ms before stimulus onset; Early: 0–200 ms after stimulus onset; and Late: 300–500 ms after stimulus onset). The results showed significant increases in mean strength of gamma oscillations in the Early phase for snakes and the Late phase for monkey faces, but no significant differences in ratios and frequencies of gamma oscillations among the 3 phases. The different periods of stronger gamma oscillations provide neurophysiological evidence that is consistent with other studies indicating that primates can detect snakes very rapidly and also cue in to faces for information. our results are suggestive of different roles of gamma oscillations in the pulvinar: feedforward processing for images of snakes and cortico-pulvinar-cortical integration for images of faces.
Animals must be able to navigate the biotic world in order to survive and reproduce successfully. This includes avoiding predators and dealing with conspecifics. The main predators of primates are mammalian carnivores, raptors, and snakes1. A combination of neuroscientific, paleontological, molecular, and biogeographic evidence
has been used to propose that snakes in particular were largely responsible for the origin of primates and the later appearance of anthropoid primates via selection on the visual system for more rapid and reliable detection2–3.
Despite the great expansion of the primate visual sense compared to other mammals, however, snakes are often highly camouflaged and can be extremely difficult to see, even for primates4, and primates, including humans,
are still at risk of death from both constricting and venomous snakes today5–7. Extensive research has now shown
that snakes can elicit reliable behavioral responses from primates, including rapid detection, focused attention, and avoidance8–15.
Interacting with conspecifics is especially challenging for animals that routinely live together in social groups because social interactions occur frequently between familiar individuals over long periods of time. Most catar-rhine primates, including macaques (Macaca spp.), live in such groups and have facial musculature that allows a wide range of facial expressions revealing emotion or intention, from threats to appeasement16–17. Moreover,
in catarrhines, facial nucleus volume as an estimate of facial motor control is correlated with the volume of V118.
Both the ability to express intentions clearly and the ability of others to process those expressions correctly should also be advantageous to survival and reproduction in social animals.
Responses to faces, facial expressions reflecting threat or danger, and snakes have been associated with the subcortical visual system involving the superior colliculus (SC) and pulvinar, which provides fast and coarse
1System emotional Science, Graduate School of Medicine and Pharmaceutical Sciences, University of toyama, Sugitani 2630, Toyama, 930-0194, Japan. 2Department of Anthropology, University of California, Davis, CA 95616, USA. 3Primate Center and Laboratory of Neurosciences and Behavior, Department of Physiological Sciences, Institute of Biology, University of Brasília, CEP 70910-900, Brasilia, DF, Brazil. 4Vietnam Military Medical University, Ha Noi, Vietnam. 5Karolinska Institute, Department of Clinical Neuroscience, Psychiatry Section, Karolinska Hospital, S-17176 Stockholm, Sweden. 6University CEUMA, Neuroscience Research Coordenation, Campus Renascença, CEP 65.075-120 São Luis, MA, Brazil. Correspondence and requests for materials should be addressed to H.N. (email: [email protected])
Received: 01 October 2015 Accepted: 07 January 2016
Published: 08 February 2016
processing of such visual stimuli10,16,19–25. The pulvinar has uniquely evolved in primates26, suggesting that there
has been strong selection on primates for rapid visual detection of threatening stimuli. Previous neurophysiolog-ical studies reported that neurons in the pulvinar of Japanese macaques (M. fuscata) responded even faster and more strongly to snakes than to monkey faces23, and more strongly snakes in striking posture than in non-striking
posture27. These findings suggest that snakes, which can bite extremely quickly, have provided a source of
selec-tion for particularly rapid visual responses that can be distinguished from other threats that may be informative but not as time-sensitive.
It is still not clear, however, how snake-induced neuronal firing captures attention so rapidly. Recent studies suggest that gamma oscillation might facilitate perceptual processing in the cortical visual system by feedfor-ward processes28–30. The pulvinar plays an important role in regulating cortico-cortical information transmission
through the modulation of inter-areal synchrony during cognitive tasks31, and a critical role in attentional
selec-tion and in regulating informaselec-tion transmission across the visual cortex32. When a stimulus is visually attended
to, rhythmic gamma band oscillation is induced to establish a communication link among multiple brain areas33.
Furthermore, there is some evidence that gamma band activity (oscillation) is correlated with a decrease in reac-tion time34,35. These findings suggest that snakes might elicit gamma oscillations in the pulvinar. In the present
study, we analyzed gamma oscillations of the neuronal responses in the monkey pulvinar to images of snakes, and compared them with monkey faces and, as controls, monkey hands and simple geometrical patterns to comple-ment an earlier study that docucomple-mented preferential neuronal responses in the pulvinar to snakes23. We predicted
that gamma oscillations would occur earlier in response to images of snakes than for other stimulus categories.
Results
Basic characteristics.
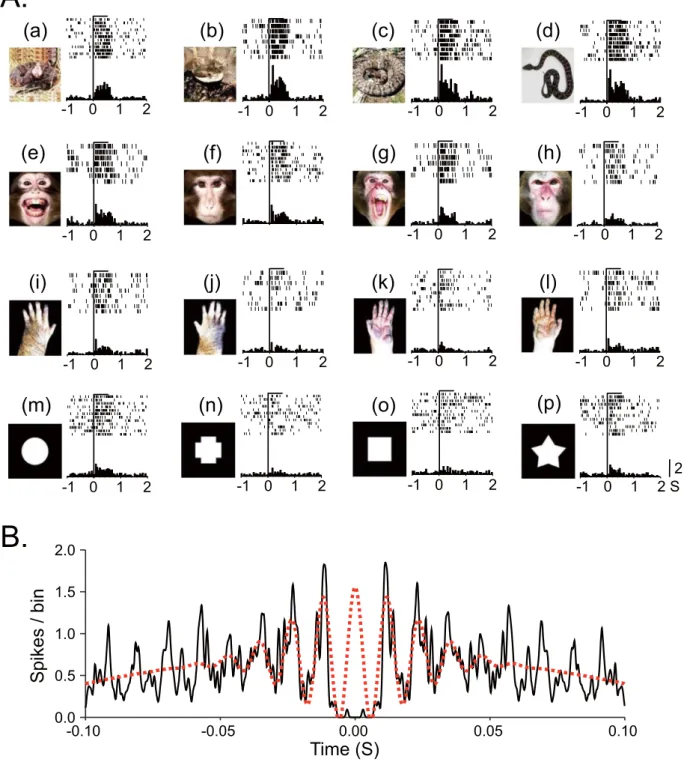
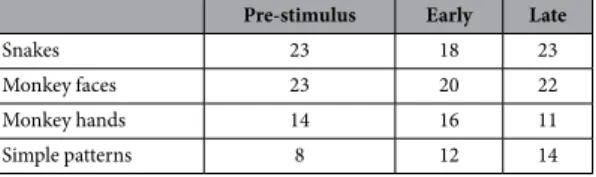
Of 745 neurons recorded, 115 neurons responded to visual stimuli (responsive neu-rons). Of these 115 responsive neurons, 91 neurons were tested with all stimuli and were used to analyze gamma oscillations. Figure 1A shows an example of a pulvinar neuron that responded strongly to snakes. This neuron responded strongly to all four snake images (Fig. 1A, a–d) and less to other stimuli (e–p). Gamma oscillations of pulvinar neuronal activity were analyzed in three phases around the stimulus onset (Pre-stimulus: 500 ms before stimulus onset; Early: 0–200 ms after stimulus onset; and Late: 300–500 ms after stimulus onset). Figure 1B shows an example of gamma oscillation in Early phase during presentation of snakes. Of 91 responsive neurons, 79 neurons showed significant gamma oscillation for at least one of the four categories of the stimuli in one or more phases. These neurons were located in the medial and dorsolateral pulvinar23. Table 1 shows the number ofpulvinar neurons with significant gamma oscillation activity during presentation of each category of the stimuli in the three phases.
Comparison of gamma oscillation among the 4 stimulus categories.
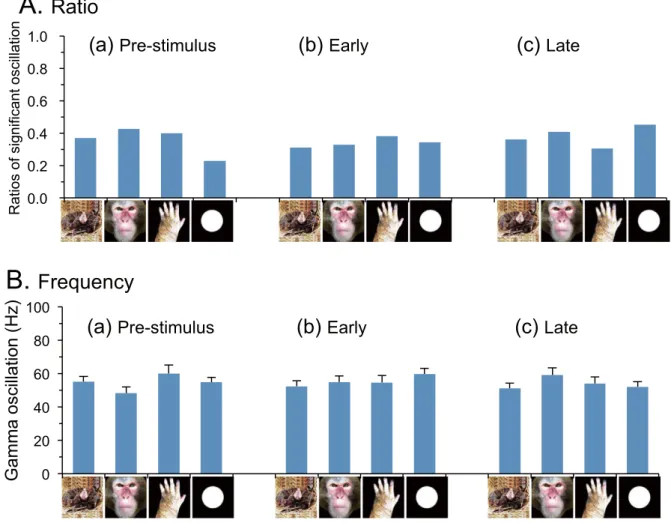
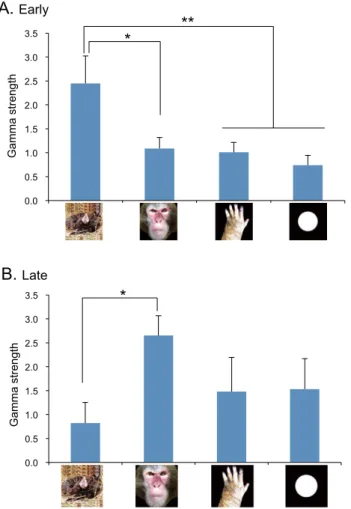
Figure 2A shows ratios of gamma oscillating neurons to the total of the responsive neurons (n = 91) in the three phases. The ratios among the four categories ranged from 20 to 50% but these differences were not statistically significant (χ 2 tests, p > 0.05). Furthermore, there were no significant differences in ratios of gamma oscillating neurons among the 3 phases in each of the four categories (χ 2 tests, p > 0.05). Figure 2B shows the comparison of mean frequencies of gamma oscillation. The pulvinar neurons showed 50–70 Hz gamma oscillation. However, a statistical analysis by two-way ANOVA indicated that there were no significant main effects of stimulus category [F(3, 192) = 0.554, p > 0.05] and phase [F(2, 192) = 0.140, p > 0.05], nor significant interaction between stimulus category and phase [F(6, 192) = 1.312, p > 0.05].Figure 3 shows the comparison of mean strength of gamma oscillation (gamma strength). A statisti-cal analysis by two-way ANOVA indicated that there were no significant main effects of stimulus category [F(3, 107) = 0.271, p > 0.05] and phase [F(2, 107) = 0.986, p > 0.05]. Nevertheless, there was a significant interac-tion between stimulus category and phase [F(6, 107) = 3.187, p < 0.05]. Post-hoc multiple comparisons indicated that mean gamma strength for snakes was significantly greater in Early phase than in Pre-stimulus phase (Bonferroni test, p < 0.05), while mean gamma strength for monkey faces was significantly greater in Late phase than in Pre-stimulus phase (Bonferroni test, p < 0.05). Figure 4A indicates subsidiary comparison of gamma strength among 4 categories in Early phase by one-way ANOVA. The statistical results indicated a significant main effect [F(3, 39) = 3.883, p < 0.016]. Post-hoc multiple comparisons indicated that mean gamma strength was signifi-cantly greater for snakes than for monkey faces (Tukey test, p < 0.05), monkey hands (Tukey test, p = 0.057), and simple geometrical patterns (Tukey test, p = 0.053). Figure 4B indicates subsidiary comparison of gamma strength among 4 categories in Late phase by one-way ANOVA. The statistical results indicated a significant main effect [F(3, 28) = 3.188, p < 0.027]. Post-hoc multiple comparisons indicated that mean gamma strength was signifi-cantly greater for monkey faces than for snakes in Late phase (Tukey test, p < 0.05).
To analyze these characteristics in detail, gamma oscillations (30–80 Hz) in the 200-ms period during 150–350 ms after stimulus onset (Mid-phase) were similarly analyzed. The results indicated that there were no sig-nificant differences in ratios of gamma oscillating neurons, among the four categories of the stimuli in Mid-phase (Supplementary Results). These results indicated that these characteristic changes were specific to Early and Late phases. Second, since gamma oscillation includes wide range of frequencies (i.e., 30–80 Hz), the gamma band was divided into two frequency bands; low gamma (30–50 Hz) and gamma (50–80 Hz). Separate analyses of oscilla-tions in the two gamma bands indicated that both low and high gamma bands showed similar trends to those in full gamma band (Supplementary Results).
Discussion
This study demonstrated that individual monkey pulvinar neurons showed gamma oscillation during visual discrimination. Although previous studies reported pulvinar involvement in gamma oscillation36,37, the
frequencies. In the forebrain structures, parvalbumin-positive interneurons are specifically implicated in the generation of gamma oscillation in rodents38–40, and the pulvinar includes parvalbumin-positive neurons as local
circuit neurons in cats41,42. Gamma oscillations have been reported in the SC43,44, which sends visual information
to the pulvinar45,46. These neural circuits may contribute to gamma oscillation in the pulvinar.
A.
B.
Spikes / bin
2
-1 0
1
2
(b)
(
d
)
)
a
(
(c)
(f)
(
h
)
)
e
(
(g)
(j)
(
l
)
)
i
(
(k)
(n)
(m)
(o)
(p)
2.0
1.5
1.0
0.5
0.0
-0.10
-0.05
0.00
0.05
0.10
-1 0
1
2
-1 0
1
2
-1 0
1
2
-1 0
1
2
-1 0
1
2
-1 0
1
2
-1 0
1
2
-1 0
1
2
-1 0
1
2
-1 0
1
2
-1 0
1
2
-1 0
1
2
-1 0
1
2 S
-1 0
1
2
Time (S)
Figure 1. An example of a pulvinar neuron that responded most strongly to snakes. (A, a–l). Raster displays
As predicted, we found that images of snakes elicited strong gamma oscillations earlier than did other stimuli. Since low-level features of the snake photos were different from those of other categories (see Methods), this characteristic might be ascribed to these differences rather than to snakes themselves. However, it is unlikely. Our previous study indicated that pulvinar neuronal responses were markedly attenuated by scrambling the pho-tos23. We thus further tested four pulvinar neurons with significant gamma oscillation in response to snakes with
scrambled photos of the snakes. The results indicated that gamma band oscillation disappeared in response to the scrambled snakes in all four neurons. These results strongly suggest that features of snakes are important to induce gamma oscillation. Growing evidence indicates that the SC and pulvinar function as a coarse and quick visual processing module to detect threating stimuli, and gamma oscillation might facilitate perceptual processing by feedforward processes. Our findings suggest that images of snakes elicit gamma oscillation in the subcortical visual system, including the pulvinar, via fast bottom-up information processing that then activates the cortical visual system to hold attention. Consistent with this idea are findings that inactivation of the pulvinar decreased gamma oscillation in the visual cortex36,37 and salience of the stimulus47. Furthermore, it has been reported that
the strength of visual stimulus-induced gamma oscillations in the visual cortex predicted the speed with which subjects detected stimulus changes48, and gamma power was associated with conscious recognition of visual
stim-uli49. These findings suggest a functional role of gamma oscillation in efficient visual processing, and the present
results suggest that snakes could be detected efficiently by gamma oscillation.
We previously reported that macaque pulvinar neurons differentially respond to facial stimuli21. In that study,
over 50% of face responsive neurons responded 200 ms after stimulus onset. In the present study, gamma strength for monkey faces was greater in the Late phase, later than with snakes. Previous studies have defined two tem-poral types of gamma oscillations; ‘early gamma’ before 150 ms after stimulus onset, and ‘late gamma’ later than 200 ms after stimulus onset. Early gamma might be related to bottom-up processes, while late gamma might be related to top-down processes to interpret and utilize the information resulting from the processes by the early gamma (reviewed by Herrmann et al. 2004)50. Faces are complex social stimuli for primates, suggesting that faces
might activate sophisticated memories that are stored in the distributed cortical areas. Consistent with this idea, gamma oscillation is reported to be involved also in higher cognitive processes such as memory retrieval51. The
pulvinar has intimate and reciprocal connections with various cortical association areas52, which are also directly
connected to each other53,54. Furthermore, inactivation of the pulvinar reduced information transfer between the
visual association areas32. These findings suggest that gamma oscillation in the Late phase might be involved in
these processes interrelating the association cortices.
The primate visual system has been argued to have evolved under the evolutionary pressure of snakes that would have given an advantage to individuals that could react quickly to snakes2,3. Consistent with this
hypoth-esis, as described above, several behavioral studies have shown that humans and monkeys respond faster to snakes than other stimuli. The present results showed stronger gamma oscillation of pulvinar neurons in differ-ent periods in response to snake (0–200 ms) and face images (300–500 ms). An early increase in gamma oscil-lation elicited by snake images might contribute to rapid snake detection by feedforward processing, whereas a later increase in gamma strength might reflect more sophisticated social information processing in complex cortico-pulvinar-cortical pathways. The present results provide electrophysiological evidence that gamma oscil-lation can occur at individual neurons in the pulvinar, and highlight distinct visual information processing of snakes and faces in gamma oscillation.
Methods
subjects.
Two adult (one female and one male) macaque monkeys (Macaca fuscata) weighing 7.2–9.5 kg were used. The monkeys were deprived of water in their home cage and received juice as a reward during training and recording sessions. Supplemental water and vegetables were given after each day’s session. To assess the monkeys’ health, their weight was routinely monitored. The monkeys were treated in strict compliance with the United States Public Health Service Policy on Human Care and Use of Laboratory Animals, the National Institutes of Health Guide for the Care and Use of Laboratory Animals, and the Guidelines for the Care and Use of Laboratory Animals of the University of Toyama. This study was approved by the Committee for Animal Experiments and Ethics at the University of Toyama.experimental setup.
The monkey sat in a monkey chair 68 cm away from the center of a 19-inch computer display for behavioral tasks during the training and recording sessions in a shielded room. The CRT monitor was set so that its center was on the same horizontal plane as the monkey’s eyes. The monkey chair was equipped with a responding button, which was positioned so that the monkey could easily manipulate it. An infrared charge-coupled device (CCD) camera for eye-movement monitoring was firmly attached to the chair by a steel rod. During training and recording sessions, the monkey’s eye position was monitored with 33 ms time resolutionPre-stimulus Early Late
Snakes 23 18 23
Monkey faces 23 20 22
Monkey hands 14 16 11
Simple patterns 8 12 14
Table 1. Number of pulvinar neurons with significant gamma oscillation activity during presentation of
0.0 0.2 0.4 0.6 0.8
1.0
(a)
Pre-stimulus
(b)
Early
(c)
Late
Ratios of significant oscillation
0 20 40 60 80 100
Gamma oscillation (Hz)
(a)
Pre-stimulus
(b)
Early
(c)
Late
A.
Ratio
B.
Frequency
Figure 2. (A) Comparison of ratios of gamma oscillating neurons (number of gamma oscillating neurons/
number of responsive neurons) among the three phases around stimulus onset. There was no significant difference in the ratios of gamma oscillating neurons among 3 phases nor among four categories of the stimuli. (B) Comparison of mean frequency of gamma oscillation among the three phases around stimulus onset. There was no significant difference in the frequency of gamma oscillation among 3 phases nor among four categories of the stimuli. Illustrations are original drawings by Q. V. Le and H. Nishijo; a snake was photographed by Mr. D. Hillman.
0.0 0.5 1.0 1.5 2.0 2.5 3.0 3.5
!" #" $" %" &" '" (" )" *" !+" !!" !#" !$" !%"
A. Pre-stimulus
B. Early
C. Late
*
**
Gamma strength
Figure 3. Comparison of gamma strength among the three phases around stimulus onset. *p < 0.05;
by an eye-monitoring system55. The juice reward was accessible to the monkey through a small spout controlled
by an electromagnetic valve. A visual stimulus generator (ViSaGe MKII Visual Stimulus Generator, Cambridge Research Systems, UK) controlled the electromagnetic valve, the timing of visual stimuli onset.
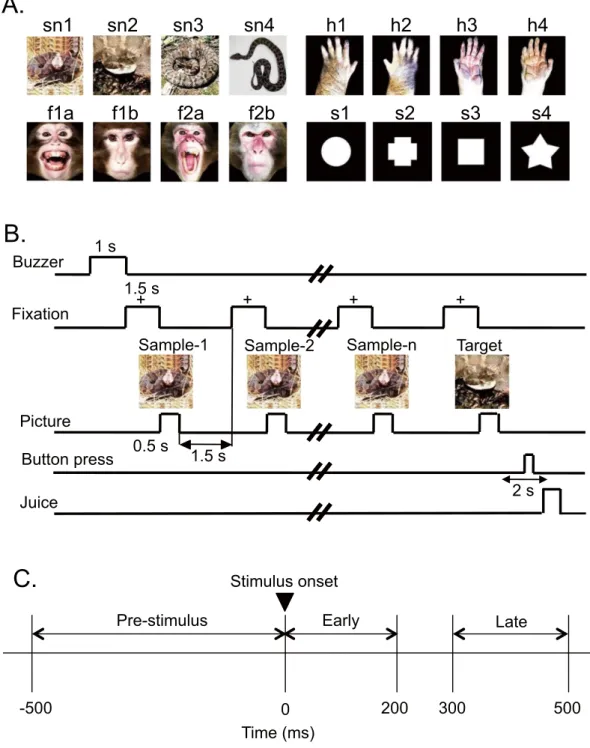
Visual stimuli.
Figure 5A shows the stimulus set, consisting of photographs of snakes, monkey faces (neutral and expressive faces), and monkey hands, and drawings of simple geometrical patterns (circle, cross, square and star), used in the present study. The stimuli were 256 digitized RGB color-scale images with their resolution of 227 × 227 pixels. Stimuli were presented on a black background of 0.7 cd/m2 with their centers at the center of thedisplay. The luminance of these color stimuli was almost identical (6.005–6.445 cd/m2) [luminous intensity (total
luminance) ranged from 38.432 to 41.248 mcd]. Luminance of the white areas inside the simple geometric pat-terns was 36.5 cd/m2 (total luminance of the circle, cross, square, and star was 33.368, 32.676, 32.555, and 31.822
mcd, respectively). These stimuli were displayed on a CRT monitor with a resolution of 640 × 480 pixels, and the size of the stimulus area was 5–7 × 5–7°.
Furthermore, low-level features of the visual stimulus, i.e., contrast, color histograms, and spatial-frequency power distribution were calculated and compared across the four categories. The comparisons indicated that low-level features (color histogram, spatial-frequency power distribution) of snakes were significantly different from those of other categories (see Supplementary Methods).
Behavioral tasks.
The monkeys were trained to perform a sequential delayed nonmatching-to-sample (DNMS) task that required the discrimination of visual stimuli (Fig. 5B)23. The task was initiated by a buzzer tone.Then, a fixation cross appeared at the center of the display. When the monkeys fixated on the cross for 1.5 s within 0.5–1.0° window, a sample stimulus was presented for 500 ms (sample phase). Then, after an interval of 1.5 s, the same stimulus appeared again for 500 ms, and this occurred between one and four times (selected randomly for each trial). Finally, a new stimulus was presented (target phase). When the target appeared, the monkey was required to press the button within 2 s to receive a juice reward (0.8 mL). When the monkey failed to respond cor-rectly during the target phase or to press the button before the target phase, the trials were aborted, and a 620-Hz buzzer tone was sounded. The intertrial intervals were 15–25 s.
0.0 0.5 1.0 1.5 2.0 2.5 3.0 3.5
!" #" $" %"
*
**
A.
EarlyGamma strength
0.0 0.5 1.0 1.5 2.0 2.5 3.0 3.5
!" #" $" %"
*
Gamma strength
B.
LateFigure 4. Comparison of gamma strength among the four categories of the stimuli in Early phase (A) and
Late phase (B). *p < 0.05; **p < 0.01. Illustrations are original drawings by Q. V. Le and H. Nishijo; a snake were
electrophysiological procedures and data acquisition.
The monkeys were trained to perform DNMS task for 3 h/day, 5 day/week. The monkeys reached a 96% correct-response rate after 3 months of training23,27.After completion of this training period, a head-restraining device, which was a U-shaped plate made of epoxy resin, was attached to the skull under aseptic conditions23,27. After the monkeys relearned the DNMS task and
were correct at least 85% of the time, we commenced recording neuronal activity from each hemisphere in both subjects. A glass-insulated tungsten microelectrode (0.8–1.5 MΩ at 1 kHz) was stereotaxically inserted into the pulvinar vertically to the orbitomeatal plane. The analog signals of the neuronal activities, visual stimulus triggers, juice rewards, button presses, and X-Y eye position coordinates were digitized at a 40-kHz sampling rate and stored in a computer through a multichannel acquisition processor (Plexon Inc., Dallas, TX) system. The digitized
sn1
sn2
sn3
sn4
f1a
f1b
f2a
f2b
h1
h2
h3
h4
s1
s2
s3
s4
+
+
+
+
Buzzer
Fixation
Picture
Button press
Juice
1 s
1.5 s
Sample-1
Sample-2
Sample-n
Target
2 s
1.5 s
0.5 s
B.
A.
Time (ms)
0
500
Stimulus onset
200
Pre-stimulus
300
-500
Early
Late
C.
Figure 5. Visual stimuli (A) and delayed nonmatching-to-sample (DMNS) task (B) used in the present
study, and three task phases for an analysis (C). (A) Sixteen photos of four categories of the stimuli
neuronal activities were isolated into single units by their waveform components with the Offline Sorter program (Plexon Inc.). The data that were used in the present study were previously reported in Le et al. (2013, 2014)23,27,
and more details of the procedures can be found in those studies.
Analysis of the basic characteristics of pulvinar neurons.
We analyzed the activity of single neurons during the 500-ms period after (post) the onset of stimulus presentation in the sample phase, but we did not ana-lyze the activity of single neurons in the target phase. Only the stimuli that were presented more than five times in the sample phase across trials were analyzed. The baseline firing rate was defined as the mean firing rate during the 100-ms pre period. The significance of the excitatory or inhibitory responses to each stimulus was determined by comparing between the 100-ms pre and 500-ms post periods with a Wilcoxon signed-rank test. P values less than 0.05 were considered statistically significant (responsive neurons).Periodicity of spike firings.
For each responsive neuron, periodic firing patterns in the 30–80 Hz range during the DNMS task were analyzed in the 3 phases for each stimulus category (Fig. 5C); 500-ms period before stimulus onset (Pre-stimulus phase), 200-ms period after stimulus onset (Early phase), and 200-ms period during 300–500 ms after stimulus onset (Late phase). An auto-correlogram over 200 ms (bin size 0.1 ms) was calculated in each phase and filtered with the Gaussian filter (full width at half maximum, 1 ms). Then, according to König (1994)56 and Engel et al. (1990)56, the primary oscillation frequency between 10 and 150 Hz was calculated bynon-linear fitting of the following function to the auto-correlogram.
ƒ( ) =t A·exp((− / ) )t σ12 · cos 2( π ν( )) +t O+B·exp((− /t σ2) )2 ( )1
Where the first term represents Gabor function; the second term (O) is an offset; the third term represents a Gaussian function to consider a central modulation of the auto-correlogram; t is time; A, σ
1 and ν are amplitude,
decay constant, and wave frequency of the Gabor function, respectively; and B and σ
2 are amplitude and width
of the Gaussian function, respectively. Frequency of oscillation of a given neuron corresponds to wave frequency of the Gabor function (ν). Although the same function and the algorithm for non-linear regression were used
as reported by König (1994)56, the criteria were slightly modified following Engel et al. (1990)57 and Matsumoto et al. (2012)58. A given neuron was considered to be significantly oscillated in a given frequency (ν) and in a given
phase according to the following three criteria: (1) the function was regressed with the effective coefficient of the amplitude (A) and frequency (ν) (p < 0.05); (2) the decay constant (σ
1) was larger than 1/ ν*0.8, which means that
the fitted function had at least one satellite peak57,58; and (3) the number of spikes within the auto-correlogram
was > 50.
If a neuron showed the amplitude (A) and offset (O) to be simultaneously statistically significant, we calculated the strength of oscillation by the ratio between A and O for that neuron.
statistical analysis of gamma oscillation.
The percentages of gamma oscillating neurons, frequency and strength of oscillation in response to each stimulus category (snakes, monkey faces, monkey hands, and simple geometrical patterns) in each phase (Pre-stimulus, Early, and Late) were calculated. The ratios of gamma oscillat-ing neurons were compared with Chi-square tests. Frequency and strength of oscillation among the 3 phases were compared using two-way analysis of variance tests (ANOVA) with post hoc tests using Bonferroni correction. All statistical analyses were performed using the SPSS software package (ver. 19, IBM Corporation, Armonk, NY, USA). Any differences were considered statistically significant with p < 0.05.References
1. Isbell, L. A. Predation on primates: ecological patterns and evolutionary consequences. Evol. Anthropol. 3, 61–71 (1994). 2. Isbell, L. A. Snakes as agents of evolutionary change in primate brains. J. Hum. Evol. 51, 1–35 (2006).
3. Isbell, L. A. The Fruit, the Tree, and the Serpent: Why We See so Well (Harvard University Press, 2009). 4. Greene, H. W. Snakes: The Evolution of Mystery in Nature. (University of California Press, 1997). 5. Warrell, D. A. Snake bite. Lancet 375, 77–88 (2010).
6. Williams, D. et al. The Global Snake Bite Initiative: an antidote for snake bite. Lancet 375, 89–91 (2010).
7. Headland, T. N. & Greene, H. W. Hunter-gatherers and other primates as prey, predators, and competitors of snakes. Proc. Natl. Acad. Sci. USA 108, 1470–1474 (2011).
8. Öhman, A. & Mineka, S. The malicious serpent: snakes as a prototypical stimulus for an evolved module of fear. Curr. Dir. Psychol. Sci. 12, 5–9 (2003).
9. LoBue, V. & DeLoache, J. S. Detecting the snake in the grass: Attention to fear relevant stimuli by adults and young children. Psychol. Sci. 19, 284–289 (2008).
10. Maior, R. S. et al. Superior colliculus lesions impair threat responsiveness in infant capuchin monkeys. Neurosci. Lett. 504, 257–260 (2011).
11. Hayakawa, S., Kawai, N. & Masataka, N. The influence of color on snake detection in visual search in human children. Sci. Rep. 1, 80 (2011).
12. Soares, S. C. The lurking snake in the grass: interference of snake stimuli in visually taxing conditions. Evol. Psychol. 10, 187–197 (2012).
13. Soares, S. C., Lindström, B., Esteves, F. & Öhman, A. The hidden snake in the grass: superior detection of snakes in challenging attentional conditions. PloS One 9, e114724 (2014).
14. Yorzinski, J. L., Penkunas, M. J., Platt, M. L. & Coss, R. G. Dangerous animals capture and maintain attention in humans. Evol. Psychol. 12, 534–548 (2014).
15. Almeida, I., Soares, S. C. & Castelo-Branco, M. The distinct role of the amygdala, superior colliculus and pulvinar in processing of central and peripheral snakes. PloS One 10, e0129949 (2015).
16. Burrows, A. M. The facial expression musculature in primates and its evolutionary significance. BioEssays 30, 212–225 (2008). 17. Dobson, S. D. Socioecological correlates of facial mobility in nonhuman primates. Amer. J. Phys. Anthropol. 139, 413–420 (2009). 18. Dobson, S. D. & Sherwood, C. C. Correlated evolution of brain regions involved in producing and processing facial expressions in
19. Morris, J. S., Ohman, A. & Dolan, R. J. A subcortical pathway to the right amygdala mediating “unseen” fear. Proc. Natl. Acad. Sci. USA 96, 1680–5 (1999).
20. Gelder, B. C., Morris, J. S. & Dolan, R. J. Unconscious fear influences emotional awareness of faces and voices. Proc. Natl. Acad. Sci. USA 102, 18682–18687 (2005).
21. Maior, R. S., Hori, E., Tomaz, C., Ono, T. & Nishijo, H. The monkey pulvinar neurons differentially respond to emotional expressions of human faces. Behav. Brain Res. 215, 129–35 (2010).
22. Tamietto, M. & de Gelder, B. Neural bases of the non-conscious perception of emotional signals. Nat. Rev. Neurosci. 11, 697–709 (2010).
23. Le, Q. V. et al. Pulvinar neurons reveal neurobiological evidence of past selection for rapid detection of snakes. Proc. Natl. Acad. Sci. USA 110, 19000–5 (2013).
24. Nguyen, M. N. et al. Neuronal responses to face–like stimuli in the monkey pulvinar. Eur. J. Neurosci. 37, 35–51 (2013).
25. Nguyen, M. N. et al. Neuronal responses to face-like and facial stimuli in the monkey superior colliculus. Front. Behav. Neurosci. 8, 85 (2014).
26. Kaas, J. H. The evolution of the visual system in primates in The New Visual Neurosciences (eds Werner, J. S. et al.) 1233–1246 (MIT Press, 2014).
27. Le, Q. V. et al. Monkey pulvinar neurons fire differentially to snake postures. PLoS One 9, e114258 (2014). 28. Arnal, L. H. & Giraud, A. L. Cortical oscillations and sensory predictions. Trends Cogn. Sci. 16, 390–8 (2012).
29. van Kerkoerle, T. et al. Alpha and gamma oscillations characterize feedback and feedforward processing in monkey visual cortex. Proc. Natl. Acad. Sci. USA 111, 14332–41 (2014).
30. Bastos, A. M. et al. Visual areas exert feedforward and feedback influences through distinct frequency channels. Neuron 85, 390–401 (2015).
31. Saalmann, Y. B. & Kastner, S. Cognitive and perceptual functions of the visual thalamus. Neuron 71, 209–23 (2011).
32. Saalmann, Y. B., Pinsk, M. A., Wang, L., Li, X. & Kastner, S. The pulvinar regulates information transmission between cortical areas based on attention demands. Science 337, 753–56 (2012).
33. Fries, P. Rhythms for cognition: communication through coherence. Neuron 88, 220–35 (2015).
34. Fründ, I., Busch, N. A., Schadow, J., Körner, U. & Herrmann, C. S. From perception to action: phase-locked gamma oscillations correlate with reaction times in a speeded response task. BMC Neurosci. 8, 27 (2007).
35. Brücke, C. et al. Thalamic gamma oscillations correlate with reaction time in a Go/noGo task in patients with essential tremor. Neuroimage 75, 36–45 (2013).
36. Molotchnikoff, S. & Shumikhina, S. The lateral posterior-pulvinar complex modulation of stimulus-dependent oscillations in the cat visual cortex. Vision Res. 36, 2037–46 (1996).
37. Shumikhina, S. & Molotchnikoff, S. Pulvinar participates in synchronizing neural assemblies in the visual cortex, in cats. Neurosci. Lett. 272, 135–9 (1999).
38. Cardin, J. A. et al. Driving fast-spiking cells induces gamma rhythm and controls sensory responses. Nature 459, 663–7 (2009). 39. Sohal, V. S., Zhang, F., Yizhar, O. & Deisseroth, K. Parvalbumin neurons and gamma rhythms enhance cortical circuit performance.
Nature 459, 698–702 (2009).
40. Nakamura, T. et al. Relationships among parvalbumin-immunoreactive neuron density, phase-locked gamma oscillations, and autistic/schizophrenic symptoms in PDGFR-β knock-out and control mice. PLoS One 10(3), e0119258 (2015).
41. Batini, C., Guegan, M., Palestini, M. & Thomasset, M. The immunocytochemical distribution of calbindin-D28k and parvalbumin in identified neurons of the pulvinar-lateralis posterior complex of the cat. Neurosci. Lett. 130, 203–7 (1991).
42. Palestini, M., Guegan, M., Saavedra, H., Thomasset, M. & Batini, C. Glutamate, GABA, calbindin-D28k and parvalbumin immunoreactivity in the pulvinar-lateralis posterior complex of the cat: relation to the projection to the Clare-Bishop area. Neurosci. Lett. 160, 89–92 (1993).
43. Brecht, M., Singer, W. & Engel, A. K. Patterns of synchronization in the superior colliculus of anesthetized cats. J. Neurosci. 19, 3567–79 (1999).
44. Goddard, C. A., Sridharan, D., Huguenard, J. R. & Knudsen, E. I. Gamma oscillations are generated locally in an attention-related midbrain network. Neuron 73, 567–80 (2012).
45. Berman, R. A. & Wurtz, R. H. Functional identification of a pulvinar path from superior colliculus to cortical area MT. J. Neurosci. 30, 6342–54 (2010).
46. Berman, R. A. & Wurtz, R. H. Signals conveyed in the pulvinar pathway from superior colliculus to cortical area MT. J. Neurosci. 31, 373–384 (2011).
47. Robinson, D. L. Functional contributions of the primate pulvinar in The visually responsive neuron: From basic neurophysiology to behavior, Progress in Brain Research (Vol. 95) (eds Hicks, T. P. et al.) 371–380 (Amsterdam:Elsevier, 1993).
48. Hoogenboom, N., Schoffelen, J. M., Oostenveld, R. & Fries, P. Visually induced gamma-band activity predicts speed of change detection in humans. Neuroimage 51, 1162–7 (2010).
49. Fisch, L. et al. Neural “ignition”: enhanced activation linked to perceptual awareness in human ventral stream visual cortex. Neuron 64, 562–74 (2009).
50. Herrmann, C. S., Munk, M. H. & Engel, A. K. Cognitive functions of gamma-band activity: memory match and utilization. Trends Cogn. Sci. 8, 347–55 (2004).
51. Osipova, D. et al. Theta and gamma oscillations predict encoding and retrieval of declarative memory. J. Neurosci. 26, 7523–7531 (2006).
52. Pessoa, L. & Adolphs, R. Emotion processing and the amygdala: from a ‘low road’ to ‘many roads’ of evaluating biological significance. Nat. Rev. Neurosci. 11, 773–783 (2010).
53. Shipp, S. The functional logic of cortico-pulvinar connections. Philos. Trans. R. Soc. Lond. B. Biol. Sci. 358(1438), 1605–24 (2003). 54. Sherman, S. M. & Guillery, R. W. Exploring the thalamus and its role in cortical function, 2nd edn (MIT Press, 2006).
55. Matsuda, K. Measurement system of the eye positions by using oval fitting of a pupil. Neurosci. Res. Suppl. 25, 270 (1996). 56. König, P. A method for the quantification of synchrony and oscillatory properties of neuronal activity. J. Neurosci. Methods 54, 31–7
(1994).
57. Engel, A. K., König, P., Gray, C. M. & Singer, W. Stimulus-Dependent Neuronal Oscillations in Cat Visual Cortex: Inter-Columnar Interaction as Determined by Cross-Correlation Analysis. Eur. J. Neurosci. 2, 588–606 (1990).
58. Matsumoto, J. et al. Neuronal responses in the nucleus accumbens shell during sexual behavior in male rats. J. Neurosci. 32, 1672–86 (2012).
Acknowledgements
Author Contributions
Hin.N., L.A.I. and C.T. conceived and designed research; Q.V.L., V.Q.L., E.H. and His.N. performed research; Q.V.L., J.M., His.N. and Hir.N. analyzed data; and His.N., L.A.I., Q.V.L., R.S.M., C.T. and T.O. wrote and revised the paper.
Additional Information
Supplementary information accompanies this paper at http://www.nature.com/srep
Competing financial interests: The authors declare no competing financial interests.
How to cite this article: Van Le, Q. et al. Snakes elicit earlier, and monkey faces, later, gamma oscillations in
macaque pulvinar neurons. Sci. Rep.6, 20595; doi: 10.1038/srep20595 (2016).