1 INTRODUCTION
Suh [3] defined Design as “the creation of synthe-sized solutions in the form of products, processes or systems that satisfy perceived needs through the mapping between the FRs in the functional domain and the Design Parameters (DPs) of the physical domain, through the proper selection of DPs that sat-isfy FRs”. So, to design or redesign a product, firstly it is necessary to determine the CAs and translate them into specific requirements, the FRs. This task is an essential task to achieve successful products, because if it’s not done correctly, designers initiate designs without fully understanding customer re-quirements, thus leading to less satisfactory prod-ucts. Generally customer needs are defined in an im-precise language, which can be easily misunderstood by the designer team. Furthermore, the designer team must consider that, typically customers have only a superficial understanding of the many func-tions that a product supports and they lack experi-ence in identifying and expressing their desirable re-quirements. Thus, it is hard to acquire accurately and completely the CAs and convert them into a success-ful design. Therefore, the ability to capture customer requirements correctly and succinctly is of
para-mount importance. To tackle this issue, several ap-proaches have been developed. In this paper we pre-sent one new approach, which aims to accurately capture the requirements expressed by customers and then convert them into FRs. Hence, by the zig-zagging process established by the AD methodol-ogy, it will be possible to map hierarchically these FRs into DPs, in order to create several alternative product solutions.
2 CONCEPTUAL FRAMEWORK
The new conceptual framework is proposed with the main goal of establishing links between the customer and functional domains, as it was recommended by Suh [3]. Basically, this approach encompasses two sequential steps. The first one consists in an explora-tory stage, qualitative research, with the aim of ob-taining, understanding, and prioritizing customer wants and needs. The capture of CAs, usually con-ducted by Market Research, is generally gathered in two ways: through indirect information (collected from consumer labs, trade journals, competitive benchmarking and forecasts, etc.) and through direct customer engagement (obtained from interviews, fo-cus groups, fo-customer councils, field observations, etc.).
A new conceptual framework based on the ECSI model to support
Axiomatic Design
Irene Ferreira
School of Technology and Management, Polytechnic Institute of Leiria, Portugal
J. Sarsfield Cabral
Engineering Faculty, Porto University, Portugal
Pedro Saraiva
Chemical Engineering Department, Coimbra University, Portugal
ABSTRACT: According with Axiomatic Design (AD) theory, the world of design is made up of four do-mains: the customer domain, the functional domain, the physical domain and the process domain. Therefore, to proceed in the design process, firstly, it’s necessary to determine the Customer’s Attributes (CAs), estab-lished in the Customer domain, and translate them into specific requirements, the Functional Requirements (FRs), formalized in the functional domain. This task is considered essential because a major reason for cus-tomer dissatisfaction is that the design specifications quite often do not adequately link to cuscus-tomer use of the product, a fact which is being pointed out as the most common cause for product design failures [1-2]. The European Customer Satisfaction Index (ECSI), as a Structural Equation Model (SEM), links customer satis-faction to its main drivers and consequences in terms of causal relationships. We will therefore introduce in this paper a new conceptual framework, aimed at addressing the development and validation of a model based on ECSI that supports the determination of the critical-to-satisfy (CTS) requirements, which are then used to determine the FRs. In order to validate the proposed approach, it was applied to the Portuguese plastic injec-tion moulds sector.
In our approach, firstly one has to identify who are the “keystone” customers by performing a Customer Value Chain Analysis (CVCA). Then, through semi-structured customer interviews and by gemba stud-ies, the spoken and unspoken demands are identi-fied. Afterwards, the data gathered are used to per-form the second phase of this framework. At this stage, a survey was developed in order to validate and generalize the findings, i.e., to confirm the cus-tomer needs identified by qualitative research, quan-tify the relative importance of needs, and, finally, to evaluate the factors that contribute towards the global satisfaction of customers. Therefore, the questionnaire was developed based on the European Customer Satisfaction Index (ECSI) model. The ECSI system is based on a structural model that monitors costumer satisfaction. The main goal of this index is to develop a methodology that allows for comparability and measures the quality of the economic output, as perceived by the market. Thus, this index is understood (at least indirectly) as an in-dicator of costumer assets in the market, and allows for the comparison between companies within the same sector, that operate in the same country, or at a macroeconomic level. Finally, the last task to per-form at this stage concerns building the House of Quality (HOQ), in order to translate the critical CAs identified into FRs.
2.1 European Customer Satisfaction Index (ECSI) Currently, Customer Satisfaction (CS) and their re-tention are key issues for organizations in today’s competitive market place. Therefore, CS evaluation has become a vital concern for companies and or-ganizations in order to improve product and service quality and maintain customers’ loyalty. It is indeed hard to define CS and even harder to measure it. CS must be considered as a latent construct that is not observed directly and can only be estimated through other indicators. Bearing this in mind, the European Commission, in conjunction with the European Or-ganization for Quality, the European Foundation for Quality Management and the Customer Satisfaction Index University Network, developed an initial CS SEM. This model is aimed at measuring and ex-plaining CS and customer loyalty, providing useful information for improving the performance of com-panies and serving as a benchmarking tool for the economies of different countries in Europe. The re-sult of this work was the development of the ECSI model as a tool to evaluate customer asset, which is regarded as an important intangible value for or-ganizations [4].
SEM techniques are based upon sets of linear equations used to specify phenomena in terms of their presumed cause-and-effect variables. Gener-ally, these models are established for variables, la-tent variables, which cannot be measured directly (as
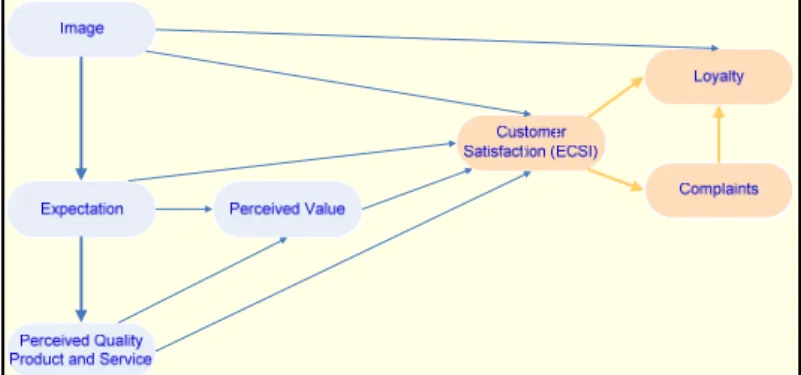
customer satisfaction) and are operationalised by multiple indicators. The hypothesized cause-effect relationships, between variables, are described by parameters that indicate the magnitude of the effect (direct or indirect) that independent variables (either observed or latent) have over dependent variables (either observed or latent). By enabling the transla-tion of these hypothesized relatransla-tionships into testable mathematical models, SEM offers researchers a comprehensive method for the quantification and testing of theoretical models. Once a theory has been proposed, it can then be tested against empirical data. The process of testing a proposed theoretical model is commonly referred to as the "confirmatory" phase of SEM. Another aspect of SEM is the so-called "exploratory" mode, which allows for theory development and often involves repeated applica-tions of the same data in order to explore potential relationships between variables of interest (either observed or latent). The ECSI model is based on a structural model with seven latent variables, which links CS to its main drivers (namely, company im-age, customer expectations, perceived quality and perceived value) and its main consequences (loyalty and complaints), in terms of casual relationships. The ECSI model adopted by Portugal measures the following dimensions, which can be observed in Figure 1 (www.ipq.pt/ecsi).
Figure 1. The ECSI Model adopted by Portugal.
As it is possible to see from the previous figure, customer satisfaction is the central variable of this model, having as antecedents or drivers the Image of the company, Customer Expectations, Perceived Quality of Products/Services and Perceived Value. The main consequences of customer satisfaction are Complaints and Customer Loyalty. As antecedents of customer satisfaction, one has Perceived Quality, which integrates product quality and service quality. Perceived Quality corresponds to the evaluation of recent consumption experiences of products (prod-uct quality) and experiences of associated services (service quality). Both types are expected to affect Satisfaction. Perceived Value is the perceived level of product quality and the price paid, which is ex-pected to have a direct impact over Satisfaction and to be positively affected by Perceived Quality.
Ex-pectations include the information that customers have acquired in the past, regarding products and services offered by the company. In this model, it is assumed that this variable has a direct impact over Satisfaction and gets an indirect impact through Per-ceived Value and PerPer-ceived Quality. Finally, the variable Image embraces the global idea that cus-tomers have from the product or company. It is ex-pected that Image will have a direct effect over Cus-tomer Satisfaction, Loyalty and Expectations. The consequences of consumer satisfaction considered in the ECSI model are Complaints and Loyalty. Com-plaints “measure” the comCom-plaints frequency and the manner in which the company manages these com-plaints. It is also assumed that Customer Satisfaction has a direct effect over this variable. Loyalty refers to customers’ loyalty to the product or company. It is expected that Image, Customer Satisfaction and Complaints have a direct impact on loyalty.
Technically, the full ECSI model integrates two sub-models, the structural model and the measure-ment model. The structural model includes the rela-tions between latent variables and is technically de-scribed as follows:
η βη γξ υ= + + (1)
where η is the vector of endogenous latent variables (which consists of six latent variables, such as Ex-pectations, Perceived Quality, Perceived Value, Cus-tomer Satisfaction, Loyalty and Complaints), and ξ is a vector of an exogenous latent variable (Image). The coefficients of the structural model, β and γ, give the direct impact on a latent variable when there is a unit change in an antecedent latent able. If the antecedent variable is an exogenous vari-able, the direct impact is represented by γ, while β represents the direct impact over endogenous vari-ables derived by a unit variation of another endoge-nous variable. The vector of specification residuals for the endogenous latent variables is represent by ν.
The measurement model defines the relations be-tween the latent variables and the observed indica-tors (or manifest variables). There are three possible types of measurement models: reflective models (or outwards directed models), formative models, and mixed models. A reflective model exists when the observed variables are assumed to be the reflex of the latent variables. In opposition, the formative model consists of a model where the observed ables are assumed to cause or form the latent vari-ables. The mixed model adopts both models, gener-ally the formative for the exogenous latent variables, while for the other latent variables, the reflective model is used. The ECSI model adopted by Portugal is based on a mixed model, where Image is meas-ured by indicators which are their cause.
The measurement models, when the model is con-sidered reflective, are technically described as fol-lows:
x
x= Λ +ξ δ (2)
y
y= Λ +η ε (3)
Where x and y are manifest vectors, respectively the exogenous and the endogenous ones. Λx and Λy are
the correspondent weight matrices (loadings) and, finally, δ and ε are measurement error vectors. This situation, where the manifests are reflections of the underlying latent variables, is typical for endoge-nous variables. If the model is considered formative, it will be more appropriate to specify when the latent variable is formed by the manifest variables, where one has for the exogenous variable ξ, the following equation: 1 l G l l x ξ ξ ξ λ δ = =
∑
+ (4) Where l ξλ are coefficients of the formative model and δξ are specification errors.
Based on the model described in Figure 1 and formally defined by previous equations, (2) to (4), standardized measurement instruments (question-naires) are developed for each industry covered by ECSI. The measurement scale is chosen to create enough variation in the data, in order to support a statistical analysis. Furthermore, equidistance be-tween values is crucial. There are also some advan-tages in choosing a measurement scale without a centred value. In summary, most national indexes within ECSI are based on a 10-point scale. Then, the customer satisfaction index and all other latent vari-ables are transferred to an index ordinary scale of 0 to 100, where 100 denotes the highest possible value.
2.2 The interlinking between ECSI and AD
Our main purpose in the ECSI application is to iden-tify the main drivers of customer satisfaction, which are Critical To Satisfy (CTS), in order to get cus-tomers’ loyalty. After this, it’s necessary to translate the requirements identified into FRs (customer map-ping). Yang et al. [5] suggested one approach for achieving this goal based on the Quality Function Deployment (QFD) methodology [6]. These authors proposed to perform the QFD phase 1, by mapping CAs to Critical-To-Satisfy (CTS) requirements, and then performe a QFD phase 2 by mapping CTS to FRs. Considering that our ECSI survey allows one to identify the main CAs and their relative impor-tance, the CTS requirements, our proposal reduces the exercise to the construction of only one QFD House (Figure 2). This house is used to display rela-tionship between the Critical CAs (CTS) and FRs.
Afterwards, the AD approach must be used to per-form the zigzag mapping between the FRs to the DPs (physical mapping) and to convert the DPs into PVs (process mapping).
Figure 2. Our conceptual framework approach.
3 CASE OF STUDY
In order to validate the proposed approach, this methodology was applied to a particular industrial sector, namely the Portuguese plastic injection moulds sector.
The design and manufacturing of metallic moulds for plastic parts injection is an interesting case study, because, typically, it involves constant design and production of unrepeatable moulds. This fact is es-pecially interesting because it involves, repeatedly, the placement of new and specific mould orders. In addition, the sector is strongly influenced by their customers. These customers are typically multina-tional corporations that place enormous pressures on lead times and cost reductions, while simultaneously demanding increased mould quality and reliability.
Moreover, Portugal is one of the world’s largest producers of advanced tools for plastic injection and blow moulding, supplying worldwide high-tech companies, namely in the automobile and electronic sectors. This industry is one of the most important sectors of the Portuguese industry. Its importance is not only explained by their contribution to the GDP, but also by the high volume of exportations. In 2004, exportation sales nearly reached 335 million euros, which represent 90% of the production of the Portu-guese industry of moulds (372 million euros).
Following the proposed framework, at the ex-ploratory stage, a few number of semi-structured in-terviews were conducted in Portuguese injection companies that order moulds from the national mould makers (illustrative sample). This interview was made of three parts. The first one concerns the identification of main customers’ requirements re-garding product quality. In addition, it includes an evaluation of the importance of the moulds’ quality for their own manufacturing processes.
The second part of the interview aims to perceive the customer needs and expectations regarding ser-vices provided. The last part of the interview intends
to know their perspectives of future evolution for the sector with the main objective of evaluating their real satisfaction and loyalty levels. Based on the in-formation gathered from the interviews, it was pos-sible to identify the factors (drivers) that might con-tribute towards perceived quality of product and service in order to get customer satisfaction. These factors are Quality of mould’s design, Quality of the moulds’ construction, Cooperation, Resources, Re-sponse Capacity and Contracts. Afterwards, and based on the ECSI model, standardised measurement instruments (questionnaires) were developed for the mould makers sector, with the generic questions that are given in Table 1.
Table 1. ECSI model adopted by Portugal. Latent
variables
Observed variables
Image
This mould maker is a reliable and trustworthy company This company is innovative and always looks ahead This company is a customer-oriented company This company has lots of experience in moulds produc-tion
This company is stable and well established
Expecta-tions
Overall quality of this company
Company’s capacity in offering moulds that answer to customer needs
Moulds makers’ reliability and provided service
Quality of the mould’s design
The capacity of the mould’s design meeting customer’s product requirements
The mould’s design capacity according to the customer’s specific injection process
Adequacy of constructive solutions
The company’s accessibility in discussing the mould’s design
The overall quality of the mould’s design Quality
of the moulds’ con-struction
Quality of the structural elements
Reliability of the adopted constructive solutions The adequacy of manufacturing processes (type, parame-ters and tools) to customer requirements
The overall quality of the mould’s construction
Coop-eration
The company’s accessibility in sharing responsibilities for the part’s quality
The following up of the mould performance during it’s life cycle
Company’s pro-activity in collaborating in solving prob-lems during the mould’s life cycle
Capacity for integrating complementary services
Re-sources
The technical staff’s know-how Level of it’s high-tech equipment Quality of the installations
Re-sponse capacity
Response capacity to the customer’s requirements Capacity in answering quickly to the customer’s needs and problems
Con-tracts
The company’s flexibility
The fulfilment of the conditions previously agreed
DP (top) DP2 DP1 DP21 DP22 1 st le ve l 2 nd le ve l Process Mapping FR (top) FR2 FR1 FR21 FR22 DP (top) DP2 DP1 DP21 DP22 1 st le v e l 2 nd le ve l Physical Mapping PV (top) PV2 PV1 PV21 PV22
Per-ceived value
Quality of product/service given the price paid Prices of product/service given the mould’s quality
Cus-tomer Satisfac-tion
Overall satisfaction with the company’s products and service
Considering customer expectations, to what extent have the company fulfilled them
How close is the company to customer ideal provider
Com-plaints
How many times have things gone wrong Identify who have complained
How well was the last complaint handled
Loyalty
How likely will you order from this company a new mould
Recommend this company to others Sensibility to price changes
Usually, the data for model estimation is obtained from data collected through telephone interviews from a national representative sample of customers who have recently acquired specific products or ser-vices. In this project, during the Spring of 2007, data will be collected for a first estimation of this model for the Portuguese mould makers sector. Data col-lection will be performed in two different ways: (1) by having Portuguese moulds makers send this sur-vey to their customers; (2) by sending it directly to Portuguese and Spanish injection companies (mould makers’ customers).
According to the ECSI framework, our entire model is estimated using Partial Least Squares (PLS) criteria. This recommendation is based on the argument that other widely employed frameworks used to estimate SEM make more strict assumptions about the data, specifically about normality [7]. Therefore, traditional estimation methods, like Maximum Likelihood (ML), are not recommended, since the probability density functions of the meas-ured variables are not generally symmetrical, even if one adopts a scale of 1 to 10, and the values of the measured variables are likely to be highly correlated. The PLS algorithms comprise iterative procedures that generate estimates of the observations of the la-tent variables, the so-called case-values or scores, so that they fit into both the structure of the latent vari-ables and the measurement system. Various versions of the PLS algorithm have been suggested. They mainly differ in the way the case-values are fitted into the structure of the latent variables. Therefore, the latent variables are calculated as weighted aver-ages of their measured variables, and the PLS esti-mation method calculates the weights in such a way that the resulting model has maximum explanatory power.
4 CONCLUSIONS
This paper proposes a new conceptual framework to be performed as the first stage of the design process. According to Suh, to design a product or a service, firstly it’s necessary to perform the customer map-ping stage. Even so, the AD theory doesn’t comprise special references to the ways in which this should be carried out. And, as opposed to what was pro-posed for physical and process mapping, it’s often impossible to hierarchically map the CAs and the FRs by following a zigzagging process. Moreover, customer requirements of new products are usually inconceivable and hard to acquire accurately and completely. Therefore, our approach aims to fill the knowledge gap between customers and designers, as a way of converting customer requirements into a successful design. In order to validate our proposal, it was applied to the mould’s maker Portuguese sec-tor. Hence, firstly an exploratory study was carried out. In this stage, semi-structured interviews were conducted to a few number of injection companies, which are customers of Portuguese moulds’ makers. Based on the information gathered, one self-administered questionnaire, based on the ECSI model, was developed in order to determine the CTS requirements. Finally, the CTS requirements identi-fied will then be translated into FRs, by carrying out the construction of one QFD House of Quality. After that, the AD approach will follow by mapping the FRs into DPs, and the DPs into PVs, in a hierarchi-cal manner.
REFERENCES
[1] Chao L. P & Ishii K. 2004. Design process error-profing project quality function deployment. ASME Design
Engineer-ing Technical Conferences: 1-10
[2] Rose C. M., Beiter K. A. & Ishii K. 1999. Determining end-of-life strategies as a part of product definition. IEEE
In-ternational Symposium on Electronics and the environment: 219-224
[3] Suh, N.P. 1990. The principles of design. Oxford Univer-sity
[4] Vilares M. J., Almeida M. H & Coelho P. S.. 2005. Com-parison of likelihood and PLS Estimators for Structural Equa-tion Modeling. A simulaEqua-tion with Customer SatisfacEqua-tion Data
4th International Symposium on PLS and related methods
[5] Yang, K. & El-Haik B. 2003. Design for Six Sigma: A
roadmap for product development., McGraw-Hill.
[6] Griffin, A. & Hauser , J. R. 1993. The Voice of the Cus-tomer. Marketing Science 12(1): 1-27.
[7] O' Loughlin C. & Coenders G. 2004. Estimation of the European Customer Satisfaction Index: Maximum Likelihood versus Partial Least Squares. Application to postal services.