UNIVERSIDADE DO ALGARVE
Faculdade de Ciências do Mar e do Ambiente
Effects of the Goitrogenic Compounds Methimazole, Thiourea and Propylthiouracil on the Fish Thyroid Axis, in vivo: The Sea Bream (Sparus auratus) Model
Manuel Alejandro Pinzón Olejua
FARO
2007
UNIVERSIDADE DO ALGARVE
Faculdade de Ciências do Mar e do Ambiente
Effects of the Goitrogenic Compounds Methimazole, Thiourea and Propylthiouracil on the Fish Thyroid Axis, in vivo: The Sea Bream (Sparus auratus) Model
Master’s degree in Marine Biology and Biotechnology
Supervisor: Professor Dr. Adelino Canário Co-Supervisor: Dr. Patrícia Isabel Pinto
Manuel Alejandro Pinzón Olejua
FARO
Acknowledgments
I sincerely want to express my gratitude to Professor Dr. Deborah Power, Dr. Isabel Morgado and Dr. Patricia Pinto for guide me along this thesis, giving his advice and introducing me into the different techniques employed in this thesis. I want to acknowledge in particular to Professor Dr. Adelino Canário for receive me in the molecular and comparative endocrinology group, where this thesis was developed. I also want to acknowledge to:
• Eng. Nadia Silva • Dr. Marco Campinho
• Comparative and molecular endocrinology group, especially to Nuno for his friendly
company during this thesis and along these years.
Special thanks to Constanza, Georg, Bernarda and Manuel for giving me their unconditional support and to my lovely friends Fabian, Cesar and Sergio.
I also want to express my gratitude to Diogo, Tiago and Ricardo for their company and for all those interesting and funny moments.
NOME: Manuel Alejandro Pinzón Olejua FACULDADE: Ciências do Mar e do Ambiente
ORIENTADOR: Professor Adelino Canário, Universidade do Algarve CO-ORIENTADOR: Dr. Patricia Isabel Silvestre Pinto, Universidade do Algarve
DATA: Outubro 2007
Effects of the Goitrogenic Compounds Methimazole, Thiourea and Propylthiouracil on the Fish Thyroid Axis, in vivo: The Sea Bream (Sparus auratus) Model
RESUMO
Goitrogens são compostos naturais ou sintéticos que podem afectar o funcionamento da tiróide e inibir a produção das hormonas da tiróide. Methimazole (MMI), propylthiouracil (PTU) e thiourea, são utilizados no tratamento clínico do hipertiroidismo em humanos e mecanismo de acção destes compostos em mamíferos é relativamente bem conhecido. Em peixes estes compostos têm sido utilizados com o objectivo de induzir hipotiroidismo, assumindo que o sistema da tiróide trabalha da mesma forma. No entanto a acção destes compostos em peixes não tem sido suficientemente estudada e os efeitos observados muitas vezes diferem com os efeitos observados em mamíferos. Neste contexto, o objectivo do presente estudo foi investigar o efeito de compostos goitrogénicos em diferentes componentes do eixo da tiróide em sea bream, um peixe teleosteo, e analisar se estes compostos podem bloquear a produção das hormonas da tiróide. Juvenis (~50 g BW) foram tratados durante 21 dias com MMI, PTU e thiourea (1mg/kg dia – através da alimentação). Os níveis das hormonas da tiróide (T3 e T4) no plasma foram medidos por radioimunoensaio, as alterações no tecido da tiróide foram observadas e o nível de expressão de um grupo de genes envolvido na produção das hormonas da tiróide (TR,TSH,TTR e Deiodinases) foi quantificado por qPCR na pituitária, fígado e rim. Unicamente MMI diminuiu a produção das hormonas da tiróide significativamente (p<0,05), principalmente T4. O aspecto histológico do tecido da tiróide neste grupo foi indicativo de um aumento na actividade dos folículos, tendo sido drasticamente diferente dos do grupo controlo ou do grupo tratado com PTU ou thiourea. O tratamento com PTU não bloqueou a produção das hormonas, no entanto também desenvolveu tirócitos hiperplásticos e hipertrofiados, no entanto em menor intensidade do que MMI. A expressão relativa de DI e DII no tratamento com MMI foi aumentada no fígado ao mesmo tempo que o hipotiroidismo foi induzido, no entanto a expressão de DI no rim não foi alterada. MMI também diminuiu a expressão do receptor beta das hormonas da tiróide em paralelo à diminuição dos níveis das hormonas no plasma, mas não foram observadas diferenças significativas na concentração de TTR no plasma ou a sua expressão no fígado (p<0,05). Os resultados obtidos demonstram que em sea bream MMI parece actuar da mesma forma do que nos mamíferos, provavelmente pela inibição da capacidade das thyoperoxidases de activar o iodo a transferi-lo a tiroglobulína. A alteração na expressão das deiodinases esta de acordo com a ideia de que sea bream em comum com outros teleosteos o principal mecanismo de controlo da função da tiróide é a deiodinaçao periferal, independentemente do eixo hipotalamo-pituitaria-tiroide.
ABSTRACT
Goitrogens are natural or synthetic compounds that suppress the function of the thyroid gland and inhibit the production of thyroid hormones (TH). Methimazole (MMI), propylthiouracil (PTU) and thiourea are used in the clinical treatment of human hyperthyroidism. Their mechanism of action in mammals is relatively well explained and such compounds have been employed in previous studies with fish to induce hypothyroidism, based upon the assumption that they work in the same way. However the action of such compounds in fish is not well studied and the effects are not always consistent with those obtained in mammals. In this context the main objective of the present study was to investigate the effects of goitrogenic compounds in the teleost fish, sea bream and analyze whether these compounds can depress TH production and determine how they influence different components of the thyroid axis in fish. Juvenile fish (~50 g BW) were treated for a period of 21 days with the goitrogens, MMI, PTU and thiourea (1mg/kg day through the food). Assessment of the impact of goitrogens on the central control of the thyroid cascade was assessed by histological investigation of thyroid follicles and thyroid stimulant hormone gene expression in the pituitary by qPCR, in addition to measurements of plasma thyroxine (T4) levels by radioimmunoassay. The effect of goitrogens on peripheral control was assessed by thyronine (T3) measurements in plasma and by determining deiodinase gene expression in the pituitary, liver and kidney. TH transport was also analysed by measuring transthyretin (TTR) plasma levels by Western blot and gene expression in liver with a specific quantitative PCR reaction. Only MMI significantly depressed TH production (p<0.05), especially T4. Histological appearance of the thyroid tissue in this group was indicative of increased thyroid follicle activity and was substantially different from control fish or those treated with PTU or thiourea. In MMI treated fish most of the thyroid follicles were collapsed and contained little colloid which was full of vacuoles and intracellular colloid droplets were evident in the thyrocytes. PTU treatment did not disrupt TH production, however also induced hyperplasia and hypertrophy of the thyrocytes, although it was less marked than that seen in MMI treatment. The relative expression of DI and DII in MMI treated fish was increased in the liver in parallel with the induced hypothyroidism. In contrast to the situation in the liver DI in the kidney is unresponsive to changes in the thyroid status in sea bream. MMI also decreased expression of the thyroid hormone receptor beta (TRβ) in the pituitary parallel to TH depletion, but no significant differences were found in the concentration of plasma TTR or hepatic gene expression (p> 0.05). These data demonstrate that in sea bream MMI seems to function in the same manner as reported in mammals, probably by inhibiting thyoperoxidases ability to activate iodine and transfer it to thyroglobulin. The alterations in deiodinase expression fits well with the general notion that in the sea bream in common with other teleosts peripheral deiodination is the primary control mechanism of thyroid function, independent of the hypothalamus-pituitary-thyroid axis.
TABLE OF CONTENTS
I. General Introduction
1. Endocrine system 1
2. Thyroid hormones – thyroxine (T4) and triiodothyronine (T3) 2
3. Thyroid axis 2
4. Thyroid hormone receptors 5
5. TH activation and degradation 6
6. Thyroid dysfunction 7
7. Goitrogens 8
8. Thyroid axis in fish 10
9. Objective 11
10. The experimental model – Sea bream 12
II. Methods
1. Animal and experiment conditions 17
2. Administration of goitrogenic compounds 17
3. Tissue sampling 18
4. Histological procedure 18
5. Biochemical analysis 19
5.1 Total protein in plasma 19
5.2 Western blot of transthyretin in plasma 20
5.2.1 SDS-PAGE 20
5.2.2 Immunoblotting and detection by chemiluminescence 21
5.3 Radioimnunoassay for T4 and T3 22
5.3.1 RIA overview 22
5.3.2 T3 and T4 RIA conditions 24
6. Molecular analyses 25
6.1 RNA extraction 25
6.2 Complementary DNA (cDNA) synthesis 25
6.3 Polymerase chain reaction (PCR) 26
6.3.1 Overview 26
6.3.2 Amplification of the internal control 18S to evaluate cDNA sample
concentration and quality 26
6.4 Real-time quantitative PCR 27 6.4.1 q-PCR overview 27 6.4.2 RT-qPCR optimization 31 6.4.3 RT-qPCR conditions 32 7. Statistical analyses 32 III. Results 1. Biochemical results 35
1.1 TTR and total serum proteins 35
1.2 Thyroid hormone concentration 36
3. Molecular results 39
3.1 Quality of mRNA and cDNA synthesis 39
3.2 Real-time qPCR optimization 40
3.3 Gene expression 41
3.3.1 Quantification of target transcripts in liver, pituitary
and kidney of the control fish 41
3.3.2 Quantification of target transcripts in liver, pituitary
and kidney of the control and experimental fish 42
IV. Discussion, conclusions and future perspectives 47
V. References 59
VI. Appendix 65
I. Identification of clones obtained by Suppression Subtractive Hybridization 67
LIST OF ABREVIATIONS
18S 18S ribosomal RNA
ALB Albumin
ANOVA Analysis of variance
bp Base pairs
BSA Bovine serum albumin
cAMP Cyclic adenosine monophosphate
cDNA Complementary DNA
DBD DNA-binding domain
DEPC Diethylpyrocarbonate
DIT Diiodotyrosine
DNA Deoxyribonucleic acid
DNase Deoxyribonuclease
dNTP Deoxynucleotide triphosphate
DTT Dithiothreitol
EDTA Ethylenediaminetetraacetic acid
ELISA Enzyme-linked immunosorbent assay
HSA Human serum albumin
HPLC High performance liquid chromatography IPTG Isopropyl-beta-D-thiogalactopyranoside
IRD Inner-ring deiodination
Kb Kilo bases
kDa Kilo Dalton
MIT Monoiodeotyrosine
MMI Methimazole
MMLV-RT Mouse Moloney murine leukemia virus reverse transcriptase mRNA Messenger ribonucleic acid
MW Molecular weight
ORD Outer-ring deiodination
PCR Polymerase chain reaction
Poly(A) Polyadenylated RNA (mRNA)
qPCR Real Time quantitative PCR
PTU Propilthyouracil
RIA Radioimmunoassay
RNA Ribonucleic acid
RNase Ribonuclease
rpm Rotations per minute
RT-PCR Reverse transcriptase-polymerase chain reaction
sbTTR Sea bream TTR
SDS-PAGE Sodium dodecyl sulphate - polyacrylamide gel electrophoresis
SE Standard error T3 Triiodothyronine T4 Thyroxine TBG Thyroxine-binding globulin TG Thyroglobulin TH Thyroid hormones
THBP Thyroid hormone binding protein
TPO Thyroid peroxidas
TR Thyroid hormone receptors
TRE Thyroid hormone response elements
TRH Thyrotropin-releasing-hormone
TSH Thyrotropin-stimulating-hormone
TTR Transthyretin
Thesis context
In the mean time that the principal study that gives name to this thesis was written, another work was developed aiming to update the annotation of the sequenced sea bream E2-treated testis subtractive library clones from a previous study (Pinto et al., 2006). Annotation of clones was ensured by sequence comparison with the annotated EST libraries from sea bream and sea (MGE-Expressed-sequence-taq (EST) Libraries) or by identity searches with updated public databases. The results of this analysis are described in appendix -1. However, this thesis will focus principally in the effect of goitrogenic compounds in the sea bream thyroid axis.
The components of the thyroid axis appear to be the same in most vertebrates, and consist of a stimulating factor in the pituitary gland, thyroid stimulating hormone (TSH), thyroid hormones (T4 and T3), thyroid hormone-binding proteins (THBP), deiodinases and nuclear receptors. However, detailed information about the regulation and function of the components of the axis is still lacking in detail in fish (Power et al., 2001). Before the 1960s fish endocrinology was centered on histophysiological studies and the study of hormone physiology and their chemical nature were relatively rare, largely as a consequence of the lack of methods with which to study such aspects. Later, technological advances applied to endocrinology, like the availability of pure hormone, production of antibodies and specific highly sensitive radioimmunoassay for both T3 and T4 led to important advances in understanding thyroid hormones secretion and metabolism (Power et al., 2001). The induction of hypothyroidism has been employed as a tool in studies focusing on the role of factors involved in the thyroid axis in fish, from thyroid hormones synthesis to thyroid hormones action. In the 1990s, the emergence of molecular technologies applied to endocrine studies changed perceptions about hormone and receptor structures, hormone-receptor interactions and signal transduction, and resulted in the case of the thyroid hormone axis, in the identification and characterization of thyroid hormone receptors (TRs) and deiodinase enzymes in a
number of teleost fish species (Eales et al., 1993a; Bates et al., 1999; Mol et al., 1999). The effects of hormones are suggested to be proportional to their concentration in the circulation (Dorit et al., 1991), and an imbalance leads to endocrine disorders as a result of hypo or hyperthyroidism.
This thesis gives an overview of the thyroid hormone axis in fish, focused on biochemical, morphological and molecular levels. The effect of antithyroid compounds used to treat human diseases and hormonal dysfunction were tested on the fish thyroid axis in vivo using the teleost, Sea bream (Sparus auratus) as the experimental model. Anti-thyroid compounds have been used in previous studies with fish to induce hypothyroidism, and this is based upon theassumption that the thyroid axis works in the same way in fish as in mammals. However the results of studies of anti-thyroid agents in fish are inconclusive and not consistent with the results of similar studies in mammals. For this reason in the present study, anti-thyroid agents were administered and their effect on a range of different elements of the thyroid axis determined.
The level of thyroid hormones T3 and T4 on plasma were measured by RIA, the histological alterations in thyroid tissue were determined and the level of expression of a number of genes involved in TH production (TR, TSH, TTR and deiodinases) were quantified by quantitive real time RT- PCR (qPCR) in pituitary, liver and kidney. The present introduction will describes the conventional view of the thyroid axis, derived from mammals, and will then focus fish thyroid axis in vivo on the state-of-the-Art in teleosts, and finally overview what is known about the effect of anti-thyroid compounds like Thiourea, Methimazole (MMI) and Propylthiouracil (PTU).
General introduction
1
1. Endocrine system
As animals became larger and more complex a communication network evolved to allow cells in distant parts of the body to communicate. This network consists of the nervous system and the endocrine system which produces a variety of chemical messengers able to modulate long-term processes, which simultaneously affect many parts of the body (Dorit et al., 1991). Such chemical messengers have been grouped together and classified as hormones and are characterized by the fact that they are synthesized by specialized tissues or endocrine glands localized in specific site of the body. Endocrinology is the study of mechanisms of communication by hormones and their function.
Unlike exocrine glands, endocrine glands secrete their product directly into the blood stream, other body fluids or by diffusion between cells, rather than through a duct. The latter hormones can be produced in other tissues not specialized for hormone production, and may act in a distant organ in the body (endocrine action), locally in the same cell type which produced it (autocrine) or in neighbouring cells of a different type (paracrine) (Bentley, 1998). Hormones have traditionally been classified into four structural categories: amines, prostaglandins, steroid hormones or peptides and proteins hormones (Randall et al., 1997), or classified as: lipid soluble and lipid insoluble. Recently, a number of novel endocrine factors have been identified, such as, nitrous oxide which do not fit into the conventional classification. Hormones are synthesized by the cell and stored in membrane-bound vesicles or granules, which are released by exocytose under appropriate stimulation. Lipid insoluble hormones are secreted directly into aqueous body fluids while lipid soluble hormones generally bind to carrier proteins (Dorit et al., 1991). Secretory activities of most endocrine tissues are subject to both positive and negative feedback control and in this way the hormone regulates its own production and secretion.
The specific effects of hormones on their target tissue and their primary intracellular mode of action are achieved by their interaction with receptor proteins located in the plasma membrane or inside the cell or in the nucleus (Bentley, 1998). Lipid-insoluble hormones tend to bind to cell-surface receptors, triggering an intracellular pathway that may involve a second messenger, which in turn combines with another molecule to produce an active complex, while lipid-soluble hormones mainly combine with intracellular receptor proteins forming active complexes that modulate gene expression. The thyroid hormones, the
General introduction
2
subject of the present thesis, are lipophilic and tend to circulate bound to proteins (THBP) and bring about their action by binding to nuclear receptors (TRs) (Yamano, 2005).
2. Thyroid hormones – thyroxine (T4) and triiodothyronine (T3)
Thyroid hormones (TH) are iodinated thyronines (Fig.1), present in all vertebrates (McNabb, 1992) which alone, or through interaction with other hormones and growth factors can influence intermediary metabolism, and also growth and development [7, 8]. Those hormones affect virtually every metabolic activity in the body, including the concentration and functionality of numerous enzymes, all aspects of the metabolism of fats, carbohydrates, protein, vitamins, secretion and breakdown of other hormones, as well as the response of tissues to other hormones. In higher vertebrates, THs specifically regulate basal metabolism (Zhang and Lazar, 2000; Yamano, 2005) and are key controllers of obligatory heat production in homeothermic vertebrates (Dorit et al., 1991). However, the function of THs in ectothermic vertebrates its not fully understood. In ectothermic vertebrates the best known feature of these hormone is probably their role as a metamorphosis inducing hormone in amphibians (Leloup and Buscaglia, 1977; Yamano, 2005). Information about the role of THs in fish development, mainly teleosts, has been accumulated in the last two decades. A positive correlation has been found between thyroid and reproductive status, and high levels of maternal THs has been found in eggs (Power et al., 2001). Due to these observations, THs are thought to play a key role in development and larva-juvenile transition (Power et al., 2001; Yamano, 2005).
3. Thyroid axis
In fish, the recognition of a tissue comparable to the thyroid gland in mammals was made in the mid/late 19th century, and the ubiquitous presence of thyroid tissue in all vertebrates became widely accepted (Leatherland, 1993). However, much of the actual knowledge concerning thyroid hormone synthesis and secretion has been derived from mammalian thyroid models. The broad steps of these models involves 1) iodine availability and absorption, 2) uptake of iodide by the thyroid tissue, 3) oxidation of iodide to transform it into active iodide, 4) thyroglobulin (TG) iodination and thyroid hormones formation, 5) storage of thyroid hormones in a TG-bound form, 6) hormone release, 7) THs transport to
General introduction
3 target tissues and 8) cellular uptake of thyroid hormones. The control of synthesis and secretion of THs in the thyroid is regulated by stimulating hormones produced in the hypothalamus (thyrotropin releasing hormone, (TRH)) and pituitary thyroid stimulant hormone (TSH). Many factors intervene in the various steps outlined in 1-8 above, such as thyroperoxidases and deiodinating enzymes; serum transport proteins (transthyretin (TTR), thyroxine binding globulin (TBG) and albumin); and TRs.
The thyroid gland consists of functioning units called follicles, which comprise a single layer of polarized cells surrounding an internal compartment, the follicle lumen. The specialized function of these cells is to produce a high molecular weight protein called thyroglobulin (TG) and concentrate iodide within the cell. TG contains many tyrosines in its sequence which are iodinated by enzymes called thyroperoxidases (TPO). The former enzyme reacts first with hydrogen peroxide (H2O2), forming an oxidized enzyme that oxidizes iodide to an “active iodide” which is transferable to tyrosyl residues on TG. Additional enzyme-catalyzed reactions convert the iodinated tyrosines into monoiodotyrosine (MIT) and diiodotyrosine (DIT) and later the biologically active hormones, tetraiodothyronine (T4) and triiodothyronine (T3). The chemically modified TG molecules are extruded into the lumen and stored there as colloid. Iodide is an indispensable component and comprises 65% and 58% of the THs (T4 and T3), respectively. T4 is the predominant hormone secreted from the thyroid tissue and is converted into the biologically active form T3 by deiodination (McNabb, 1995). Over 80% of circulating T3 is produced outside the thyroid gland by peripheral conversion of T4 into T3 (http://www.thyroidmanager.org/).
Figure. 1 - The chemical structure of thyroid hormones (TH) : 3,5,3´,5´-tetra-iodo-L-thyronine (Thyroxine, T4); 3,5,3´-tri-iodo-L-thyronine (T3)
General introduction
4
In the general thyroid axis model, TH levels are regulated by a feedback inhibition mechanism (Fig.2) (Leatherland, 1994). In this model, the hypothalamus secrets TRH, which promotes pituitary secretions of TSH, produced by pituitary thyrotrophs. TSH in turn is necessary to stimulate the thyroid to produce and release THs. Circulatory levels of THs and TSH modulate TRH production by the hypothalamus, and the interplay of these molecules maintain circulating THs homeostasis. THs levels also influence TSH production by the pituitary and represents a further regulatory mechanism.
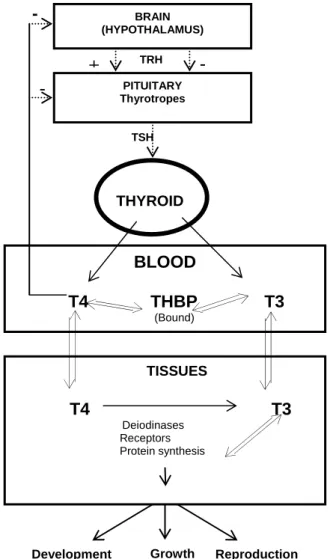
Figure 2 -General thyroid model. Thyroidal secretion of T4 and T3 is regulated by Thyroid stimulating hormone (TSH) produced by thyrotropic cells in the pituitary, controlled by positive and negative pathways from the hypothalamus. T4 and T3 in blood are mainly bound to plasma proteins (THBP), but the small free fraction exchanges tissues and can be enzymatically deiodinated by deiodinase to T3 which exchanges with blood or binds to receptors to modify specific protein synthesis and initiate biological action. T3 and T4 can also feed back to the brain and pituitary and inhibit TSH secretion. (from Eales and Brown, 1993)
-+ THYROID TSH TRH BRAIN (HYPOTHALAMUS) PITUITARY Thyrotropes BLOOD T4 THBP T3 (Bound) TISSUES T4 T3 Deiodinases Receptors Protein synthesis
General introduction
5 Upon release into circulation nearly 99 % of T4 and T3 binds to THBP, and only a minor fraction is present in the free form in blood. Only the free hormone fraction is able to enter cells and THBP influence the rate at which the THs reach their targets and therefore their specific responses (http://www.thyroidmanager.org/). Because thyroid hormones are highly lipophilic they can easily diffuse into cells and to counteract such diffusion binding to transport proteins is essential and helps to maintain free hormone levels in balance. In larger mammals, THBP include Thyroxin-binding-globulin, transthyretin (TTR) and albumin. Besides ensuring an even distribution of THs into tissues THBP are also thought to promote their uptake at the cell membrane. Until recently it was assumed that crossing the plasma membrane of cells was a matter of simple diffusion (Robbins and Rall, 1960; Mendel, 1989). However, during the last two decades it has become apparent that THs are transported into cells by specific carrier-mediated uptake mechanisms (Divino and Schussler, 1990; Vieira et al., 1995; Hennemann et al., 2001).
After entery into cells, THs exert their action by binding to nuclear receptors that have higher affinity for T3, TRs binding induces and sometimes represses gene expression.
4. Thyroid hormone receptors
Thyroid hormone receptors (TRs) are members of the steroid-thyroid receptor super family that also includes receptors for ligands such as steroid hormones, retinoids, melatonin and vitamin D3 (Power et al., 2001). In the past few years, great progress in biochemical, functional, and structural studies has clarified the molecular mechanism of TR action. Two classes of TRs, α and β, are coded by different genes, and numerous variants exist within the two classes of receptors (Lazar, 1993). Alternative splicing of TRα or TR β generates multiple TR isoforms, and they are classified as TRα1, TRα2, and TRα3 and TRβ1 and TRβ2 (Lazar, 1993; Zhang and Lazar, 2000).
TRs function as transcription factors and directly regulate target gene expression through DNA response elements. Ligand binding triggers a conformational change in the TR, resulting in activation of the target gene (Zhang and Lazar, 2000). Although TRs can bind to thyroid response elements (TRE) on target genes as monomers or homodimers, the majority of TR is bound to TREs as a heterodimer with retinoid X receptor (Lazar, 1993).
General introduction
6
TRs are not cytoplasmically anchored to proteins and bind to TREs even in the absence of hormone and generally repress basal transcription (Lazar, 1993).
The occupancy of nuclear receptors depends on the intracellular concentration of T3, which is influenced by factors such as cellular TH uptake and TH metabolism (Morgado et al., 2007a). The pathway for TH activation/inactivation is deiodination, a process through which T4 or T3 loses iodine units in a stepwise matter.
5. TH activation and degradation
In vertebrates, THs may be processed by deiodinating enzymes (deiodinases) into more active or inactive iodothyronines. Deiodinases are rare proteins as they contain a selenocysteine in their amino acid sequence and for this reason are classified as selenoproteins (Sutija and Joss, 2006). The chemical characteristics of the selenocysteine selenol group compared to a cysteine thiol group are their greater reactivity towards nucleophilic substrates and ionization at physiological pH.
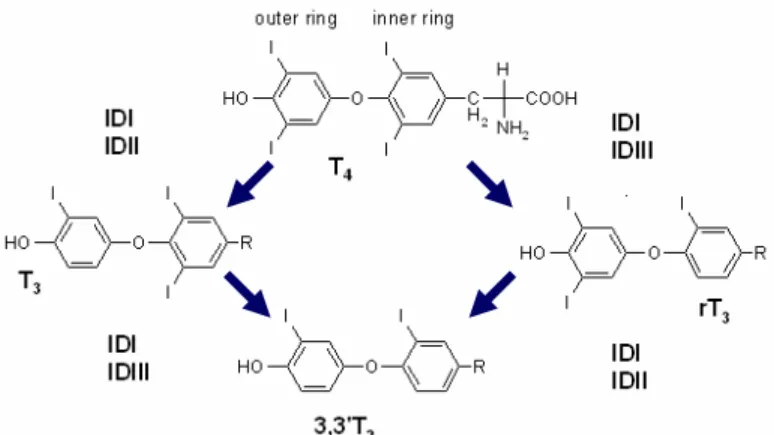
Deiodinases catalyze the removal of one iodide unit from THs at the cellular level (Sutija and Joss, 2006) and as a result other less iodinated thyronines derived from T4 can be found in circulation. The removal of one iodide from the outer benzene ring of THs is referred to as outer ring deiodination (ORD) and the removal of one iodide from the inner ring is referred to as inner ring deiodination (IRD). ORD of T4 gives rise to active T3, while T4 IRD originates an inactive form of T3 (reverse T3 or rT3). T3 and rT3 can be further deiodinated to T2, T1 and T0 (thyronine). Such deiodination pathways are selectively performed by three types of deiodinases (DI, DII, and DIII) (fig. 3), which varies in substrate preference, affinity and also in tissue localization. Deiodinase DI can catalyze both inner and outer ring deiodination of T4, producing both active (T3) and inactive (rT3, T2) and inactive thyronines. DII can only deiodinate the outer ring, being the major activating hormone, in contrast DIII can only deiodinate the inner ring, being the major inactivating enzyme (Sutija and Joss, 2006).
In mammals DI is present in the liver, kidney, muscle, pituitary and thyroid gland; DII is present in the brain and lesser quantities are present in the pituitary, heart, muscle, thyroid and testis; and DIII is commonly found in the brain, skin, placenta and fetal tissue (Bates et al., 1999).
General introduction
7 Figure 3 - Thyroid hormone deiodination pathways and Deiodinases. Deiodinase DI can catalyze both inner and outer ring deiodination of T4, producing both active (T3) and inactive (rT3, T2) and inactive thyronines. DII can only deiodinate the outer ring, being the major activating hormone. DIII can only deiodinate the inner ring, being the major inactivating enzyme (from Sutija and Joss, 2005)
6. Thyroid dysfunction
THs are essential for many basic life metabolic events and therefore adequate thyroid function is crucial for normal growth, development and healthy state. Abnormal production of THs can disturb normal THs levels (euthyroidism) leading to disease conditions like Hyperthyroidism (high THs levels) and Hypothyroidism (low THs levels). Hyperthyroidism increases the metabolic rate leading to weight loss, nervous system alterations and associated complications, etc. Hypothyroidism is associated with a lowering of metabolic rate and several associated complications (Dorit et al., 1991). In order to overcome low TH levels, the thyroid gland is stimulated by TSH to increase TH production. Associated with overstimulation of the thyroid tissue by TSH is enlargement of the thyroid gland (hyperplasia) as a consequence of increased follicular cell division and size and in extreme situations there is goiter formation (Leatherland, 1994). Hypothyroidism can be clinically treated by administration of synthetic THs. In contrast, hyperthyroidism is commonly treated by administration of synthetic antithyroid drugs, which inhibit TH synthesis. However anti-thyroid compounds can also occur naturally in some foods and exposure to them can disrupt normal thyroid function leading to goiter formation, such compounds are known as goitrogens (http://www.thyroidmanager.org/, ; Tan, 2005).
General introduction
8
7. Goitrogens
Goitrogenic compounds have been divided into agents acting directly on the thyroid gland and those causing goiter by indirect action. The former group is subdivided into those inhibiting transport of iodide into the thyroid, those acting on intrathyroidal oxidation and the organic binding process of iodide and the coupling reaction of MIT and DIT, and those interfering with proteolysis, dehalogenation and hormone release. The discovery that certain drugs such as thiourea and related compounds caused hyperplasia of the thyroid when administrated to rats lead to the introduction of the thionamide series of antithyroid drugs, which are used in clinical hyperthyroidism treatment. According to their principal mode of action on iodine metabolism in the thyroid, anti-thyroid drugs are divided into two categories (http://www.thyroidmanager.org/): 1) the monovalent anions, which inhibit iodide transport into the thyroid gland, and 2) compounds that act through inhibition of thyroidal iodide binding and iodotyrosine coupling (eg. thionamides). The effect of the drugs in the first category is counteracted by exposure to excess iodide, and at times even potentiates the action of drugs in the second category. The thionamide and thiourylene drugs do not prevent transport of iodide into the thyroid gland but impair covalent binding of iodide to TG. They may be competitive substrates for thyroid iodide peroxidase, preventing the peroxidation of iodide by this enzyme (Fig4).
Figure 4 - TG is secreted and stored in the follicular lumen after its iodination at the apical plasma membrane-follicle lumen boundary. Via a reaction with the enzyme thyroperoxidase (TPO), iodine is covalently bound to tyrosine residues in the thyroglobulin molecule, forming monoiodotyrosine (MIT) and diiodotyrosine (DIT). (from www.thyroidmanager.org)
General introduction
9 The thioreylene drugs (Fig 5), PTU, MMI and thiouracil, can inhibit thyroid peroxidases TPO´s ability to activate iodine and transfer it to TG (Davison et al., 1978). However these drugs act by different mechanisms. PTU interacts with the activated iodine producing a reversible inhibition of TPO. MMI interacts directly with the TPO enzyme and inhibits it irreversibly (Crane et al., 2006). PTU is a methylmercaptomidazole which reduces circulating levels of T4 and T3 and increases circulating levels of TSH. PTU is generally believed to produce deleterious effects in animals by causing a dose dependent reduction in circulating levels of thyroid hormone, caused by the ability of PTU to directly inhibit the function of the thyroperoxidases enzymes. PTU and MMI partially inhibit the peripheral deiodination of T4 and in this way its biological action (van der Ven et al., 2006). These drugs are accumulated by the thyroid and degraded at this site, since they are substrates of the peroxidases (http://www.thyroidmanager.org/).
Figure 5 - Chemical structure of the Thyroperoxidases inhibitors, methimazole (MMI), Propylthiouracil (PTU) and Thiourea. A thiocarbamide group is responsible for goitrogenic activity in MMI and 6-n-propyl-2-thiouracil (Elsalini and Rohr, 2003).
A number of researchers have employed those compounds in order to disrupt the thyroid axis and investigated the metabolism and role of THs activity in fish reproduction, embryogenesis, larval development, growth etc. (Mol et al., 1999; Manzon et al., 2001; Matta et al., 2002; Crane et al., 2006; Swapna et al., 2006; van der Ven et al., 2006). However, the effectiveness as antithyroid agents and depletion of THs was not consistent. Different responses in T3 and T4 levels were observed between different species and state of development. Is believed that such compounds have a concentration-dependent effect (van der Ven et al., 2006). However, until now no standardized method had been validated to assess thyroid disruption in fish.
General introduction
10
8. Thyroid axis in fish
The majority of research about the hypothalamus-pituitary-thyroid axis in fish has been focused on teleosts. Thyroid structure and function in teleosts resembles that of other vertebrates in relation to follicular organisation and primary hormones secreted (Iodine containing L-thyroxine,T4). However, unlike mammals, thyroid follicles in fish do not generally form a gland (exception is tuna fish and parrot fish) as they lack a capsule and instead they are spread throughout the connective tissue of the pharynx (Leatherland, 1993; Bentley, 1998). The organization is also variable between and within fish taxa and follicles can be dispersed in connective tissue near the pharyngeal region, located next to the ventral aorta, or can even migrate from the subpharynx and associate with the kidney (Eales and Brown, 1993). Recently in zebra fish was found evidence for hormone production not only in thyroid follicular cells, but also in an anterior non-follicular group of cells, which are able to produce THs in an independently of the pathway leading to thyroid follicle formation (Wendl et al., 2002).
In teleosts the study of the central control is rudimentary but appears to be limited to the control of production and secretion of T4 (Eales and Brown, 1993). This differs from the mammalian thyroid system which is driven principally via hypothalamus-pituitary-thyroid axis and which regulates both T4 and T3. In all vertebrates important THs activation is controlled outside the thyroid and deiodination of T4 to T3 occurs principally in peripheral tissues, principally in the liver, ( but also in brain, kidney and gill) rather than in thyroid itself (Power et al., 2001). In addition, and in contrast to mammals where plasma T4 largely exceeds T3 levels, plasma T3 levels in teleosts may exceed that of T4 (Power et al., 2001). There are two fundamental differences in Iodide metabolism between fish and mammals. Fish are able to take up its requirements of iodide from the bathing via the gill surface, even in fresh water that has less iodide than salt water. Although like mammals iodide can be taken up from the diet as well, however the supply from water is generally sufficient (Eales and Brown, 1993).
In fish the functional role of thyrotrophin release hormone (TRH) in regulating TSH is not well established, although recent experiments using pituitary cells isolated from the bighead carp indicate that TRH exposure upregulates TSH messenger RNA levels. TRH bring about
General introduction
11 its action by binding to a G-protein coupled receptor and fish in common with mammals possess two forms (Yamano et al., 1994; Yamano and Inui, 1995).
Agnathans, chondrichthyes, and teleosts express the three isotypes of deiodinases DI, DII and DIII, which are responsible for the peripheral fine-tuning of THs bioactivity (Orozco and Valverde-R, 2005), although, tissue distribution and deiodinases activity in fishes is not identical from those of the mammalian enzymes (Sanders et al., 1999). Tilapia type I deiodinase catalyses both ORD and IRD, type II catalyses only ORD and type III catalyses only IRD (Power et al., 2001). As in higher vertebrates, in fish two TR (TRα and TRβ) genes has been cloned from several species and their functional differentiation has been suggested, specially during metamorphosis and early development (Yamano, 2005), indicating that THs function can be modulated at the receptor level, which may partly explain why TH can influence on various parts of the body simultaneously. In contrast to higher vertebrates, where has been established that TR regulates its responsive genes by binding to a cis-acting element of the gene, in fish such direct target genes had not been determined (Yamano, 2005). Relatively little is known about THBPs in fish until recently. TTR was cloned in a teleost fish “Sparus auratus” (Santos and Power, 1999), but before that time THs had only been found in plasma bound to albumin and lipoproteins. TTR was shown to bind THs (Santos and Power, 1999; Santos et al., 2002; Morgado et al., 2007c). Now is clear that this protein is involved in TH transport and metabolic processes related to the thyroid axis in fish (Yamauchi et al., 1999; Power et al., 2000), being suggested a direct or indirect control of TTR expression by THs levels.
9. Objective
The objective of the present study was to analyse the effect of three anti-thyroid agents used in medical treatment of hypothyroidism in humans, on the thyroid axis of a teleost fish. These anti-thyroid compounds have been used in previous studies with fish to induce hypothyroidism, and this is based upon the assumption that the thyroid axis works in the same way in fish as in mammals, however, the results were inconsistent.
In order to clarify whether several goitrogens can depress serum TH concentrations and test the assumption that the thyroid axis works in the same way in fish as in mammals, the major goitrogenic compounds, MMI, thiourea and PTU were tested on the fish thyroid axis
General introduction
12
The effect of these compounds were analyzed in different elements of the thyroid axis: • THs serum concentrations were measured by RIA, and the role of the
Hypothalamus-pituitary-thyroid axis and peripheral control were evaluated by analyzing T4 levels and T4/ T3 ratio, respectively.
• The morphology of the thyroid follicles was assessed by staining of sections of sea bream thyroid tissue in order to detect eventual goiter formation and thyroid activation.
• Transthyretin and total serum proteins concentrations were measured by Western blot and Lowry assay, respectively, in order to detect eventually effects of goitrogenic compounds in THs transport proteins.
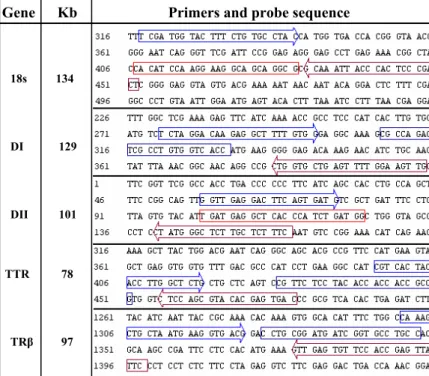
• Gene expression of TSHβ, TTR, TRα, TRβ and Deiodinases I, II and III were quantified by Real time quantitative PCR (qPCR) in order to investigate the mechanism of action of thyroid axis in fish.
Altogether, this information will help to understand if MMI, thiourea and PTU are effective anti-thyroid agents in fish and consequently if they can be efficiently used as hypothyroidism inducers in experimental conditions.
10. The experimental model – Sea bream
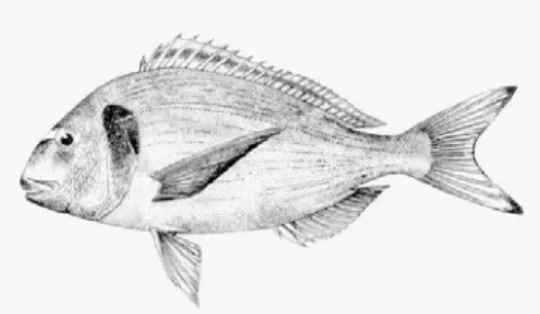
Sea bream, Sparus auratus, (Fig 6.) is a marine fish, which lives at 1-150m depth. It belongs to the Family sparidae, Order perciformes and Class actinopterygii. It is a protandric hermaphrodite species, maturing first as male (during the first or second year of age) and after the second or third year of age, as female. Spawning generally occurs in the wild from October to December, with sequential spawning during the whole period (http:// www.fishbase.org).
Due to the ready availability of sea bream in southern Europe and its importance as an aquaculture species, considerable research has been carried out with this species which is
General introduction
13 used as a physiological model of temperate marine teleosts. A large number of resources are now available for this species, including genomic libraries, complementary DNA (cDNA) libraries, microarrays and a radiation hybrid (RH) map.
Figure 6 – The experimental model: Sea bream (Sparus auratus) (Taken from www.fishbase.org)
In the sea bream the thyroid follicles are visible as early as four days post-hatch when larvae are still poorly developed (Santos et al., 2002) and maternal THs has also been detected in sea bream eggs, suggesting that THs may contribute to early development (Power et al., 2000) and to growth and maturation in adult sea bream.
The application of techniques of molecular biology in sea bream has resulted in the identification and characterization of TRs and the three iodothyronine deiodinases enzymes. The TRs (TRα and TRβ) were also found in this teleost and the tissue distribution of TRβ transcripts assessed, indicating similar expression in skeletal muscle, heart, intestine, brain, kidney, liver and gill. In addition was already demonstrated, in vitro, that TRβ binds T3 with greater affinity than T4 (Nowell et al., 2001). The only studies concerning the tissue localization of TTR transcripts in fish have been carried out in the sea bream, being this produced in liver, intestine, brain, skin, heart, skeletal muscle, kidney, testis, gills and pituitary (Funkenstein et al., 1999; Santos et al., 2002). TTR was cloned from a liver cDNA library (Santos and Power, 1999) and was found to bind preferentially T3 (Morgado et al., 2006).
Methods
17
1. Animal and experiment conditions
Immature sea bream (approx. 50g body weight) were obtained from TIMAR (Tavira, Portugal) and maintained in open sea water circuits at the experimental station Ramalhete Marine Station (Faro, Portugal) at normal ambient temperature (20-21 ºC) and salinity (36 parts per thousand, ppt) for October in Algarve, Portugal.
Fish were weighed and transferred to four different tanks (65L) labeled as follows: control (average wet weight fish (W)=57,86±7,38g); thiourea (W=60,29±10,27g), PTU (W=58±6,76g) and MMI (W=59,14±11,82g) at a density of seven fish per tank. Fish were acclimated to the experimental circuit for 2 weeks with a 12 h light/dark photoperiod and daybreak set at 07.00h. Water temperature and salinity were 20-21 ºC and 36 ppt, respectively during the experiment. Fish were fed twice daily during acclimation and the experiment and the total food administered per day was 1.5% of total fish weight per tank. A commercial sea bream diet (Dourasoja size 2mm) was used. Maintenance and manipulation of fish was conducted in accordance with the Guidelines of the European Union Council (86/609/EU).
2. Administration of goitrogenic compounds
All the goitrogenic compounds used to treat the fish were administered via the diet in such a way that the daily exposure would be approximately 1 µg/g wet fish weight. The cumulative concentration at the end of the experiment (21 days) in a 50g fish (the average size) was calculated to be 1mg. For the treatment of food, chemicals were dissolved in 5 ml of ethanol to the appropriate concentration and then the food pellets were sprayed with the chemical solution and fed at the desired dose to the fish. Particular care was taken to ensure food was evenly coated with the chemical solution and to reduce risks for experimenters this was carried out in a fume cupboard and the food left until all the ethanol had evaporated. In order to avoid oxidation of the goitrogenic compounds, treated food was prepared weekly with freshly prepared solutions and stored in an airtight bag at 4 ºC in the dark. Just before feeding the fish with the food its palatability was increased by spraying it with cod liver oil.
Methods
18
3. Tissue sampling
After 21 days of treatment fish were anaesthetized in 0.02 % (v/v) phenoxyethanol (Sigma-Aldrich), weighted, length measured and a blood sample removed from the caudal region using a heparinized syringe. Blood was centrifuged at 1000g for 10 min at 4 ºC and the plasma frozen in liquid nitrogen and stored at -20 ºC. Fish were then killed by decapitation and the kidney, pituitary and liver rapidly dissected out. The tissues were immediately snap frozen in liquid nitrogen and stored at -80 ºC until analysis. Tissue from the insertion of the gill arch into the lower mandible (see below) was fixed in Bouin-Holland for subsequent thyroid histology.
4. Histological procedure
4.1 Fixation and processing:
Thyroid tissue in fish is located in the lower jaw in the region of insertion of the gill arches with the pharynx. Since the thyroid tissue in fish is not encapsulated it tends to be difficult to identify and specifically extract and for this reason the entire pharyngeal region was fixed in Bouin–Holland solution (ratio 1 volume of tissue: 10 volumes of fixative). Tissue was fixed for 4 days at room temperature with occasional agitation, fixative was removed and tissue rinsed in distilled water until excess fixative was removed. Tissue was subsequently decalcified in a solution of EDTA, pH 8 (GE) at room temperature with occasional agitation over 7 days.
Paraffin blocks of the fixed tissue for sectioning were prepared by dehydration through a graded ethanol series from 70 to 100%, followed by saturated xylene (100%) and finally embedded in paraffin (Histosec, Merk, Germany) using an automated tissue processor (Leica, TP1020). Sections of embedded tissue (8 μm) were cut using a rotary microtome (Leica, RM2125). Serial sections were mounted on glass slides coated with poly-L-lysine
(Sigma-Aldrich, Spain) and dried overnight in an oven at 37°C. 4.2 Staining:
In order to identify the thyroid follicles in the sections these were stained using Cleveland– Wolfe trichrome (Cleveland and Wolfe 1932). This method, more classically applied for identification of endocrine cells in the pituitary gland gives good differentiation of thyroid
Methods
19 tissue, as the colloid present in the follicle lumen stains bright red/orange and the thyrocytes of the follicle stain purple.
For staining, paraffin was removed from sections by immersion in xylene and tissue was then rehydrated by passing it through a graded series of ethanol (100% → 50%). Mercury, one of the constituents of Bouin–Holland fixative may interfere with staining and therefore was removed from tissue sections by immersion in 1% iodine in 70% ethanol, followed by immersion in 5% sodium thiosulfate and rinsing in distilled water just prior to staining. Tissue sections were stained in Erlich’s haematoxylin for 5 min, “blued” in tap water and washed with distilled water. Subsequently, tissue sections were stained in 1% aqueous erythrosine for 5 min, rinsed in tap water and distilled water and then stained for 10 s in 2% Orange G (in 1% phosphotungstic acid), then rinsed in distilled water before staining with Aniline blue (0.25% aqueous, acidified to pH 3.5) for 90s. Finally, the sections were rapidly rinsed in ethanol 100%, followed by xylene, and mounted for definitive preparation in DPX. Photographs of stained sections of thyroid tissue were taken using an Olympus BH-2 optical microscope coupled to an Olympus DP11 digital camera. Image processing was carried out using open source software, Image-J (http://rsb.info.nih.gov/ij/).
5. Biochemical analysis
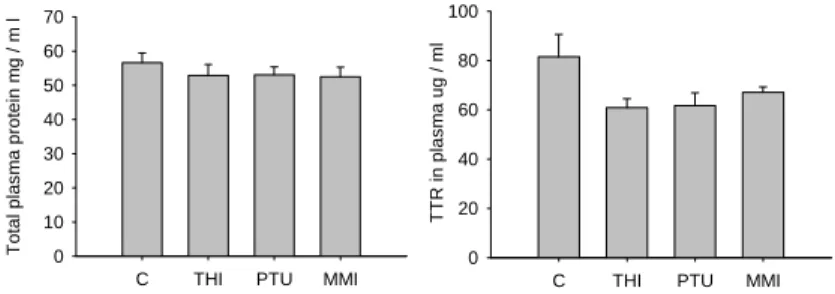
Biochemical analyses were developed in order to quantify total protein and total thyroid hormones (T3 and T4) in plasma. Total protein was quantified in order to establish if treatments modified the concentration of plasma protein compared to control fish and also to compare/normalize protein expression of the thyroid hormone binding protein transthyretin (TTR), which was analyzed by western blot. The plasma TH levels were measured in order to assess the effectiveness of treatment with goitrogenic compounds which should cause a significant reduction in circulating THs.
5.1 Total protein in plasma
The total protein concentration in fish plasma was determined using the Lowry Method (Lowry et al., 1951). This assay is based on the reaction of proteins with copper ion in alkaline solution. As a result, complexes are formed, which react with the Folin-phenol reagent (a mixture of phosphotungstic acid and phosphomolybdic acid in phenol), and the
Methods
20
product of this reaction becomes reduced to molybdenum/tungsten blue and can be detected colourimetrically by absorbance. A standard curve with know quantities of protein is used and because the absorption of light is proportional to the concentration of protein present this relationship can be used to determine the concentration of protein in samples.
The assay was performed with bovine serum albumin as the standard and the mass of protein present in each sample calculated using the linear equation applied to the standard curve. The protein was diluted in NaOH 0.1N, making a total volume of 100 μl. The concentration of protein was determined in collected fish plasma in duplicate using 5μl of a 1/10 dilution of plasma in each reaction together with 1000 μl of C solution (1ml: 0,5%CuSO4 in 1% NaCO3; plus 50ml: 2%Na2CO3 in,0.1 N NaOH). The reaction was then vortexed and tubes maintained for 10 min at room temperature and subsequently 100 μl of Folin Reagent (50%) was added and the absorbance measured immediately at 745 nm.
5.2 Western blot of transthyretin in plasma
TTR in plasma was determined by western blot analysis using the ECL system (ECL plus western blotting detection system, Amersham Biosciences). For western blot a standard curve was prepared with serial dilutions of standardised sea bream recombinant TTR (from 35 to 75 ng) and was always run in parallel to four plasma samples collected from each experimental group (Control, thiourea, MMI, PTU). TTR signal in the developed western blots was quantified by densitometry using the software Quantity One (free trial- Bio-Rad, USA). Solution and gel compositions needed for SDS-PAGE and immunobloting are presented in Appendix.
5.2.1 SDS-PAGE
Prior to electrophoresis, samples were prepared in 2x loading buffer containing dithiothreitol (DTT) and boiled for 10 min at 100ºC to ensure protein denaturing. Minigels of 1,5 mm thickness were prepared in a dual gel vertical caster system (Mighty SmallTM SE245, Hoefer, San Francisco) with 10-well combs. After polymerization of polyacrylamide gels they were transferred to the electrophoresis unit (Mighty Small II SE250/260, Hoefer) and samples were loaded and run in a Tris-Glycine running buffer at constant power of 40 mA. A prestained protein ladder (#SM0671, Fermentas) was always
Methods
21 included in electrophoresis to give an estimate of the molecular weight of the proteins analysed.
The gel was used for immunoblotting after transferring the fractionated proteins to hydrophobic polyvinylidene difluoride (PVD) membrane (Hybond-P, Amersham Bioscicences). The transfer and immunoblot processes, were performed according to the suppliers manual and are now briefly described. On completion of SDS-PAGE, a sheet of Hybond-P membrane was cut to the size of the resolving gel and wet in 100 % methanol for 10 s for activation, washed in distilled water for 5 min and then equilibrated in transfer buffer for at least 10 min. Several sheets of Whatman paper were also cut to exactly the same size as the polyacrylamide gel and also soaked in transfer solution. Immediately after polyacrylamide gel was ran it was also soaked in protein transfer buffer for 10-20 min. After equilibration a transfer “sandwich” was assembled by placing the Hybond-P membrane in close contact with the gel and then placing 6 sheets of absorbent Whatman paper on each side. The “sandwich” was fastened into an electroblotting cassette and placed inside a vertical electroblotting tank (TE22 Mighty small tank transfer, Hoeffer) filled with transfer buffer. After transfer, carried out for 1 h at 300mA with water cooling, the Hybond-P membrane containing the transferred proteins was removed from the cassette, rinsed in 1xPBS, wet in 100% methanol and washed for 5 min in distilled water before incubation in skimmed milk blocking solution overnight at 4 ºC.
5.2.2 Immunoblotting and detection by chemiluminescence
Detection by chemiluminescence was performed using the kit ECL Plus Western Blotting Detection System (Amersham Biosciences). Basic steps in the protocol were done according to the supplier’s instructions and after optimization the procedure was the following:
The blocked membrane was rinsed in 1x PBS with two changes to remove excess blocking solution and incubated with rabbit anti-seabream TTR sera, produzed in rabbit against purified recombinant sea bream (Morgado et al., 2006) (optimized dilution of 1:10 000) for 1 h at room temperature. Excess antisera was removed by washing membrane with excess (4 ml/cm2) PBS/Tween 20 washing solution followed by another 3 x 5 min washes prior to
Methods
22
addition of the secondary antibody ECL anti-rabbit IgG horseradish peroxidase linked, from donkey (1:100 000 dilution, Amersham Biosciences). Membranes were incubated with the secondary antisera at room temperature for 1 h and rinsed twice in washing solution prior to a 15 min wash in excess (4 ml/cm2) wash buffer followed by another 3 x 5 min washes. For detection reagents A and B supplied in the kit, previously equilibrated at room temperature for some minutes, were mixed with the proportion 40:1 to allow a final volume of 0.1 ml/cm2 of membrane. The membrane was placed in as sheet of cling film (after removing excess wash buffer) with protein side up. The mix detection reagent was evenly distributed on the membrane surface and incubated at room temperature for 5 min. Excess reagent was carefully drained by holding membrane corner against an absorbent tissue. The membrane was then placed inside a transparent plastic sheet, removing any air bubbles and transferred to an X-ray film cassette protein side up. In the dark room an autoradiography film (Hyperfilm ECL, amersham biosciences) was placed on top of the membrane, exposed for 15 s. The film was developed (using Kodac fixer and developer from Sigma-Aldrich) and based on its appearance exposed for more time if needed (estimated time could usually go from 1 min to 1 h) until the desired band intensity and clean background was achieved.
5.3 Radioimnunoassay for T4 and T3
5.3.1 Overview of a radioimmunoassay (RIA)
The basic principal of all immunoassays is the quantification of antigens (peptide and proteins) through their specific interaction with antibodies (Chard, 1990). In RIA, the quantification of an antigen depends on the progressive saturation of specific antibody molecules and the equilibrium which is established between the proportion of antigen which is free or bound to the antibodies. The distinction between the free and bound fraction of the antigen is made by incorporation of a radioisotope that works as an antigen “tracer” and permits the proportion of antigen bound or free to be estimated. The most frequently utilized radioisotopes utilized are tritium (3H) or iodine 125 (125I). In the present study RIA was used to quantify the concentration of THs (antigen) in fish plasma, using radioactively labeled hormones ([125I]-T4 and [125I]-T3) as tracers and antiT4 or antiT3 antibodies.
Methods
23 The TH RIA is based on the competition between radioactively labeled T3 or T4 and molecules of free T3 and T4 present in sample for a constant concentration of antibody (antiT4 or antiT3 sera) molecules. Initially, only the labeled hormone is bound to the antibody but when free hormone is added both compete for the same antibody binding sites. This means that the higher the concentration of free hormone the higher the proportion bound to the antibody and the greater the proportion of labeled hormone which is displaced. Before carrying out the RIA, an antibody dilution curve is performed trough serial dilutions of the antibody, which are incubated with a fixed amount of labeled hormone. The proper amount of antibody chosen is that which will bind 50% of the labeled hormone (Fig 7A). At this concentration it is apparent that the addition of further ligand must lead to a substantially greater increase in the free fraction than the bound fraction. In contrast, if a much higher concentration of binder is chosen, the amount of ligand required to produce a significant shift in the bound and free fractions will be much greater.
In order to establish the relationship between radioactive measurements (counts per minute) and the concentration of free hormone added, a standar curve is designed (Fig 7B). This curve involves the incubation of fixed amounts of labeled hormone and antibody with known concentrations of free hormone. The percentage of the labeled hormone bound to antibody is progressively reduced with increasing concentrations of standard (unlabeled hormone).
Figure. 7- (A) Antibody dilution curve: Serial dilutions of the antibody are incubated with a fixed amount of tracer ligand. The amount of antibody chosen is that which will bind 50% of the tracer. (B) Standard curve: fixed amounts of tracer ligand and binder are incubated with varying concentrations of standard unlabelled ligand. The percentage of the tracer bound to antibody is progressively reduced with increasing concentrations of standard (adapted from Chart, 1990)
Methods
24
In order to calculate the final concentration of hormone in the sample, some characteristics need to be measured. 1) Maximum ligation of the assay (M), which is achieved by adding labeled hormone in excess to the specific antibodies in the absence of competition (in absence of free hormone all the binding sites of the antibody will be coupled by the radioactive hormone); 2) total counts (T), or total quantity of labeled hormone, added to the assay and this is determined for duplicate tubes which contain only radioactive “tracer” and 3) none-specific binding, that is the radioactive hormone which will reside in reaction tubes in the absence of specific separation as a consequence of none specific sticking of the radioactive “tracer” to the tube and other components of the assay.
In order to quantify the labeled antigen which is specifically bound to antibody the bound and free fraction of antigen need to be separated. Separation can be carried out using a number of different methods and the success of the method depends on the nature of the antigen. Two of the principal methods involve either i) the use of activated carbon or ii) a secondary antibody. In the first mechanism, activated carbon is added to the reaction tube and free molecules in solution enter the porous charcoal while antibody bound antigen complexes are too large. The charcoal containing unbound antigen is separated by centrifugation and the antigen bound to antibody remains in solution and can be counted in a gamma or beta-radiation counter depending on the radioactive “tracer” utilized. In the second method, the separation can be ensured using a secondary antibody directed against the primary antibody specific for the antigen being measured, in this case the antigen-antibody-secondary/antibody complex precipitates due to changes in solubility and the amount of radioactive “tracer” bound in the antibody complex can be measured in a gamma counter.
5.3.2 T3 and T4 RIA conditions
Thyroid hormone plasma concentrations were measured using specific and reproducible radioimmunoassay (RIA) for T3 and for T4. Briefly, plasma samples were diluted (1/10) in phosphate buffer (0.01M pH 7.60), heat extracted (1h 30 min at 70ºC) and then cooled on ice and centrifuged for 5 min, at 4ºC and 3000 rpm. The total assay volume was 300µl and was composed of 100µl of standard or diluted plasma (15 µl of 1/10 diluted plasma in 85 µl
Methods
25 buffer), 100 µl of anti-T4 sera (1:8000, ~3% cross-reactivity with T3; T2652 - Aldrich) or anti-T3 sera (1:15000, <0.01% cross-reactivity with T4; T2777 - Sigma-Aldrich) and 100 µl of tracer ([125I]-T4 and [125I]-T3, respectively). Assays were incubated overnight at 4ºC and separated by adding a secondary antibody (100 µl; diluted 1:10 in 0.01% (w/v) rabbit IgG; Sigma- Aldrich) to all tubes with the exception of those used to determine total counts. Tubes were mixed and incubated for a further 20 min at room temperature, after which 300 µl of an ice cold PEG solution (7.5 % w/v PEG 8000; Merck) in assay buffer was added, and the tubes were centrifuged for 20 min, 1500g at 4ºC. The supernatants were decanted, and the pellets were counted in a gamma counter (Wizard, Pharmacia-LKB).
6. Molecular analyses 6.1 RNA extraction
Total RNA was extracted from the whole pituitaries and 25-100 mg of kidneys and liver sections using TRI reagent (Sigma-Aldrich) according to the protocol and recommendations provided by the manufacturer. Extracted RNA was resuspended in 150-250 µl (kidney), 100-300 µl (liver) and 10 µl (pituitary) of DEPC-treated water. Total RNA was quantified using a commercial kit (Quant-iT RNA Assay Kit and Qubit fluorometer, (Invitrogen, Carlsbad, CA. USA), from 1 µl of RNA dilutions (1:10 pituitary, 1:25 -Kidney and 1:50 - liver). Quality of extracted RNA was assessed by measuring absorbance at 260 and 280 nm (1Abs260=40µg/ml of RNA; ratio Abs260/Abs280 estimates RNA purity and should be higher than 1.6).
To eliminate possible contaminating genomic DNA prior to cDNA synthesis, 1μg of RNA was treated with DNase using the DNA-free Kit (Ambion, UK), in a 20 μl reaction volume, and following the suppliers instructions. At the end of treatment, 12 μl of DNA-free RNA was recovered.
6.2 Complementary DNA (cDNA) synthesis
Synthesis of cDNA was carried out in a 20 µl final reaction volume using 500 ng of each DNase-treated RNA, 1 mM of dNTP mixture, 50 ng of random hexamer primers (pd(N)6, Amersham Biosciences) and sterile water (Sigma-Aldrich). The reaction was heated at 65
Methods
26
ºC for 10 min to heat-denature RNA and incubated on ice for 10 min before adding the final reaction components: 25 U of RNAguard RNase inhibitor (Amersham Biosciences), 40 U of MMLV RT (reverse transcriptase) and 5x RT buffer (Promega). The cDNA synthesis reaction was incubated for 10 min at 25 ºC followed by 50 min at 42 ºC and terminated by incubation for 10 min at 72 ºC.
Before starting the gene expression analysis, 18S cDNA amplification by RT-PCR was used as an indicator of sample concentration and quality. This gene is usually used as an internal control in semi-quantitative or quantitative relative RT-PCR, to normalize for the input RNA amounts and RT efficiencies between different cDNA samples, since it is expressed in relatively constant and high levels in all types of cells, or simply to estimate the cDNA quality.
6.3 Polymerase chain reaction (PCR) 6.3.1 Overview
The polymerase chain reaction its one of the most frequently used tool in molecular biology, since it allows amplification of gene targets, which permits detection of transcripts present in tissue at low abundance or in tissue samples of very small size. It uses the ability of a thermo-stable DNA polymerase enzyme (Taq polymerase) to extend short single stranded synthetic oligonucleotides “primers” during repeated cycles of heat denaturation, primer annealing and primer extension. The primers are designed to bind the DNA fragment to be amplified. The Taq polymerase uses the target DNA added to the reaction as a template for primer extension. At each cycle, more DNA is synthesized, providing additional template. The reaction proceeds in an exponential manner, doubling the amount of target in each cycle, until one of the reagents becomes limiting and the reaction reaches a plateau, or until the Taq polymerase has lost its activity.
6.3.2 Amplification of the internal control 18S to evaluate cDNA sample concentration and quality
The PCR for 18S ribosomal RNA (18S rRNA) contained 0.5 µl of each cDNA (approximately 12.5 ng), 10 pmol of forward and reverse primer, 500 µM dNTPs, 1.5 mM MgCl2, 0.5U of Taq DNA polymerase (Promega, VWR, Portugal), 1x PCR buffer and
Methods
27 molecular biology grade water (Sigma-Aldrich) to a final volume of 10 µl. Thermocycling conditions consisted of an initial denaturing step of 95 ºC for 1 min, followed by 18 cycles of 95 ºC for 30 s (denaturing), 59 ºC for 30 s (annealing) and 72 ºC for 30 s (usually 60 s/Kb expected, extension). A final elongation step was performed at 72 ºC for 1 min and PCR products were analyzed by agarose gel (1 %) electrophoresis (solution and gel compositions is described in Appendix).
Typically, the 18S assay yields visible amounts of PCR products (analyzed by agarose gel electrophoresis) at less than 22 cycles. Samples needing more than 22 cycles may not contain enough cDNA for accurate analysis and may be an indication of poor sample quality and in such cases samples were excluded from the samples analyzed. The quality and homogeneity of the cDNA used for quantitative PCR was established by amplification of 18S rRNA and the reaction products were evaluated by electrophoresis on agarose gel (1%)
6.4 Real-time quantitative PCR
In this thesis, Quantitative RT-PCR (qPCR) was used to compare the expression of a group of genes involved in the thyroid axis. Gene expression was compared between the different tissues analyzed, and between the experimental groups of fish treated with goitrogenic compounds and control fish.
6.4.1 Overview
Real time qPCR quantification is a method that has been introduced relatively recently and has found widespread use for applications such as allelic discrimination and expression profiling. A number of commercial companies have generated “ready to use reagents” although they tend to be very expensive which limits the application of this method. Moreover, most of the problems characteristic of the extreme sensitivity of RT-PCR get even more important in qPCR and caution must be exercised in order to avoid contamination.
Current detection methods are based on changes in fluorescence proportional to the increase in product, whether specific or none specific. Fluorescence is monitored during each PCR cycle to provide an amplification plot, allowing the user to follow the reaction,
Methods
28
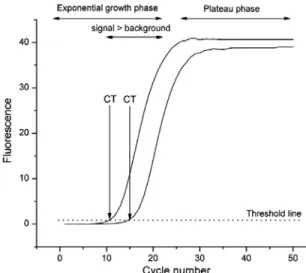
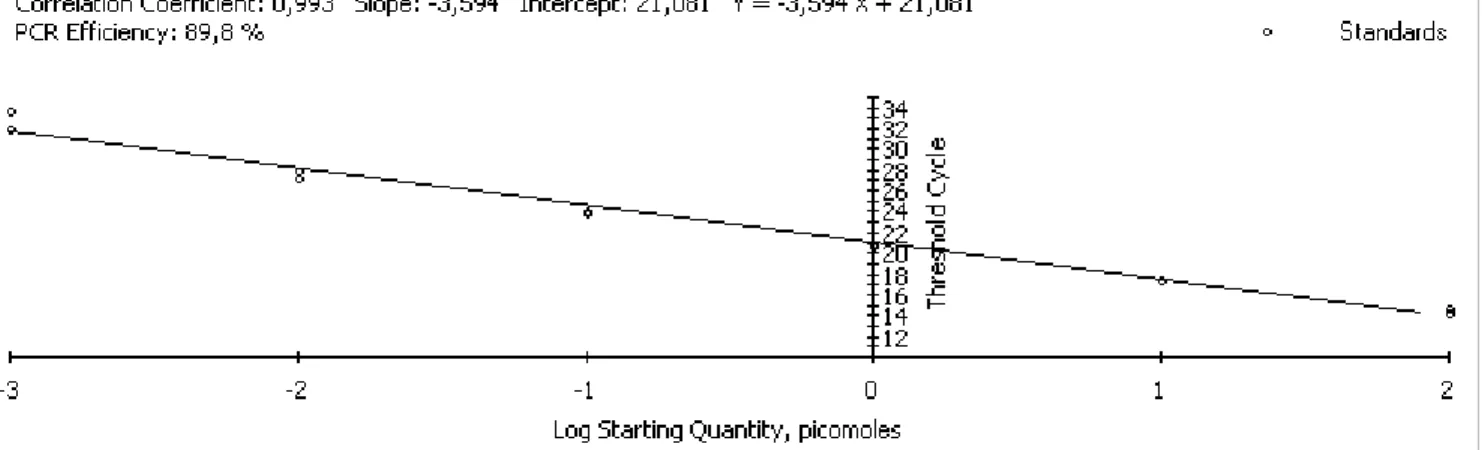
and the threshold cycle (Ct, the cycle at which the fluorescence generated within a reaction crosses a threshold limit) is registered and compared for each sample or control reaction (fig. 8). The threshold is set in a level at which a statistically significant increase in fluorescence is first detected, when the amplification signal becomes higher than the fluorescence background, and associated with an exponential growth of PCR product in all samples.
Figure 8 - Real-time qPCR response curves. Fluorescence is monitored during each PCR cycle to provide an amplification plot. The threshold cycle (Ct) corresponds to the cycle at which a statistically significant increase in fluorescence is first detected associated with an exponential growth of PCR product, and when the amplification signal becomes higher than the background of fluorescence. A threshold line should be set sufficiently above the background (from Kubista et al, 2006).
There are two types of chemical detection used in Real-Time qPCR: Non-specific detection, which monitors all double strand DNA produced during the reaction and specific detection, in which probes are used, which may be labeled with different dyes and due to their different excitation and emission spectra allow the dyes to be distinguished from one another. To the former group belong the TaqMan® probes, which were used to develop the assays established in the present thesis to quantify the expression of target genes.
The TaqMan® Probes, also called double-dye oligonucleotide or dual labeled probes, contain a reporter fluorophore attached to one end of the probe and a quencher fluorophore at the other end, which reduced the fluorescence of the reporter. The molecular events in a