Article
Printed in Brazil - ©2018 Sociedade Brasileira de Química*e-mail: [email protected]
Preparation of Tetraethylenepentamine Modified Magnetic Graphene Oxide for
Adsorption of Dyes from Aqueous Solution
Xiaosheng Tang,a Ping Tangb,c and Liangliang Liu*,b
aHubei Key Laboratory of Edible Wild Plants Conservation and Utilization & National
Demonstration Center for Experimental Biology Education & College of Life Sciences, Hubei Key Laboratory of Pollutant Analysis & Reuse Technology, Hubei Normal University,
435002 Huangshi, Hubei, China
bInstitute of Bast Fiber Crops, Chinese Academy of Agricultural Sciences, 410205 Changsha, China
cSchool of Environmental Science and Engineering, Hubei Polytechnic University,
Hubei Key Laboratory of Mine Environmental Pollution Control and Remediation, 435003 Huangshi, Hubei, China
In this study, tetraethylenepentamine modified magnetic graphene oxide nanomaterial (TMGO) was prepared and characterized by transmission electron microscopy (TEM), Fourier transform infrared spectroscopy (FTIR), Raman spectroscopy, thermogravimetric analysis (TGA), X-ray photoelectron spectroscopy (XPS) and vibration sample magnetometer (VSM). All the characterizations proved that the modification and preparation of TMGO were successful. The TMGO nanomaterial was used in the adsorption of Acid Red 18 (AR) in aqueous solution. The parameters like pH of solution, adsorption kinetics and isotherms were all investigated. The results indicated that the TMGO nanomaterial had satisfied adsorption ability and the maximum adsorption capacity was 524.2 mg g-1 at 45 °C and pH 6. The adsorption capacity remained at 91.8% of
the initial value after five cycles. The adsorption process with AR was found through fitting the pseudo-second-order kinetics equations and the Freundlich adsorption model. The experimental results demonstrated that the TMGO nanomaterial could be rapidly extracted from the medium and had a good adsorption ability to remove dyes in wastewater.
Keywords: adsorption, dye, graphene oxide, magnetic nanoparticles, tetraethylenepentamine
Introduction
Increasing interests were focused on the environmental health, especially the removal of toxic organic or inorganic pollutants from water because of the water pollution during the development of modern industry.1 Among the
various toxic pollutants, dye was one of the most serious problems because of the visible color, complex component and low biodegradability.2 Dye was widely used in direct
textiles, printing and dyeing. It showed many damages to plants, animals and human beings.3 Therefore, wastewater
containing dyes should be treated adequately before being discharged.4 The development of materials for removal of
dyes exhibited considerable importance.
Recently, many kinds of materials and nanomaterials such as silica nanoparticles, carbon nanotube, gold
nanoparticles and metal oxide nanoparticles were utilized as adsorbents for removal of toxic compounds.5-8
Graphene oxide (GO) attracted significant interests due to its high mechanical strength and facile functionalization ability.9 It could be a good material for adsorption owing
to the large specific surface area, abundant oxygen containing groups and high water solubility.10-12 Magnetic
nanoparticles (MN) were also good in separation of toxic dyes by simply using an ordinary magnet.13,14 After the
combination of MN and GO, magnetic GO (MGO) and related complex nanomaterials were prepared and used in pollution control and sensors were benefited from the advantages of both MN and GO.15-18 During the various
kinds of applications, many advantages of MGO were demonstrated including high adsorption capacity, easy recycling and improved stability.
to increase amino groups and ultimately increase the interaction between adsorbent and dye molecule. The TMN was then bound on the surface of GO (TMGO) and the final nanomaterial was applied in the adsorption of Acid Red 18 (AR). The prepared materials were characterized by transmission electron microscopy (TEM), Fourier transform infrared spectroscopy (FTIR), Raman spectroscopy, thermogravimetric analysis (TGA), X-ray photoelectron spectroscopy (XPS) and vibration sample magnetometer (VSM). In order to obtain the optimum reaction condition, effect of pH on the adsorption of AR and the reusability of TMGO were investigated. Kinetics and isotherms parameters of the adsorption were also determined. The experimental results showed that TMGO had a satisfied adsorption capacity and could be regenerated.
Experimental
Chemicals and materials
Graphite flake (100 mesh) was purchased from Nanjing XFNANO Materials Tech Co., Ltd. (Nanjing, China). 1-Ethyl-3-(3-dimethylaminopropyl) carbodiimide
(EDC), N-hydroxy sulfosuccinimide (NHS) and
3-aminopropyltriethoxysilane and glutaraldehyde were acquired from Sigma-Aldrich Chemicals (St. Louis, MO, USA). Tetraethylenepentamine and Acid Red 18 (AR) were obtained commercially from Aladdin (Shanghai, China). Ferric chloride hexahydrate (FeCl3·6H2O, 98%),
polyethyleneglycol (PEG 6000) were purchased from Sinopharm Chemical Reagent (Shanghai, China). Ultrapure water (18.2 MΩ cm resistivity) was obtained from an ELGA water purification system (ELGA Berkefeld, Veolia, Germany). All of other chemicals were analytical grade and purchased from Sinopharm Chemical Reagent Co., Ltd. (Shanghai, China).
Synthesis of TMN
MN was synthesized by solvothermal method. 1.350 g of FeCl3·6H2O, 1.000 g of PEG 6000 and 3.600 g
of anhydrous sodium acetate were mixed in 40 mL of ethyleneglycol with 30 min stirring. The solution was then transferred into a stainless steel autoclave and maintained at 180 °C for 8 h. Finally, the Fe3O4 MN was washed with
ethanol for three times through magnetic separation and dried in vacuum at 40 °C.
0.100 g of MN was dispersed in 200 mL of ethanol with 30 min mechanical agitation. 2 mL of 3-aminopropyltriethoxysilane was then dropwise added
and the solution was stirred for 6 h at room temperature. The obtained amino-MN was washed with ethanol for three times and transferred in 50 mL of water containing 5% glutaraldehyde. After shaken for 30 min, 2 mL of
tetraethylenepentamine (1.0 mg mL-1) was added to
the mixture. After further 30 min shaken, redundant tetraethylenepentamine was removed. The final TMN was washed for three times with ethanol and dried in vacuum at 40 °C.
Synthesis of GO
GO was prepared according to the improved hummer method reported by Marcano et al.19 Briefly, 13 mL of
H3PO4, 120 mL of concentrated H2SO4, 6.000 g of KMnO4
and 1.000 g of graphite flakes were mixed and kept at 50 °C for 12 h with magnetic stirring. Then the mixture was poured into 130 mL of ice containing 3 mL of 30% H2O2. The mixture was centrifuged for 30 min and the
supernatant was decanted. Then the remaining solid was washed with 30% HCl and water for five times, respectively. For each wash, the mixture was centrifuged for 30 min and the supernatant was decanted. The finally obtained solid material was dried in vacuum at 40 °C.
Synthesis and characterizations of TMGO
0.100 g of GO was dispersed in 50 mL of water. EDC (0.1 M) and NHS (0.1 M) were then added to the GO dispersion and shaken for 1 h. 0.150 g of TMN was added in the GO dispersion and shaken for 30 min. The obtained TMGO was finally collected by magnetic separation and dried in vacuum at 40 °C.
In order to characterize the obtained TMGO, TEM images of MN and TMGO were recorded on a JEOL200CX electron microscope (Jeol, Tokyo, Japan). Magnetic properties of MN, TMN and TMGO were performed on a Lakeshore 7407 vibrating sample magnetometer (VSM, Westerville, Ohio, USA) at room temperature. FTIR spectra were obtained using a Nicolet avatar 360 FTIR spectrophotometer (Thermo Fisher Nicolet, Orlando, USA) and samples were dried at 40 °C in vacuum for at least 12 h prior to fabrication of the KBr pellet. The Raman spectrum was measured by using a Raman Microscope (LabRAM HR Evolution, Horiba, Kyoto, Japan). TGA was performed in nitrogen atmosphere from 50 to 800 °C with a heating rate of 10 °C min-1 using a simultaneous thermal analyzer
Adsorption of AR with TMGO
10 mg of TMGO was added into 40 mL of AR solution with certain concentrations (50, 75, 100, 125, 150 mg L-1)
and the mixture was shaken for 120 min at 25, 35 and 45 °C. The final concentration of AR was determined by UV-Vis spectrophotometer (Shimadzu, Kyoto, Japan) at 490 nm. To study the effects of initial pH on the adsorption of AR, initial pH values of the solution were adjusted to 4, 5, 6, 7, 8 and 9 by adding hydrochloric acid or sodium hydroxide at 45 °C. All the assays were operated with three replicates.
Adsorption kinetics and isotherm
10 mg of TMGO was added into 40 mL of AR solution (150 mg L-1). The mixture was shaken at 25 °C and the
concentration of AR was determined at certain intervals. Pseudo-first-order and pseudo-second-order kinetic models were used to evaluate the sorption kinetics. The pseudo-first-order kinetic model could be expressed by the following equation:
(1)
where qe (mg g-1) is the equilibrium adsorption capacity, qt
(mg g-1) is the amount of adsorbate at time t, k
1 (g mg-1 min-1)
is the rate constant of adsorption. And the pseudo-second-order kinetic model could be expressed by the following equation:
(2)
where kad (g mg-1 min-1) is the rate constant of adsorption, qe
(mg g-1) is the equilibrium adsorption capacity, q
t (mg g-1)
is the amount of adsorbate at time.20,21
For the adsorption isotherm, 10 mg of TMGO was added into 40 mL of AR solution at the concentration range of 50-150 mg L-1. The mixtures were shaken at 25,
35 and 45 °C for 120 min and the concentration of AR was determined to study the adsorption isotherm. Langmuir and Freundlich equations were used to evaluate adsorption isotherm. The Langmuir isotherm could be expressed as follows:
(3)
where Ce (mg L-1) is the equilibrium concentration of AR
solution, qm and b are the maximum adsorption capacity
(mg g-1) and the equilibrium adsorption constant (L mg-1).
On the contrary, the Freundlich isotherm could be given as the following equation:
(4)
where Ce (mg L-1) is the equilibrium concentration of
AR solution, qe (mg g-1) is the adsorption capacity at
equilibrium, k (L mg-1) and n are the Freundlich constants.22
Reusability of TMGO
10 mg of TMGO was added into 40 mL of AR solution (150 mg L-1) and the mixture was shaken for 120 min at
45 °C. The final concentration of AR was determined and the TMGO was washed with ethanol and water for three times (5 mL of solution in each time). Then the TMGO was added into another AR solution to start a new cycle. The results were shown as the relative adsorption capacity. All the assays were operated with three replicates.
Results and Discussion
Characterization of TMGO
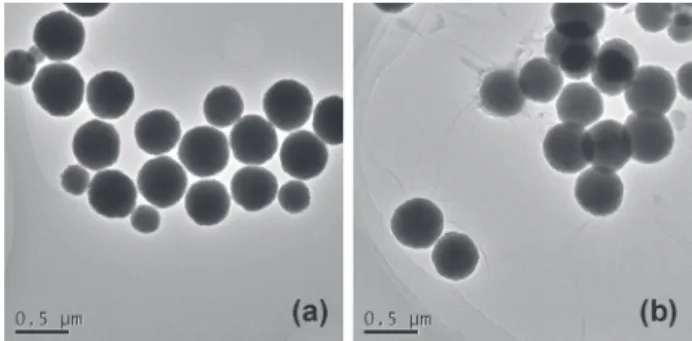
TEM images of MN and TMGO were presented in Figure 1. As shown in Figure 1a, the MN showed round shape and the range of size distribution of MN was mainly from 420 to 480 nm. The average diameter of MN was about 450 nm. Some MN with the diameter smaller than average value also existed. However, the synthesis of material and adsorption would not be affected by the small size of MN. After the combination (Figure 1b), it could be seen that TMN bound with GO and characteristics of GO like sheet-like structure and wrinkled edge could be also observed.23
was studied through FTIR spectroscopy. Figure 2 showed the FTIR spectra of MN, TMN, GO and TMGO. The FTIR spectrum of MN showed the characteristic peak at 574 cm-1
corresponding to the Fe−O stretching vibration. Two bands observed in the spectrum of TMN at 1631 and 3415 cm-1
could be assigned to the N−H bending and stretching vibrations of free amino groups on TMN surface.24 For
the spectrum of GO, the peaks at 3428 and 1629 cm-1 were
assigned to the O−H stretching vibration and the C=O stretching vibration of the carboxyl group, respectively.25,26
In the spectrum of TMGO, all feature peaks of GO and TMN could be observed, and all peaks confirmed that the preparation of TMGO was successful.
Raman spectroscopy was used to characterize carbon materials such as GO. Figure 3 showed the Raman spectrum of TMGO. The TMGO exhibited D band usually at 1340 cm-1, representing the disordered sp3 carbon
structure, and a G band usually at 1575 cm-1, representing
the sp2 ordered crystalline graphite-like structures.27
The intensity ratio of the D to G peak (ID/IG) for the
Raman spectroscopy of TMGO was 1.04. The high ratio reflected the increased disorder of the sp2 domain within
the materials.28
TGA was performed to determine the thermal stability of prepared materials. Figure 4 showed the TGA curves of MN, TMN and TMGO. The weight loss below 200 °C was related to the evaporation of absorbed water molecules. When the temperature reached 800 °C, the total weight loss of MN and TMN were 7.1 and 10.3%, respectively, which indicated the modification of organic groups on MN. While on the TGA curve of TMGO, the most significant mass loss of GO occurred below 200 °C due to water produced by the decomposition of labile hydroxyl and carboxyl groups.29
Finally, the total weight loss of TMGO reached 43.9% when the temperature reached 800 °C. It could be concluded that
the modification of MN and the combination of GO and TMN was effective.
The elemental composition and chemical status of TMGO were analyzed by XPS. Figure 5a showed the full survey scan of XPS spectra for TMGO. The sharp peaks in Figure 5a indicated the presence of carbon (C1s), oxygen (O1s), nitrogen (N1s), and iron (Fe2p) elements in TMGO. The XPS C1s, O1s, N1s and Fe2p spectra were summarized in Figures 5b-5e to further investigate the relative contents of core groups in TMGO. In the spectrum of C1s of TMGO (Figure 5b), the strong peaks at 284.8 and 286.6 eV indicated the saturated C−C bonding in graphene framework and the carbon in hydroxyl and epoxy groups (C−O−C) of GO. The peak at 288.0 eV was due to the carbonyl carbon (C=O) on GO.30 The XPS spectrum of
O1s of TMGO (Figure 5c) indicated the Fe−O bond in iron oxide at 529.7 eV, the hydroxyl group at 531.1 eV and the C−O bond at 532.3 eV, all observed on the TMGO surface. The XPS spectrum of N1s of TMGO (Figure 5d) showed Figure 2. FTIR spectra of (a) MN, (b) TMN, (c) GO and (d) TMGO.
Figure 3. Raman spectra of TMGO.
two peaks at 399.4 and 401.4 eV, which were attributed to the NH2 (amine) and O=C−N (amide) bonds in TMGO.31 It indicated the modification of amino groups on the materials was successful. Figure 5e showed the XPS spectrum of Fe2p of TMGO. The peaks at 723.2 and 710.1 eV were attributed to Fe3O4, while the peaks at 732.0 eV (Fe2O3),
724.6 eV (Fe2p1/2) and 711.7 eV (Fe2p3/2) were assigned
to Fe2O3.32 These peaks indicated the existence of Fe3O4
and Fe2O3 on TMGO.
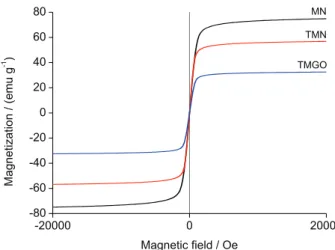
The magnetic properties of MN, TMN and TMGO were determined by VSM at room temperature. Figure 6 showed the saturation magnetization curves. The saturation
magnetization of MN was 74.9 emu g-1, whereas the
saturation magnetizations of TMN and TMGO were 56.7 and 32.4 emu g-1, respectively, which were lower than that
of MN. The decrease of saturation magnetizations after modification and combination could be contributed to the existence of non-magnetic materials.33 These features
of TMGO made the highly efficient magnetic separation available with ordinary external magnetic field.
Effect of pH
The pH of solution would affect the adsorption capacity of adsorbent and showed impact on the electrostatic interaction between dye and adsorbent surface. The effect of pH on the adsorption capacity of AR was studied in the range of 4 to 9 (Figure 7). As a result, the relative adsorption capacity reached maximum when pH was 6. At acidic pH region, the surface of adsorbent becomes highly positively charged due to increased protonation of the amine group. The amino cations of TMGO could interact with sulfonate anions of anionic dye by electrostatic adsorption.34 The optimum pH value was in
accordance with the reported research.35,36 Furthermore,
the lower adsorption of anionic dye at higher pH values could be attributed to the electrostatic repulsion between negatively charged adsorbents and anionic AR dye,37 and
the increasing competition for sites between OH- ions and
anionic dye ions.35
Adsorption kinetics
The adsorption kinetics of AR were shown in Figure 8a. In the first 45 min, the adsorption amount of AR apparently increased and then the increase trend slowed down. After 120 min, the adsorption reached equilibrium,
thus 120 min was selected as the adsorption time. The adsorption of AR was fitted with the pseudo-first-order and pseudo-second-order kinetic models. The results showed that the adsorption fitted well with pseudo-second-order kinetic equation (Figures 8b and 8c) and the correlation coefficient of fitting model reached 0.995, while the correlation coefficient of fitting pseudo-first-order model was 0.982. It could be suggested that pseudo-second-order model was the optimal candidate in explicating AR adsorption.
Adsorption isotherm
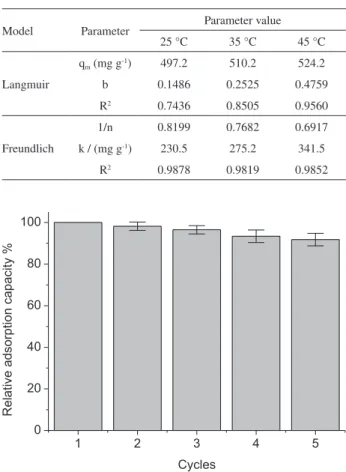
Adsorption isotherm was important for determining the adsorption behavior of an adsorbent. The isotherm data for the adsorption of AR on TMGO were fitted with the Langmuir and Freundlich models. Figure 9 showed the adsorption isotherm and the parameters of the Langmuir and Freundlich models were listed in Table 1. The adsorption capacity of AR at 45 °C reached 524.2 mg g-1. As shown
in Figure 9 and Table 1, the Freundlich Langmuir model fitted better than the Langmuir model. It demonstrated that the adsorption of AR on TMGO could be considered as a monolayer adsorption process.
Reusability of TMGO
The reusability of TMGO was shown in Figure 10. The relative adsorption capacity of TMGO decreased gradually during five cycle usage and the relative adsorption capacity of TMGO remained 91.8% after five cycles. The decrease in adsorption capacity might be caused by the incomplete desorption of dyes from TMGO and the loss of TMGO in repeated operations.38,39 The result indicated
that TMGO was a cost effective material for the removal of dyes.
Figure 6. Magnetization curves of MN (black), TMN (blue) and TMGO (red).
Figure 8. (a) Adsorption kinetics in aqueous solution of AR; (b) pseudo-first-order adsorption rates; (c) pseudo-second-order adsorption rates.
Figure 9. (a) Adsorption isotherms of AR with TMGO; (b) fitting by Langmuir model; (c) fitting by Freundlich model.
Conclusions
The TMGO was prepared and characterized in this study. The adsorption of AR for TMGO followed pseudo-second-order kinetics and the equilibrium data fitted well with the Freundlich isotherm model. TMGO showed satisfied reusability in five cycle adsorptions as well.
According to the performance of TMGO, it could become a promising material in removing dyes from water.
Acknowledgments
References
1. Saber-Samandari, S.; Saber-Samandari, S.; Joneidi-Yekta, H.; Mohseni, M.; Chem. Eng. J.2017, 308, 1133.
2. Nguyen-Le, M. T.; Lee, B. K.; Chem. Eng. J.2015, 281, 20.
3. Hahm, H.; Kim, S.; Ha, H.; Jung, S.; Kim, Y.; Yoon, M.; Kim, M.; CrystEngComm2015, 17, 8418.
4. Tripathi, B. P.; Dubey, N. C.; Stamm, M.; J. Hazard. Mater.
2013, 252-253, 401.
5. Wang, J.; Zhou, Q.; Song, D.; Qi, B.; Zhang, Y.; Shao, Y.; Shao, Z.; J. Sol-Gel Sci. Technol.2015, 76, 501.
6. Shen, J.; Li, Z.; Wu, Y. N.; Zhang, B.; Li, F.; Chem. Eng. J.
2015, 264, 48.
7. Son, B. H. D.; Mai, V. Q.; Du, D. X.; Phong, N. H.; Khieu, D. Q.; J. Chem.2016, 11.
8. Ozbay, N.; Yargic, A. S.; Yarbay-Sahin, R. Z.; Onal, E.; J. Chem.
2013, 2013, article ID 234904.
9. Wang, Y.; Li, Z.; Wang, J.; Li, J.; Lin, Y.; Trends Biotechnol.
2011, 5, 205.
10. Dikin, D. A.; Sasha, S.; Zimney, E. J.; Piner, R. D.; Dommett, G. H. B.; Guennadi, E.; Nguyen, S. B. T.; Ruoff, R. S.; Nature
2007, 448, 457.
11. Dreyer, R. D.; Park, S.; Bielawski, C. W.; Ruoff, R. S.; Chem. Soc. Rev.2010, 39, 228.
12. Ma, Y. X.; Li, Y. F.; Zhao, G. H.; Yang, L. Q.; Wang, J. Z.; Shan, X.; Yan, X.; Carbon2012, 50, 2976.
13. Gao, J.; Gu, H.; Xu, B.; Acc. Chem. Res.2009, 42, 1097. 14. Ahalya, K.; Suriyanarayanan, N.; Priyadharsini, N.; Nanosci.
Nanotechnol. Lett.2015, 7, 134.
15. Ning, F. J.; Qiu, T. T.; Wang, Q.; Peng, H. L.; Li, Y. B.; Wu, X. Q.; Zhang, Z.; Chen, L. X.; Xiong, H.; Food Chem.2017, 221, 1797.
16. Sun, B. L.; Gou, Y. Q.; Ma, Y. L.; Zheng, X. P.; Bai, R. B.; Abdelmoaty, A. A. A.; Hu, F. D.; Biosens. Bioelectron.2017, 88, 55.
17. Fan, J. P.; Liao, D. D.; Xie, Y. L.; Zheng, B.; Yu, J. X.; Cao, Y. H.; Zhang, X. H.; Peng, H. L.; J. Appl. Polym. Sci.2017, 134, 9.
18. Liu, J.; Wang, H. J.; Li, X. C.; Jia, W. H.; Zhao, Y. P.; Ren, S. L.; Fuel2017, 189, 79.
19. Marcano, D. C.; Kosynkin, D. V.; Berlin, J. M.; Sinitskii, A.; Sun, Z.; Slesarev, A.; Alemany, L. B.; Lu, W.; Tour, J. M.; ACS Nano2010, 4, 4806.
20. Sivashankar, R.; Sathya, A. B.; Krishnakumar, U.; Sivasubramanian, V.; Ecotoxicol. Environ. Saf.2015, 121, 149. 21. Jiao, F.; Yu, J.; Song, H.; Jiang, X.; Yang, H.; Shi, S.; Chen, X.;
Yang, W.; Appl. Clay Sci.2014, 101, 30.
22. Chakraborty, P.; Nagarajan, R.; Appl. Clay Sci.2015, 118, 308. 23. Bhadra, M.; Roy, S.; Mitra, S.; Desalination2016, 378, 37. 24. Liu, S.; Yu, B.; Zhang, T.; J. Mater. Chem. A2013, 1, 13314. 25. Xu, Y.; Bai, H.; Lu, G.; Li, C.; Shi, G.; J. Am. Chem. Soc.2008,
130, 5856.
26. Jin, Y.; Huang, S.; Zhang, M.; Jia, M.; Synth. Met.2013, 168, 58.
27. Ning, F.; Qiu, T.; Wang, Q.; Peng, H.; Li, Y.; Wu, X.; Zhang, Z.; Chen, L.; Xiong, H.; Food Chem.2017, 221, 1797. 28. Pakapongpan, S.; Poo-arporn, R. P.; Mater. Sci. Eng. C2017,
76, 398.
29. Sahraei, R.; Sekhavat Pour, Z.; Ghaemy, M.; J. Cleaner Prod.
2017, 142, 2973.
30. Ma, Y. X.; Xing, D.; Shao, W. J.; Du, X. Y.; La, P. Q.; J. Colloid Interface Sci.2017, 505, 352.
31. Lu, Z.; Yu, J.; Zeng, H.; Liu, Q.; Sep. Purif. Technol.2017, 183, 249.
32. Yang, Y.; Hu, X.; Zhao, Y.; Cui, L.; Huang, Z.; Long, J.; Xu, J.; Deng, J.; Wu, C.; Liao, W.; J. Colloid Interface Sci.2017, 495, 68.
33. Eslaminejad, T.; Nematollahi-Mahani, S. N.; Ansari, M.; J. Magn. Magn. Mater.2016, 402, 34.
34. Zhang, Y. R.; Su, P.; Huang, J.; Wang, Q. R.; Zhao, B. X.; Chem. Eng. J.2015, 262, 313.
35. Song, W.; Gao, B.; Xu, X.; Xing, L.; Han, S.; Duan, P.; Song, W.; Jia, R.; Bioresour. Technol.2016, 210, 123.
Figure 10. Reusability of TMGO.
Table 1. Isotherm parameters for the adsorption of AR
Model Parameter Parameter value
25 °C 35 °C 45 °C
Langmuir
qm (mg g
-1) 497.2 510.2 524.2
b 0.1486 0.2525 0.4759
R2 0.7436 0.8505 0.9560
Freundlich
1/n 0.8199 0.7682 0.6917
k / (mg g-1) 230.5 275.2 341.5
36. Wang, S.; Zhai, Y. Y.; Gao, Q.; Luo, W. J.; Xia, H.; Zhou, C. G.; J. Chem. Eng. Data2014, 59, 39.
37. Saratale, R. G.; Sivapathan, S. S.; Jung, W.; Kim, H. Y.; Saratale, G. D.; Kim, D. S.; J. Environ. Sci. Health, Part A2016, 51, 164. 38. Yu, S.; Zhai, L.; Wang, Y.; Liu, X.; Xu, L.; Cheng, L.; J. Environ.
Chem. Eng.2015, 3, 752.
39. Jiang, T.; Liang, Y. D.; He, Y. J.; Wang, Q.; J. Environ. Chem. Eng.2015, 3, 1740.
Submitted: June 14, 2017
Published online: August 2, 2017