Article
Printed in Brazil - ©2017 Sociedade Brasileira de Química0103 - 5053 $6.00+0.00
*e-mail: [email protected]
Magnetic Solid-Phase Extraction in Combination with Ultra High-Performance
Liquid Chromatography-Tandem Mass Spectrometry Analysis: Quantification of
Risperidone and 9-Hydroxyrisperidone in Biological Samples
Qinhong Yin,a,b,c Yanqin Zhub,d and Yaling Yang*,b
aFaculty of Environmental Science and Engineering and bFaculty of Life Science and Technology,
Kunming University of Science and Technology, Kunming, 650500 Yunnan, China
cKunming Jida Pharmaceutical Co., Ltd, Kunming, 650106 Yunnan, China
dResearch Center for Analysis and Measurement, Kunming University of Science and Technology,
Kunming, 650093 Yunnan, China
Oleic acid modified Fe3O4 nanoparticles were proposed for magnetic solid-phase extraction
coupled with ultra high-performance liquid chromatography-tandem mass spectrometry to determine risperidone (RISP) and 9-hydroxyrisperidone (9OHR) in biological samples. The effects of various experimental parameters including adsorbent amount, pH, adsorption time, eluent type and concentration were systematically investigated. Under optimal conditions, the calibration curve was linear within the concentration range of 0.2-200 ng mL-1 with the correlation coefficient (r)
of 0.9962 and the lower limit of quantification was 0.06 ng mL-1 for RISP; the calibration curve
was linear within the concentration range of 0.2-200 ng mL-1 with the correlation coefficient of
0.9956 and the lower limit of quantification was 0.04 ng mL-1 for 9OHR. The extraction recoveries
were over 90.0% with relative standard deviation less than 5.0%. All these results suggested that magnetic extraction method can be used for enrichment and quantification of RISP and 9OHR in biological samples.
Keywords: risperidone, 9-hydroxyrisperidone, magnetic solid-phase extraction, biological
sample, UPLC-MS/MS
Introduction
Since their introduction 60 years ago, antipsychotics have been widely applied in clinical psychiatry, as a first-line treatment for schizophrenia. Risperidone (RISP)1 is an effective benzisoxazole psychosolytic drug used in the treatment of schizophrenia, psychotic disorders, autism and other psychiatric illnesses.2-4 It was confirmed that the 9-hydroxylation of RISP could happen under the catalysis of cytochrome P450 (CYP).5 RISP is well absorbed by the human body and easily metabolized to 9-hydroxyrisperidone (9OHR) that has a similar pharmacological activity as RISP.6,7
To date, several literatures have been reported different detection methods of RISP and 9OHR in biological samples by the use of high-performance liquid chromatography with ultraviolet detection (HPLC-UV),8,9
high-performance liquid chromatography with diode array detection (HPLC-DAD),10 liquid chromatography
with electrochemical detection (LC-EC),11 liquid
chromatography with coulometric detection (LC-CD),12 high-performance liquid chromatography-tandem mass spectrometry (HPLC-MS/MS),13-15 time-of-flight mass
spectrometers (TOF-MS),16 and ultrahigh pressure
liquid chromatography with photodiode array detection (UPLC-PDA).17 Because of complex pretreatment steps and time-consuming properties, some of these methods are not very suitable for clinical studies, such as liquid-liquid extraction (LLE),8,13,15,16 solid phase extraction (SPE)9,10,11,14 and microextraction by packed sorbent (MEPS).12,17 Base on the interference of the complex metabolites and complicated pretreatments in biological samples, the determination of RISP and 9OHR by an appropriate adsorbent material for the enrichment is necessary.
of their unique and alluring properties, such as excellent mechanical stiffness, nanoscale size and high specific surface area. Furthermore, the magnetic materials of MNPs as adsorbents have excellent magnetic response in comparison with traditional adsorbents and can be applied to many different fields such as chemical separation and analytical technique.18-21 Without hazardous solvent extraction and additional evaporation, magnetic solid-phase extraction (MSPE) makes the separation operations convenient and efficient. Oleic acid is a kind of surfactant and does not dissolve in water. Carboxylic acid head group of oleic acid can become an appendage and improve dispersibility of Fe3O4 MNPs.22
To the best of our knowledge, magnetic solid phase extraction of RISP and 9OHR from biological samples has not been reported till date. In the present study, oleic acid modified Fe3O4 nanoparticles (Fe3O4@OA) were used for effective adsorption and rapid determination of RISP and 9OHR in human plasma and saliva. Besides that, the effects of various experimental parameters were systematically validated by single factor design and extraction recovery RISP and 9OHR. The results indicated that the proposed method using Fe3O4@OA as an adsorbent exhibited good accuracy and repeatability in the extraction of biological samples.
Experimental
Chemicals and reagents
FeCl3·6H2O (99.0%, m/m) was bought from Zhiyuan Chemical Factory (Tianjin, China). (NH4)2Fe(SO4)2·6H2O was obtained from Guanghua Sci-Tech Co., Ltd (Guangdong, China). Oleic acid was supplied by Aladdin biological technology Co., Ltd (Shanghai, China). The other chemicals and reagents in these experiments, such as ammonia solution (25%, m/m), ethanol (C2H5OH), hydrochloric acid (36.0-38.0%, m/m) and sodium hydroxide (NaOH) were analytical grade. RISP standard was provided by National Institutes for Food and Drug Control (Beijing, China). 9OHR standard was purchased from Toronto Research Chemicals Inc. (Ontario, Canada). Acetonitrile and methanol of HPLC grade were obtained from Merck (Darmstadt, Germany). Double-distilled water was purified with a Milli-Q purification system (Millipore, Bedford, MA, USA).
Apparatus
Fourier transform infrared (FTIR) measurements in the range 4000-400 cm-1 were carried on a Shimadzu
IRAffinity-1S Fourier transform infrared spectrophotometer by KBr disk. In addition, X-ray diffraction (XRD) analysis of Fe3O4@OA were recorded on a Rigaku D/max 2200 powder diffract meter (Tokyo, Japan) with Cu Kα
radiation (40 kV, 35 mA). A JEM-100CXII (Japan Electronics) transmission electron microscopy (TEM) instrument was used to analyze the size and morphology of magnetic nanoparticles. The pH values of suspensions were determined with a digital pH-meter model PHS-3 (Shanghai, China) adjusted with hydrochloric acid or sodium hydroxide solutions.
UPLC-MS/MS conditions
Chromatographic analysis and quantitative evaluation were performed using a Waters ACQUITY UPLC system (Waters, Milford, MA) which was consist of a controller, two pumps including a degasser and an autosampler. The target analytes were detected using a Xevo TQD with MasslynxTM software (version 4.1). The chromatographic separation was achieved on Waters ACQUITY UPLC BEH C18 column (50 × 2.1 mm, 1.7 µm). The column temperature was kept at 40 ºC and a small injection volume of 1 µL was recommended. The isocratic mobile phase consisted of acetonitrile-0.1% formic acid (15:85, v/v).
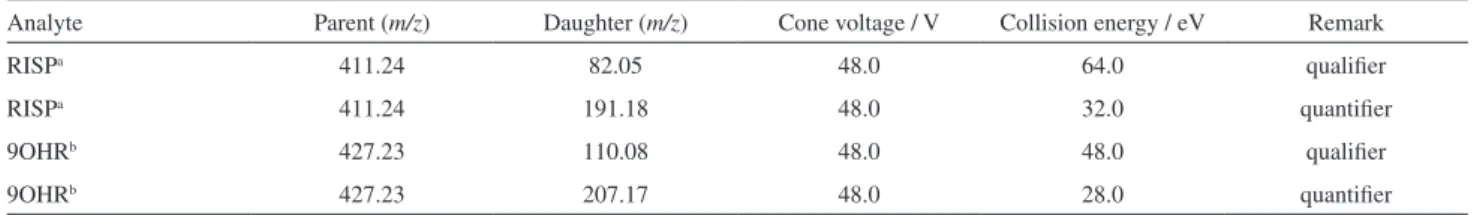
The samples were analyzed with an electrospray ionization set in the positive ionization mode (ESI+). Nitrogen was used as nebulization and desolvatation gas. The multi-reaction monitoring (MRM) mode was operated by the dependent scan which was an enhanced product ion scan. The two resulting transitions and setting for ultra high-performance liquid chromatography-tandem mass spectrometry (UPLC-MS/MS) system are shown in Table 1. In order to exploit maximum sensitivity for identification and detection of target analytes, the specific parameters were set to 0.5 kV capillary voltage, 46 V cone voltage, 500 ºC source desolvation temperature, 1000 L h-1 source desolvation gas flow and 50 L h-1 cone gas flow.
Preparation of standard solutions and real samples
for blood and saliva samples involves analogous steps. For the plasma preparation, 5 mL of blood samples were added ethylenediaminetetraacetic acid (EDTA) as anticoagulant and centrifuged at 2000 rpm for 5 min, then the supernatant solution was transferred to 5 mL volumetric flask and diluted with water to volume prior to MSPE procedure. For the saliva samples, 5 mL saliva was centrifuged at 3000 rpm for 5 min to eliminate the complex interference. The amount of sediment obtained after centrifugation of the saliva is about 23-28 mg. Before the adsorption, the supernatant was collected and further diluted to 5 mL with water.
Preparation of Fe3O4@OA nanoparticles
Synthesis of the magnetic nanoparticles was operated according to the previous literatures with some modifications.23 The Fe3O4@OA were oleic acid functionalized as follows: 10 g of (NH4)2Fe(SO4)2·6H2O and 14 g of FeCl3·6H2O were cast onto 200 mL of deionized water with continuously mixing, and then heated up to 80 ºC under the protection of nitrogen. Next, 25 mL of ammonia solution (25%) and 5 mL of oleic acid were dropped onto the solution as described above. After reaction for 2 h, the black precipitate was collected with the aid of an external supermagnet by washing five times using deionized water and ethanol. The Fe3O4@OA was dried under vacuum at 50 ºC for 12 h.
MSPE procedure
An aliquot of sample solution according to the following steps: (i) aliquot 5 mL samples were added into 10 mL polypropylene tube; (ii) 25 mg Fe3O4@OA adsorbent was placed slowly into the solution; (iii) after stirring gently for 1 min and adjusting pH value, the suspension was stationary kept for 6 min; (iv) Fe3O4@OA were gathered with a strong magnet and the clear supernatant was carefully discarded; (v) in order to elutetarget analytes, 0.2 mL of methanol was gently dropped onto the magnetic sorbents, then Fe3O4@OA were separated by the magnetic field; (vi) after filtration through a 0.22 µm membrane, the supernatant containing the target analytes was detected by UPLC-MS/MS.
Results and Discussion
Characterization results
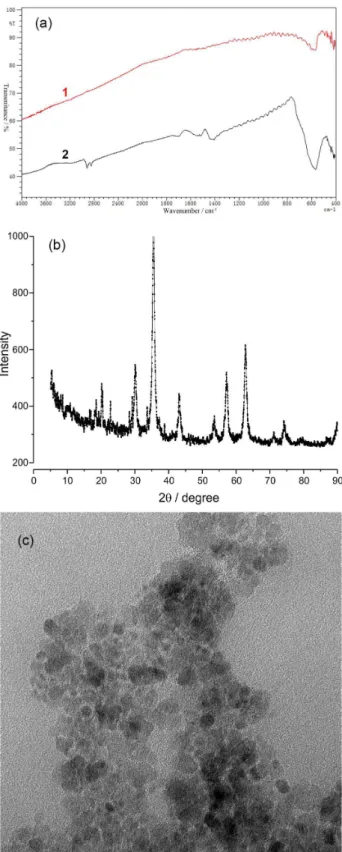
FTIR spectrum absorption peaks of Fe3O4@OA were shown in Figure 1a. The strong and broad band around 3415 cm-1 is attributed to the stretching mode of –OH in oleic acid. Sharp characteristic peaks of 2858 and 2920 cm-1 is associated with the stretching vibration of −C−H− in the −COOH groups. Absorption peaks at
1398 and 1638 cm-1 are due to the O−H, C–O and C=O group stretching vibration. The FTIR spectrum of the Fe3O4@OA nanocomposite contains the characteristic peaks of Fe–O at 584 cm-1. The results of FTIR have shown that oleic acid was successfully anchored onto Fe3O4 NPs.24-28
The XRD result is consistent with the expected composition of the synthesized Fe3O4@OA (Figure 1b). The peaks with 2θ at 30.06, 35.56, 43.08, 53.54, 57.10 and 62.74° classified the Fe3O4 nanoparticles as having the cubic spinel structure. The X-ray diffraction pattern of the modified nanoparticles was similar to the pattern of the unmodified material in the published literatures, illustrating that the structure of Fe3O4 was not changed in the modification.29-31
The size and morphology of a dispersion of oleic acid-coated particles was further investigated by TEM images. Figure 1c presents the TEM images of Fe3O4@OA, clearly revealing irregular spherical shape with a distribution size of between 10 and 18 nm. Furthermore, this preliminarily implies that the oleic acid layer successfully attached on the surface of the magnetic nanoparticles.
Optimization of the MSPE procedure
The effects of various experimental parameters including adsorbent amount, pH, adsorption time, eluent type and concentration and adsorbent reusability on the recovery of RISP and 9OHR were systematically investigated. All experiments were performed in triplicate by varying a parameter on the retention efficiency.
Table 1. The three resulting MRM transitions and corresponding settings
Analyte Parent (m/z) Daughter (m/z) Cone voltage / V Collision energy / eV Remark
RISPa 411.24 82.05 48.0 64.0 qualifier
RISPa 411.24 191.18 48.0 32.0 quantifier
9OHRb 427.23 110.08 48.0 48.0 qualifier
9OHRb 427.23 207.17 48.0 28.0 quantifier
Effect of adsorbent amount
To test the effect of the adsorbent dosage, various amounts of magnetic Fe3O4@OA from 5 to 35 mg were
added into sample solution containing 200 ng mL-1
analytes. The results in Figure 2 indicated that the recoveries of the two analytes were greater than 90.0% by using 25 mg of magnetic nanoparticles and with the continued increase of adsorbent amount the recovery rate did not increased significantly. Based on the concentration of RISP and 9OHR in real samples below 200 ng mL-1, 25 mg magnetic nanoparticles should be suitable to linear range of concentration 0.2-200 ng mL-1. Consequently, the adsorbent dosage was maintained at 25 mg in all the subsequent experiments.
Effect of solution pH
Solution pH plays an important role for the adsorption of the analytes and the analytes should be electrically neutral so that it can be efficiently adsorbed and the adsorption unaffected by charges on the surface of the sorbent. To study the effect of the sample pH, the pH values were adjusted in a range between 3 and 10 by 0.1 mol L-1 HCl or NaOH solution. As can be seen in Figure 3, the adsorption efficiency increased as the pH of sample solution rise from 2 to 7, and then decreased from 8 to 10. Maximum adsorption of RISP and 9OHR occurred over the pH range 7-8. However, the recoveries of the two analytes
Figure 1. (a) FTIR spectra of Fe3O4 (1) and Fe3O4@OA (2); (b) XRD
patterns of Fe3O4@OA; (c) TEM-images of synthesized Fe3O4@OA.
Figure 3. Effect of pH.
were decreased slightly from pH 8 to 10. Thus, pH = 7 was chosen for further studies.
Effect of adsorption time
The amount of extracted analytes by the sorbent is closely related to adsorption time as well as amount of sorbent. The effect of adsorption times in range of 1 to 12 min was examined. The adsorption experiments were carried out at different time intervals, that is 1, 2, 4, 6, 8, 10 and 12 min, separately and respectively. The Figure 4 shows that the recoveries of RISP and 9OHR increased with increasing extraction time up to 6 min and then remained constant up to 12 min. Hence, 6 min was sufficient for achieving satisfactory extraction efficiency and could meet the requirements of rapid analysis.
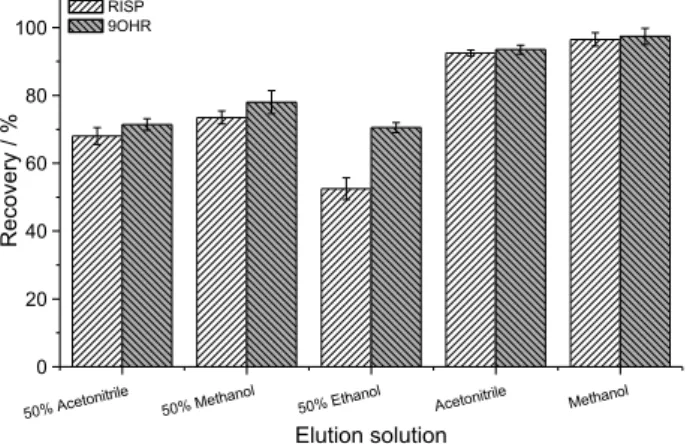
Effect of type and volume of eluent solvent
The selection of eluent solvent is crucial for the MSPE procedure. In our study, five common organic solvents alone or in mixture including 50% acetonitrile (v/v), 50% methanol (v/v), 50% ethanol (v/v), acetonitrile (HPLC grade) and methanol (HPLC grade) were investigated. The results reveal that the better recoveries were obtained using methanol, which was due to the higher solubility of methanol than other solvents (Figure 5). The effect of eluent volume from 0.1 to 0.5 mL in the interval of 0.1 mL was also observed, and 0.25 mL of methanol is adopted as the optimum eluent solvent in the follow-on experiments.
Reusability of the adsorbent
In sorption-based investigations, sorbent reusability is economically assumed as a fundamental feature, whereby the spent sorbent could be reused several times. To assess the regeneration capacity, the sorbents of Fe3O4@OA were washed with methanol and utilized again to fulfill the next sorption circle. As can be seen in Figure 6, it appears that the
sorption recovery after 4 cycles of sorption and desorption is more than 90.0%. As a consequence, it is possible to reuse the magnetic nanoparticles without obvious change in its sorption behavior up to 4 cycles.
Adsorption capacity and enrichment factor
The adsorption capacity of magnetic nanoparticles was calculated by applying the optimized MSPE (25 mg of Fe3O4@OA) to 25 mL standard solutions containing 2 mg mL-1 RISP and 9OHR, respectively. The sorbent was separated via external magnet and the concentration of retained analyte in the supernatant solution was determined. The adsorption capacity (maximum amount retained from 1 g of material) was therefore calculated to be 3.84 and 6.60 mg g-1 for RISP and 9OHR, respectively. The enrichment factor calculated as the ratio of slope of preconcentrated sample to that obtained without preconcentration was about 24.
Analytical performance
Analytical performance of the developed procedure is plotted in Table 2. Calibration curves via plotting
Figure 4. Effect of the adsorption time.
Figure 6. Effect of reuse times.
peak intensity of each concentration versus associated concentrations of the analytes were obtained. The method was linear in the range from 0.2 to 200 ng mL-1, giving a correlation coefficient (R2) always higher than 0.995. The limits of quantification (LOQ) for RISP and 9OHR (0.20 and 0.14 ng mL-1, respectively) was achieved with the blood samples. Repeatability as intra and inter-day variability was evaluated by calculating the relative standard deviation (RSD, %) for the replicated measurements (n = 6). These obtained data (in Table 3) were higher than 92.0% for the mean accuracy and lower than 4.6% for RSD for three spiked concentrations. The results shown that the MSPE method based on new magnetic sorbent is a sensitive, efficient and reliable with good analytical parameters in isolation of RISP and 9OHR from biological samples.
Analysis of real samples
Applicability of the developed MSPE procedure was investigated for analysis of different real samples including two human plasma and two saliva samples. The results summarized in Table 4 show that the RISP of recovery range from 93.2 to 97.4% and the 9OHR of recoveries range from 91.8 to 99.2% were satisfactorily obtained using the proposed
method. The Figure 7 presents the MS chromatograms obtained from blank and real samples. All peaks of analytes were easily discriminated and fully separated, since no conspicuous interference of matrix components was observed in the quantitative analysis of RISP and 9OHR.
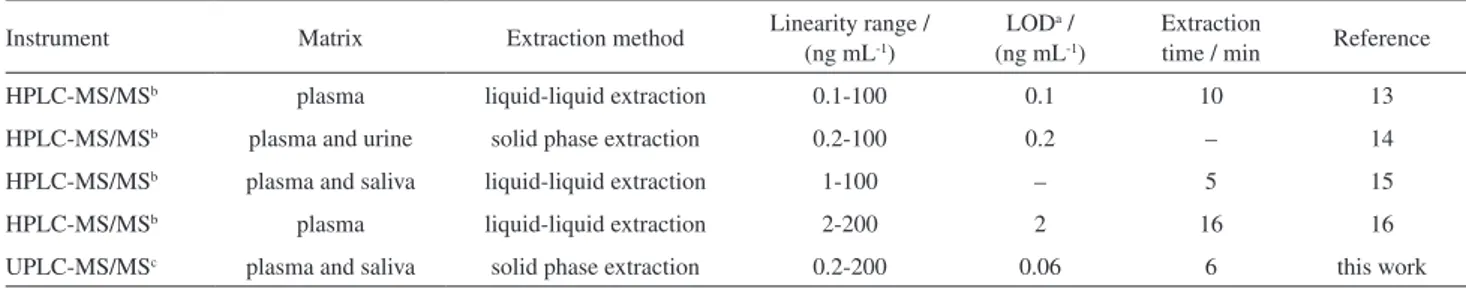
Table 5 compares analytical data between the proposed method and other existing methods for analysis of the analytes. The comparison of results showed that the proposed method has lower LOD and less extraction time with other reported methods.
Conclusions
In current study, an easy and fast analytical method based on MSPE combined with UPLC-MS/MS has been developed. Oleic acid modified Fe3O4 nanoparticles (Fe3O4@OA) were firstly used as sorbent of MSPE and successfully applied to the extraction and preconcentration of RISP and 9OHR. Under optimal conditions, the developed MSPE-UPLC-MS/MS method exhibited good precision and low LOD within a short operation time. It confirmed that the proposed method can be considered as a promising procedure for selective and rapid enrichment of RISP and 9OHR from biological samples.
Table 2. Analytical performance data for analytes by the MSPE technique (n = 6)
Analyte Calibration equation Linear range /
(ng mL-1) R2 RSDa / %
LODb /
(ng mL-1)
LOQc /
(ng mL-1)
Enhancement factor
RISPd Y = 76493X − 39593 0.2-200 0.9962 3.4 0.06 0.20 23.6
9OHRe Y = 83353X – 35556 0.2-200 0.9956 2.5 0.04 0.14 24.2
aRSD: relative standard deviation; bLOD: limit of detection; cLOQ: limit of quantitation; dRISP: risperidone; e9OHR: 9-hydroxyrisperidone.
Table 3. Precision for the detection of analytes in plasma and saliva samples
Matrix Analyte Spiked /
(ng mL-1)
Inter-day (n = 6) Intra-day (n = 6)
Mean accuracy / % RSDa / % Mean accuracy / % RSDa / %
Plasma
RISPb
10 92.9 4.2 93.8 3.7
50 95.7 3.8 94.2 1.7
200 96.1 2.6 97.3 2.5
9OHRc
10 94.8 2.3 97.2 4.5
50 96.5 3.5 96.0 2.9
200 98.3 4.6 94.5 3.0
Saliva
RISPb
10 94.1 3.5 92.3 2.4
50 96.2 1.8 92.0 2.5
200 93.5 2.7 95.1 1.6
9OHRc
10 97.0 2.5 94.7 2.2
50 96.4 4.3 95.6 3.7
200 98.9 3.4 95.4 2.8
Figure 7. Mass chromatograms of blank and real samples (a) blank plasma sample; (b) plasma sample; (c) blank saliva sample; (d) saliva sample.
Table 4. Recovery for analytes from plasma and saliva samples
Matrix
RISPa 9OHRb
Added / (ng mL-1)
Found /
(ng mL-1) Recovery / % RSD
c / % Added /
(ng mL-1)
Found /
(ng mL-1) Recovery / % RSD c / %
Plasma 1
– 17.47 – – – 37.30 – –
10 26.85 93.8 4.3 10 46.82 95.2 4.6
50 65.74 96.5 2.5 50 85.41 96.2 4.1
200 208.42 95.5 2.3 200 234.59 98.6 3.2
Plasma 2
– 5.16 – – – 25.38 – –
10 14.48 93.2 3.8 10 34.56 91.8 3.8
50 52.75 95.2 3.0 50 72.70 94.6 4.5
200 197.47 96.2 1.7 200 198.23 94.5 4.0
Saliva 1
– 14.66 – – – 25.74 – –
10 23.15 94.9 3.4 10 35.34 96.0 3.3
50 60.24 93.2 3.5 50 72.91 94.3 3.7
200 208.42 97.4 2.9 200 224.09 99.2 2.8
Saliva 2
– 2.35 – – – 18.61 – –
10 11.76 94.1 3.7 10 28.35 97.4 3.5
50 49.04 93.4 2.8 50 65.76 94.3 2.7
200 195.57 96.6 2.6 200 211.38 96.4 4.3
Acknowledgments
This research was supported by the Analysis Test Research Center of Kunming University of Science and Technology, Yunnan Province, China.
References
1. Healy, D.; Psychiatric Drugs Explained; Churchill Livingstone: Edinburgh, UK, 2009.
2. Chouinard, G.; Arnott, W.; Can. J. Psychiatry1993, 38, 89. 3. Chouinard, G.; Jones, B.; Remington, G.; Bloom, D.;
Addington, D.; MacEwan, G. W.; Labelle, A.; Beuclair, L.; Arnott, W.; J. Clin. Phsychopharmacol. 1993, 13, 25. 4. Gopal, S.; Steffens, D. C.; Kramer, M. L.; Olsen, M. K.; J. Clin.
Psychiatry 2005, 66,1016.
5. Fang, J.; Bourin, M.; Baker, G. B.; Naunyn-Schmiedeberg’s Arch. Pharmacol. 1999, 359, 147.
6. Beijsterveldt, L. E. C.; Geerts, R. J. F.; Leysen, J. E.; Megens, A. A. H. P.; Eynde, H. M. J. V.; Meuldermans, W. E. G.; Heykants, J. J. P.; Psychopharmacology1994, 114, 53.
7. Heykants, J.; Huang, M. L.; Mannens, G.; Meuldermans, W.; Snoeck, E.; Van, B. L.; Van, P. A.; Woestenborghs, R.; J. Clin. Psychiatry1994, 55, 13.
8. Shen, Y. L.; Wu, H. L.; Ko, W. K.; Wu, S. M.; Anal. Chim. Acta 2002, 460, 201.
9. Kirschbaum, K. M.; Finger, S.; Vogel, F.; Burger, R.; Gerlach, M.; Riederer, P.; Hiemke, C.; Chromatographia2008, 67, 321. 10. Raggi, M. A.; Bugamelli, F.; Sabbioni, C.; Saracino, M. A.;
Petio, C.; J. Sep. Sci.2005, 28, 245.
11. Locatelli, I.; Mrhar, A.; Grabnar, I.; J. Pharm. Biomed. Anal.
2009, 50, 905.
12. Saracino, M. A.; Palma, A. D.; Boncompagni, G.; Raggi, M. A.; Talanta2010, 81, 1547.
13. Aravagiri, M.; Marder, S. R.; J. Mass Spectrom. 2000, 35, 718. 14. Meulder, M. D.; Remmerie, B. M. M.; Vries, R.; Sips, L. L. A.;
Boom, S.; Hooijschuur, E. W. J.; Merbel, N. C.; Timmerman, P. M. M. B. L.; J. Chromatogr. B: Anal. Technol. Biomed. Life Sci. 2008, 870, 8.
Table 5. Comparison of LC-MS/MS used in determination of analytes
Instrument Matrix Extraction method Linearity range /
(ng mL-1)
LODa /
(ng mL-1)
Extraction
time / min Reference
HPLC-MS/MSb plasma liquid-liquid extraction 0.1-100 0.1 10 13
HPLC-MS/MSb plasma and urine solid phase extraction 0.2-100 0.2 – 14
HPLC-MS/MSb plasma and saliva liquid-liquid extraction 1-100 – 5 15
HPLC-MS/MSb plasma liquid-liquid extraction 2-200 2 16 16
UPLC-MS/MSc plasma and saliva solid phase extraction 0.2-200 0.06 6 this work
aLOD: limit of detection; bHPLC-MS/MS: high-performance liquid chromatography-tandem mass spectrometry; cUPLC-MS/MS: ultra high-performance
liquid chromatography-tandem mass spectrometry.
15. Flarakos, J.; Luo, W.; Aman, M.; Svinarov, D.; Gerber, N.; Vouros, P.; J. Chromatogr. A 2004, 1026, 175.
16. Williamson, L. N.; Zhang, G.; Terry, A. V.; Bartlett, M. G.; J. Liq. Chromatogr. Relat. Technol.2008, 31, 2737.
17. Gonçalves, J. L.; Alves, V. L.; Conceição, C. J. F.; Teixeira, H. M.; Câmara, J. S.; Microchem. J. 2015, 123, 90.
18. Su, S. W.; Liao, Y. C.; Whang, C. W.; J. Sep. Sci. 2012, 35, 681. 19. Yin, Q.; Zhu, Y.; Ju, S.; Yang, Y.; Res. Chem. Intermed. 2016,
42, 4985.
20. Chatterjee, J.; Haik, Y.; Chen, C.; J. Magn. Magn. Mater. 2001,
225, 21.
21. Jordan, A.; Scholz, R.; Wust, P.; Fahling, H.; Felix, R.; J. Magn. Magn. Mater. 1999, 201, 413.
22. Shete, P. B.; Patil, R. M.; Tiwale, B. M.; Pawar, S. H.; J. Magn. Magn. Mater. 2015, 377, 406.
23. Lee, S. Y.; Harris, M. T.; J. Colloid Interface Sci. 2006, 293, 401.
24. Lan, Q.; Liu, C.; Yang, F.; Liu, S.; Xu, J.; Sun, D.; J. Colloid Interface Sci. 2007, 310, 260.
25. Wu, N.; Fu, L.; Su, M.; Aslam, M.; Wong, K. C.; Dravid, V. P.;
Nano Lett.2004, 4, 383.
26. Lobato, N. C. C.; Ferreira, A. M.; Mansur, M. B.; Sep. Purif. Technol. 2016, 168, 93.
27. Li, Y.; Ma, F.; Su, X.; Sun, C.; Liu, J.; Sun, Z.; Hou, Y.; Catal. Commun. 2012, 26, 231.
28. Xu, Z.; Shen, C.; Hou, Y.; Gao, H.; Sun, S.; Chem. Mater. 2009,
21, 1778.
29. Ju, S.; Liu, M.; Yang, Y.; Anal. Lett. 2016, 49, 511.
30. Alveroglu, E.; Sozeri, H.; Baykal, A.; Kurtan, U.; Senel, M.; J. Mol. Struct. 2013, 1037, 361.
31. Demir, A.; Baykal, A.; Sozeri, H.; Topkaya, R.; Synth. Met.
2014, 187, 75.
Submitted: November 23, 2016