MSc Thesis
Supervisor: Prof. Lucas F. M. da Silva
Co-supervisor: Eng. Eduardo Marques
Faculdade de Engenharia da Universidade do Porto
Mestrado Integrado em Engenharia Mecânica
I
.
Abstract
The work developed in this dissertation focuses on the development of an adhesive joint for aerospace applications. Single adhesive joints and mixed-adhesive joints using two adhesives were developed, analysed and tested.
To improve the strength of the adhesive joints used to fix ceramic tiles to the aerospace vehicle structure in large temperature and pressure amplitudes, several adhesive joints were produced using as adhesives the silicone RTV 106 and the epoxy XN 1244 and as adherent the aluminium 6063-T6 and the cordierite (ceramic).
The silicone RTV is currently used in aerospace industry, so it was the starting point for the strength analysis. Aiming to increase the silicone RTV strength, a study of the joint strength using a high strength adhesive as the epoxy XN 1244 was performed.
Mixed-adhesive joints with the two adhesives were developed intending to obtain adhesive joints that can have good behaviour when used at extreme temperatures. To analyse the joint strength, shear testing at room temperature and high temperatures was performed. The results are shown in load-displacement curves and discussed.
Using finite element software, ABAQUS, the stress distribution in the adhesive layer for several kinds of joints was numerically analysed. Stress distribution curves along the bondline length were obtained and used to understand the experimental results.
II. Resumo
O trabalho desenvolvido nesta dissertação foca-se no desenvolvimento de juntas adesivas destinadas a aplicação aeroespacial. Juntas simples e mistas usando dois adesivos foram desenvolvidas, analisadas e testadas.
De forma a aperfeiçoar a resistência das juntas usadas para fixar placas cerâmicas à estrutura dos veículos aeroespaciais em variadas condições de temperatura e pressão, foram testadas várias juntas adesivas usando como adesivos o silicone RTV 106 e o epóxido XN 1244 e como aderentes o alumínio 6063-T6 e a cordierite (cerâmica).
O silicone RTV é um adesivo actualmente utilizado na indústria aeroespacial, tendo sido por isso o ponto de partida para a análise de resistência. Pretendendo obter maiores resistências que as oferecidas pelo silicone RTV, procurou-se estudar a resistência da junta com um adesivo de alta resistência como o epóxido XN 1244. Juntas com combinação dos dois adesivos foram desenvolvidas com intenção de obter juntas que, apesar de conterem adesivos com propriedades diferentes, poderão exibir boa resistência quando utilizadas a temperaturas extremas.
Para analisar a resistência das juntas, estas foram solicitadas ao corte à temperatura ambiente e a altas temperaturas. Os resultados são apresentados sob a forma de gráficos de força em função do deslocamento.
Com recurso ao software de elementos finitos, ABAQUS, foi analisada numericamente a distribuição de tensões no adesivo em variados tipos de juntas ao longo do comprimento da junta e assim de alguma forma entender os resultados experimentais obtidos.
III. Acknowledgements
I would like to thank:Professor Lucas da Silva for his guidance giving me the possibility to work in this project (FCT PTDC/EME-PME/67022/2006) and also for his attention and help provided to solve the problems encountered.
Fundação para a Ciência e Tecnologia scholarship which financially greatly helped me.
Eng. Eduardo Marques for his guidance and support in all tasks done along this project.
Laboratório de Ensaios Tecnológicos (LET) for the available equipment and help with the experimental preparation and execution, particularly Eng. Miguel Figueiredo, Eng. Rui Martins and Mr. José Francisco Moreira.
All the adhesives group members who helped me every time I needed.
My family, particularly my parents, who supported me in all moments, especially in the more difficult occasions.
IV. Index
I. Abstract ... 3
II. Resumo ... 4
III. Acknowledgements ... 5
IV. Index ... 6
III. Figure index ... 9
IV. Table index ... 14
1. Objectives ... 15
2. Introduction... 15
3. Literature review ... 16
3.1 Adhesive applications and characteristics... 16
3.2. Mixed adhesive joints... 21
3.3. High temperature adhesives ... 23
3.4. Silicone adhesives... 24 3.5. Epoxy adhesives... 25 3.6. Adherends... 27 3.7. Metal-ceramic adhesion... 28 3.8. Surface preparation... 28
4. Experimental details... 30
4.1. Materials... 30 4.2. Thermal experiment ... 32 4.2.1. Joint geometry... 33 4.2.2. Testing procedure... 34i. Test configuration I... 36
iii. Test configuration III ... 37
iv. Test configuration IV... 38
v. Test configuration V... 38
vi. Test configuration VI... 39
vii. Test configuration VII... 39
4.3. Mechanical experiments ... 39 4.3.1. Joint geometry... 39 4.3.2. Manufacture ... 40 4.3.3. Testing procedure... 44 4.4. Experimental results... 49 4.4.1 Thermal tests ... 49
i. Test configuration I... 49
ii. Test configuration II ... 51
iii. Test configuration III ... 51
iv. Test configuration IV... 52
v. Test configuration V... 53
vi. Test configuration VI... 53
vii. Test configuration VII... 54
4.4.2. Mechanical results... 55
4.4.2.1. Test at room temperature... 55
i. Silicone RTV 106 adhesive ... 55
ii. Epoxy XN 1244 adhesive... 58
iii. Mixed- adhesive joint ... 59
4.4.2.2. Test at high temperature (100°C)... 62
i. Silicone RTV 106 adhesive ... 63
ii. Epoxy XN 1244 adhesive... 64
iii. Mixed-adhesive joints... 66
5. Joint modelling ... 70
5.2. Stress distribution along the overlap ... 73
5.2.1. Silicone adhesive ... 73
5.2.2. Epoxy adhesive ... 76
5.2.3. Mixed-adhesive joint ... 80
5.3. Effect of the overlap in the mixed adhesive joints... 82
6. Conclusions... 84
7. Future work ... 86
III. Figure index
Figure 1- Stress distribution for bonding joint and rivets joint [1]... 17
Figure 2- Diagram of exposure to environments [5] ... 20
Figure 3- Effect of the adhesive modulus on the adhesive stress distribution along the overlap [1]... 22
Figure 4 – Mixed-adhesive joint (G2 < G1) [1] ... 22
Figure 5 - Adherend yielding in a single lap joint [1]... 27
Figure 6 - In an ideal joint the substrate should be the weakest link. The adhesive joint (a) can be divided into at least five regions that are similar to the links (b) in a chain [10]... 29
Figure 7 – Specimen design for thermal experiments ... 33
Figure 8 - Distribution of the thermocouples in the adhesive joint (mm) ... 34
Figure 9- Heat source position configuration... 35
Figure 10 –Thermocouple cables bonded to aluminium substrate ... 35
Figure 11 - Data acquisition system for temperature measurement ... 36
Figure 12 - Position (mm) of heat source A for test configuration I ... 37
Figure 13 - Position (mm) of heat source B for test configuration II ... 37
Figure 14 - Position (mm) of the heat sources for test configuration III... 38
Figure 15- Position (mm) of the heat sources for test configuration IV ... 38
Figure 16 - Position (mm) of the heat sources for test configuration VI ... 39
Figure 17 – Silicone to ensure the thickness and bond area to the specimen used for the mechanical experiments ... 40
Figure 18 – Silicone frame used to control the bondline thickness in the mixed-adhesive joints... 41
Figure 19 – Grit blaster used to treat the aluminium substrate ... 41
Figure 21 – Aluminium substrate positioned in the mould with channels in the silicone
frame ... 42
Figure 22 – Adhesive application in joints with a single adhesive ... 43
Figure 23- Adhesive application in mixed adhesive joints ... 43
Figure 24 – Ceramic substrate application... 43
Figure 25 – Pressure application ... 44
Figure 26- Design of the tool used to fix the specimen and load application... 45
Figure 27 – Shear test in the MTS machine... 46
Figure 28 –Silicone piece between the ceramic and the loading tool ... 46
Figure 29- High temperature shear test... 47
Figure 30- Thermo camera FLUKE Ti25 ... 47
Figure 31- Thermal image of the aluminium substrate by thermal camera Fluke Ti25. 48 Figure 32 - Thermal image of the ceramic substrate by thermal camera Fluke Ti25 .... 49
Figure 33 - Distribution of temperature during the heating and cooling for test configuration I ... 50
Figure 34 - Distribution of temperature during the heating and cooling for test configuration II ... 51
Figure 35- Distribution of temperature during the heating and cooling for test configuration III ... 51
Figure 36- Distribution of temperature during the heating and cooling for test configuration IV ... 52
Figure 37 - Distribution of temperature during the heating and cooling for test configuration V ... 53
Figure 38 - Distribution of temperature during the heating and cooling for test configuration VI ... 53
Figure 39 - Distribution of temperature during the heating and cooling for test configuration VII ... 54
Figure 40- Load-displacement curves of aluminium-ceramic joints with silicone at room temperature ... 56
Figure 41- Cohesive fracture in the adhesive for an aluminium- ceramic joint with silicone ... 56 Figure 42- Von Mises stress distribution for the silicone RTV 106 using the
experimental load (≈2500N)... 57 Figure 43 – Load-displacement curve of the epoxy XN 1244 adhesive in the mechanical test at room temperature ... 58 Figure 44 –Cohesive rupture in the ceramic for aluminium- ceramic joints bonded with the epoxy adhesive... 59 Figure 45-Mixed- adhesive joints configuration... 60 Figure 46 –Load-displacement curve of the mixed-adhesive joint in the mechanical test at room temperature... 60 Figure 47- Cohesive rupture in the ceramic and cohesive rupture in the silicone at the opposite load edge for mixed adhesive joints ... 61 Figure 48 – Load-displacement curves of joints with a single adhesive and two
adhesives ... 62 Figure 49- Temperature-time curve used to control the temperature around 100°C .. 63 Figure 50 – Load- displacement curves of silicone RTV joints at high temperature
(100°C in the adhesive)... 63 Figure 51- Cohesive rupture in the adhesive for a silicone joint tested at high
temperature (100°C)... 64 Figure 52- Load-displacement curves of the epoxy XN 1244 joints at high temperature (100°C) ... 65 Figure 53 – Cohesive rupture in the ceramic for XN 1244 epoxy joints at high
temperature ... 66 Figure 54- Load displacement curves of mixed adhesive joints at high temperature (100°C) ... 66 Figure 55- Cohesive rupture in the ceramic and cohesive rupture in the silicone in mixed-adhesive joint at high temperature (100°C)... 67
Figure 56- Load-displacement curves of joints with single adhesive and two adhesives
at high temperatures (100°C)... 68
Figure 57 – Average results obtained at room and high temperatures (100°C)... 68
Figure 58 –Average maximum displacement at room and high temperatures ... 69
Figure 59- Average absorbed energy at room and high temperatures ... 70
Figure 60- Mixed adhesive joint with an overlap of 10mm for the silicone RTV106 (5mm at each edge) and 50mm for the epoxy XN1244 ... 70
Figure 61 – Load and boundary condition... 71
Figure 62- Mesh created for the specimen with 2mm of bondline thickness element size (0.25mm) ... 72
Figure 63- Path created in the middle of the adhesive layer for a 2mm bondline thickness ... 72
Figure 64 – Deformed mesh ... 73
Figure 65- Effect of bondline thickness on the shear stress distribution for silicone RTV 106 ... 74
Figure 66- Effect of the bondline thickness on the normal stress distribution for silicone RTV 106... 74
Figure 67 – Effect of bondline thickness on theVon Mises stress distribution for silicone RTV 106... 75
Figure 68 - Effect of the bondline thickness in the shear stress distribution for epoxy XN 1244 ... 77
Figure 69 – Effect of the bondline thickness in the peel stress distribution for epoxy XN1244 ... 77
Figure 70 - Effect of the bondline thickness in the Von Mises stress distribution for epoxy XN 1244... 78
Figure 71 – Shear stress distribution in a single lap joint [1] ... 78
Figure 72 - Shear stress distribution for a mixed adhesive joint with (10 silicone, 40 epoxy, 10 silicone) mm of length ... 80
Figure 73 –Peel stress distribution for a mixed adhesive joint with (10 silicone, 40 epoxy, 10 silicone) mm of length ... 81 Figure 74 -Von Mises stress distribution for a mixed adhesive joint with (10 silicone, 40 epoxy, 10 silicone) mm of length ... 81 Figure 75 – Mixed adhesive bondline length influence in the shear stress distribution for a 1mm bondline thickness ... 82 Figure 76- Mixed adhesive bondline length influence in the peel stress distribution for a 1mm bondline thickness... 83 Figure 77- Mixed adhesive bondline length influence in the Von Mises stress
IV. Table index
Table 1- Adhesive strength levels at different temperatures ... 15
Table 2- Typical glass transition temperature of structural adhesives [1]... 23
Table 3 - Main epoxy properties [1] ... 26
Table 4 – Materials properties at room temperature... 32
Table 5- Materials elastic properties... 71
1. Objectives
The main objective of this work is the design of an aluminum-ceramic joint which is suitable for use from -50°C to 1000°C using combinations of high and low modulus adhesives (2 adhesives) and test it in order to find the strongest and safest joint under thermal and mechanical loading.
2.
Introduction
One of the applications of adhesive bonding in the aerospace application is in the bonding of the tiles for temperature protection in the space shuttle. The adhesive used to bond the ceramic tile is a RTV (room temperature vulcanizing rubber) as it is able to withstand the temperature extremes that are experienced in the space environment and is also able to maintain a good degree of flexibility at very low temperatures. The RTV can provide a bond that accommodates the different mechanical and physical behaviour of the tile and the metal, but has a reduced strength at high temperature. However, this type of joint is also intended to have a good strength at high temperatures. Most high temperature adhesives (HT) have excellent properties at high temperature, but do not have the same performance at low temperatures, becoming too brittle. One solution to guarantee a good performance in the range between -50 to 1000°C is the creation of mixed adhesive joints with the combination of the two adhesives, one with good properties at low temperatures (RTV) and another with good properties at high temperatures (high temperature epoxy).
Table 1- Adhesive strength levels at different temperatures
STRENGTH AT
Low temperature Room temperature High temperature
HT epoxy Low Very good Good
As shown in Table 1, to guarantee a reasonable joint strength it is necessary to join the best adhesives properties (at temperature) in the same joint.
Thermal tests to analyse the temperature distribution, mechanical tests with different adhesives to analyse the joint strength at room and high temperature are essential to find the strongest and safest joint under thermal and mechanical loading.
3. Literature review
3.1 Adhesive applications and characteristics
Adhesive joints, also called bonded joints, have been used in various areas like aerospace industry, defense industry, automobile industry, electronic components industry, civil construction, woodwork, etc.
Men have been using natural adhesives for ages, but only in the 1950s the first vinyl, phenol and epoxy adhesives appeared. The epoxy adhesives were very important for the development of the aeronautical industry, because with them it was possible to do the first bond between metal-metal. This kind of bonding was used in primary structures (structures in which a failure can cause serious consequences) as a joining method of fuselage elements, panels construction and flight stabilizers.
Every joining process has advantages and disadvantages. Adhesive joints have various advantages when compared with traditional methods like bolted connections, welding, rivets and other mechanical connections. Some of those advantages are the uniform stress distribution along the bonded area (Figure1), vibrations damping, connection of different materials, reduction of the structure weight, increased fatigue resistance, ability to bond and seal at same time, ability to bond complex forms and reduced cost.
Figure 1- Stress distribution for bonding joint and rivets joint [1]
But the disadvantages are also important and some of them are: the necessity of treatment of the surfaces to be bonded, resistance and durability dependent in the processing conditions, limited durability in extreme service conditions, can require destructive methods for quality control, can have extra costs due to fixation tools used to put the parts in position, almost impossible disassembly, low production process, weak peel resistance, toxicity of some adhesives and low resistance of some adhesives to crack propagation.
Adhesive joining can roughly be divided into two segments: assembly joining and structural joining. Assembly joining uses an adhesive to hold two parts (materials) together. There is little or no load applied to the joint area other than the weight of the two materials or forces created by differences in thermal expansion. The joint may be temporary, have little or no durability requirement. Structural joining is the formation of a load-carrying joint, usually between two high strength members. Elaborate surface preparation is performed on each adherend to obtain optimum
Smaller unreinforced area
Stress distribution
Stress distribution Unreinforced area
strength and performance (environmental durability, fatigue resistance, and/or chemical resistance).
Focusing the application of adhesives in automotive industry, we can see that the use of light materials like aluminium or reinforced plastic with fibres has increased with the intention of reducing consumption and increase the performance. Those kinds of materials are not easy to connect by traditional methods. In this case, adhesive connections are a good alternative.
The work of British engineers in the 1940’s and 1950’s helped the construction of aeroplanes which used adhesive bonding. Current adhesives are all based on synthetic polymers like phenolic, epoxy, acrylic and urethanes. Usually they are modified to improve their toughness. They are used on reinforcement connections of the fuselage and the thin wings plate. They also permit the construction of honeycomb structures. The good fatigue resistance makes adhesives adequate to be used on helicopter blades.
Structural adhesives have been first used in the aerospace industry and have enabled the construction of lighter, stronger, and more durable airframes and aircrafts. The Wright Brothers plane was constructed of spruce, ash and muslin and contained two 2.44 m propellers, which were carved from laminated typical protein-based wood-working glue. Today’s aircraft, on the other hand, are constructed of aluminium, titanium, stainless steel and synthetic adhesives based on such diverse chemistries as: phenolic, epoxy, bismaleimide, polyimide and cyanate ester [2].
The aerospace requirements are very similar to aircraft application requirements. It is necessary to build structures with strength, low weight and cost. However, spacecraft have different specific requirements because they are involved in complex environments. For example, the hard vacuum of space can cause out gassing of polymeric materials, which can degrade their performance. Surface damage from impact with atomic oxygen in low-earth orbit must be taken into account for satellites and space stations. Therefore, materials used in space applications require special or additional tests and control than the aircraft structures. More recently, reusable
thermal protection systems have been developed which rely upon radiation of heat to protect the underlying structure. These systems are generally based on either reinforced carbon - carbon (RCC) or silica tiles. The silica tiles are made from very high-porosity amorphous silica fibres bonded with a slurry and sintered into blocks of appropriate dimension. The tiles are produced in different densities and attached to the substructure with room temperature vulcanizing (RTV) silicone adhesive through a Nomex strain isolation pad [3]. Nomex, is a material made with staple fibres, continuous filament yearns, paper and spunlaced fabrics. It is flame resistant and this is a polymer property and does not decrease with the life of the fibre. That characteristic makes Nomex be used in some isolation applications [4].
Material used in aerospace applications must have the necessary requirements to survive in the space. The spacecraft is exposed to different environments during the ground handling, orbital insertion, entry and landing. In those stages, there is a variation of pressure, humidity, vibration and acoustic, rain, salt and temperature (Figure 2).
Figure 2- Diagram of exposure to environments [5]
During the Space Shuttle mission lifetime, the bond system is subjected to a variety of structural and thermostructural loading conditions ranging from orbital cold soak at temperatures near or below the glass transition which can make a brittle bond. If the design temperature is less than -112°C, the silicon rubber is below its glass transition temperature. Below the glass transition temperature, an increase in the tensile and shear stresses occurs, stresses which could exceed the strength capability of these materials. High shear stress concentrations at the interface between the insulation and the structure are introduced when a high shear stiffness adhesive is used. The use of flexible adhesives results in a relaxation of shear stress requirements. The adhesive bond must be able to be used on many missions at maximum normal entry temperatures without excessive thermal degradation or properties modifications. These temperatures are 177°C for an aluminium structure and 343°C for titanium, with a factor of safety. In addition, the system must be compatible with the -157°C temperature experienced during orbital stay [5].
The high tensile and shear stresses occur during the entry and have approximately the same magnitude as those developed due to thermal gradients. However, the most severe condition for the bond occurs in post entry. Both tensile loads in the structure and cool-down gradients cause high bond stresses at the edge of the tile. This means that maximum tensile loading in the substructure can induce maximum bond stress requirements at bond temperatures ranging from 316 °C down to approximately -73°C [3].
3.2. Mixed adhesive joints
A ductile adhesive is able to redistribute the load and make use of the less stressed parts of the overlap, whereas a brittle adhesive concentrates the load at the ends of the overlap giving a low average shear stress (Figure 3). Adhesives are either strong, brittle and stiff or weak, ductile and flexible. The ideal would be to have a strong, ductile and flexible adhesive but this is very difficult to achieve, although the properties are independent.
Mixed-adhesive joints can decrease stress concentrations and increase the joint strength when compared with brittle adhesives. These joints are able to use the best properties of each adhesive used, improving joint performance. They are relatively easy to manufacture using a silicone rubber strip as a separator between the adhesives but some joints involve adhesives with different cure temperatures and forms, so, their manufacture can pose a problem [6].
Mixed-adhesive joints could be used to bond the ceramic tiles for temperature protection in space vehicle. Two different types of adhesives, a high-temperature epoxy adhesive (with higher strength than the silicone adhesive) and a silicone adhesive would guarantee a better strength at high temperatures during the space shuttle re-entry into the atmosphere and the silicone would be the load carrying adhesive when the space shuttle is in orbit [1]. The high temperature epoxy adhesive
should be in the middle of the overlap, while the silicone adhesive is applied at the edges prone to stress concentrations [6], as shown in Figure 4.
Figure 3- Effect of the adhesive modulus on the adhesive stress distribution along the overlap [1]
Figure 4 – Mixed-adhesive joint (G2 < G1) [1]
When used alone, the brittle adhesive does not make use of the central part of the overlap and the load is concentrated at the edges of the overlap. However, when used in a mixed- adhesive joint, the whole overlap contributes [6] decreasing the stress concentration in the edges due to the ductile adhesive.
Adhesive 2 Adhesive 2 Adhesive 1
3.3. High temperature adhesives
Adhesives suitable for high-temperatures are generally brittle at low-temperatures, giving low joint strengths at low-temperatures. Most of these adhesives are polymer based and these materials are known to exhibit a large variation of properties with temperature. At low temperatures, polymers are rigid and vitreous and when heated, they become flexible with properties as rubber above glass transition temperature. The maximum temperature that adhesives can safely support is related to their glass transition temperature. Structural adhesives must be able to withstand substantial loads and must be used at temperatures where they do not lose most of their strength. They usually must be used at temperatures below their glass transition temperature to maintain their optimal mechanical properties. Only some epoxy-phenolic, bismaleimide, polyimides and polibenzimidazol adhesives can be used for a long time above 180°C. Several epoxies and some cyanocrilates have service maximum temperatures around 120°C. Some glass transition temperatures are shown in Table 2. Silicone adhesives retain their strength up to relatively high temperatures, but that strength is very small to be used in structural applications [1].
Table 2- Typical glass transition temperature of structural adhesives [1]
Adhesive Glass transition temperature (°C)
Modified Epoxy 50-150 epoxy-phenolic 200 Nitrile-phenolic 120 Bismaleimide 210-280 Polyimides 340-430 Anaerobic 120 Cyanocrilates 80
3.4. Silicone adhesives
Among the major properties of silicones, distinguishing them from other polymer types, is their wide range of operating temperatures (from -115°C to over 300°C), their inertness and chemical stability, and their excellent electrical insulation and dielectric properties. Other unique features include high purity, low stress, low moisture absorption, resistance to oxidation and chemicals, and inherent flame retardation. Among the limitations of silicones are their high moisture transmission rates, low tear and tensile strengths (for some formulations), and migration of low molecular weight substances to adjacent surfaces during cure. Depending on their molecular weights and degree of cure, silicones may exist as liquids, gels, or solids; may be solvent based or solventless (100% solids); and may be either one-part or two-part systems. For adhesive applications, the one-part, 100% solids, room-temperature curing types are preferable. One-part silicones are generally RTV and moisture-curing types. They are user-friendly requiring no weighing, mixing, or deaerating and cure on exposure to air moisture in a few hours. To assure complete cure, however, adhesive-bonded parts should cure for 24–72 hours. The cure time can be shortened by exposure to higher humidity than is present in air or by a short heat exposure. Some two-part silicones can be heat cured at 105°C–110°C in only 10–15 minutes.
A sealant, on the other hand, may only require limited adhesion, with little physical strength, but must be resistant to the environmental conditions it is exposed to.
Silicones have generally the following physical properties:
• Wide operating temperature range -115 to 300°C • Excellent electrical properties
• Flexibility • UV resistance
• Good chemical resistance • Resistant to humidity and water • No or low toxicity
RTV's are very flexible and not toxic for the user. They can be applied using hand held tubes, cartridge guns or by an automated dispensing system.
Silicones, as a class, are rated among the highest temperature stable polymers. They can withstand temperatures of 200°C almost continuously and without degradation of physical or electrical properties and have been used at temperatures as high as 300°C. Because of their high thermal stabilities, they are used as adhesives and encapsulates for electronic modules that are expected to perform in extreme temperature environments, such as near automotive engines and in deep-well sensors. Because of their low modulus of elasticity, silicones also fare well at very low temperatures. They are rated for continuous use at -80°C, but may be used at even lower temperatures. Associated with their low modulus and elastomeric properties is their ability to dissipate stresses and to act as stress buffers between harder, less flexible materials such as epoxies. Because of their stress-dissipating properties, soft silicones are often used to bond or encapsulate fragile components such as glass diodes, laser diodes, and electro-optical devices [7].
3.5. Epoxy adhesives
Epoxies are the most versatile family of adhesives because they can bond various kinds of materials, except polymers and elastomers which have low surface energy, and can be easily modified to change their proprieties.
Cured epoxies are thermosetting. They have a good tensile and shear strength, low cure contraction, high flow resistance and a good environmental resistance (oil, humidity and solvents) but a weak peel resistance.
Commercial epoxies are usually composed of an epoxy resin and a curing agent. Epoxies can be liquid, solid, pasty or film. One-part epoxy can be cured with heat, while a two-part epoxy can be cured at room temperature or at high temperatures. Epoxies cured at high temperatures usually have better shear strength especially at high temperatures and high environmental resistance but have less toughness and weak peel strength. Epoxies cured at room temperature can harden in few seconds but usually need between 18 to 72 hours to achieve full strength. However, some epoxies can be cured at high temperatures in a short time.
Epoxy main properties are given in Table 3.
Table 3 - Main epoxy properties [1]
One part Epoxy Two part Epoxy
Form Film, paste Two parts in paste
Application method Manual
Manual mixture, automatic mixture and application
Cure Temperature (~150°C)
Room temperature (can be accelerated with temperature)
Service temperature -40ºC to 180°C -40 to 100°C
Advantages Resistance and durability Resistance and durability
Disadvantage Storage. High temperature cure Slow cure. Mixture (bubbles)
Water Excellent Good
Solvent Excellent Good
Environment resistance
Oil Excellent Good
Epoxies can be modified with resins for improving some properties which are necessary for some specific applications. Those additions can be for example, elastomeric particles (rubber) to improve impact resistance and ductility [1].
3.6. Adherends
One of the factors which can influence the adhesive joint strength is the adherend mechanical properties. Thermal effects should also be considered due to different expansion coefficients of the materials used in the same adhesive joint, because they can introduce significant loads.
Adherend properties have influence in stress distribution, therefore some ductility could be beneficial to the joint because it can too increase the joint strength.
The use of dissimilar adherends decreases the joint strength due to a non uniform stress distribution. To reduce the problem, the axial rigidity should be the same, in other words, E1t1=E2t2, where E is the modulus of elasticity, t is the thickness and (1, 2) refer to adherend 1 and 2.
In the case of some metallic adherends the plastic strain due to stress imposed occurs at the edge of the overlap (Figure 5). This can result in premature failure of the adhesive [1].
3.7. Metal-ceramic adhesion
Metal-ceramic adhesion is important in diverse industrial areas such as microelectronics, catalysts, dentistry, photovoltaic cells, and protective coatings for metals. The integrity of the joints will depend in large part on the physical and chemical interactions at the interface.
Since metal-ceramic adhesion has long been required for a variety of industrial applications, research in this area has been carried out from many different perspectives. Much early work on adhesion was done on liquid metal wetting of oxide ceramics. Reaction bonding of metals to ceramics, including metal-ceramic "brazing", has been studied both experimentally and theoretically.
Although much research has been accomplished, the studies and models proposed have not yet provided the ability to predict the correlation between adhesion and the chemical identities of the two partners in metal-ceramic couples. Thus, as recent reviews of the subject point out, there is at present a gap between what can be theoretically modelled and what is practically useful [8].
As it is often the interface that controls the mechanical properties of the materials consisting of metals and ceramics, knowledge of the adhesion properties and nature of bonding at the metal-ceramic interfaces are essential to the development of materials based on them [9].
3.8. Surface preparation
Since adhesives and sealants must function by surface attachment, the nature and condition of the substrate surface are critical to the success of any bonding or sealing operation. Four common criteria are generally recognized for an ideal bonding surface: cleanliness, continuity, stability, and wetting of the surface by the adhesive or sealant.
Cleanliness does not necessarily mean the absence of all surface films, since some surface films are very strongly attached to the bulk substrate and offer a suitable surface for adhesion. However, cleanliness does require the removal of unwanted or weak boundary layers such as oil, dirt, or corrosion. The purpose of cleaning the surface is to remove any weakly attached materials and to provide a surface that is relatively consistent from part to part.
The adhesive or sealant will try to wet the contaminant surface layer rather than the substrate itself. Since most contaminants (oils, greases, fingerprints, mold release, etc.) have a low surface energy, the adhesive will not wet the surface nor will it form a continuous film.
Certain surfaces also may have weakly attached surface or boundary layers. Examples of these are contaminant films, oxide layers, rust, corrosion, scale, and loose surface particles. A weak substrate boundary layer can provide the ‘‘weak-link’’ for reduced bond strength or premature failure as shown in Figure6 [10].
Figure 6 - In an ideal joint the substrate should be the weakest link. The adhesive joint (a) can be divided into at least five regions that are similar to the links (b) in a chain [10].
Ceramic materials have smooth, glass like surfaces, usually with very high surface energy. Since ceramics have high surfaces energies, they are usually easy to bond under normal conditions. However, many commercial important ceramics have glazed (glass-like) surfaces. Adhesives used with ceramics, as those used with metals, must be compatible with the surface moisture layer [10].
(a)
4. Experimental details
4.1. Materials
RTV106 siliconeThis is a one-part high temperature acetoxy adhesive sealant supplied by GE Bayer Silicones (USA) [11]. For applications such as aerospace gasketing and sealing and other critical bonding, sealing, potting, insulating, encapsulating and protective coating applications where parts must perform to extreme high temperatures. RTV 106 for use on horizontal, vertical and overhead surfaces [12]. This material has a long tradition of use in high temperature aerospace applications and as such it is used as a benchmark to be improved upon. It has a hydrophilic curing process which implies several days (around 7 days) of cure at room temperature.
AV138 Epoxy
Araldite AV138 with Hardener HV998 is a two component, room temperature curing (24 hours at 23°C) paste adhesive of high strength. When fully cured, the adhesive have excellent performance at elevated temperatures and has high chemical resistance. It is suitable for bonding a wide variety of metals, ceramics, glass rubbers, rigid plastics and other materials, and is widely used in many industrial applications where resistance to aggressive or warm environments are required. The low out gassing makes this material suitable for specialist electronic telecommunication and aerospace applications [13]. This material was used as a substitute for high temperature epoxies during some of the initial stages of this work as it has similar mechanical properties.
XN1244 epoxy
XN 1244 epoxy is a one-part adhesive in paste, supplied by a Nagase Chemtex (Japan). The main characteristics are the good adhesion to metallic and ceramic materials and good behaviour at high temperatures. The adhesive cure is done at 140°C for 60 minutes. XN1244 is a relatively new material and was chosen for this work to explore the potential of its properties in high temperature aerospace uses.
Aluminum 6063 T6
Aluminium alloy 6063 is a medium strength alloy commonly referred to as an architectural alloy. Alloy 6063 is used in a variety of applications that include architectural and building products, electrical components and conduit, irrigation tubing, railing and furniture and aerospace applications.
In the heat-treated condition, 6063 alloy provides good resistance to general corrosion, including resistance to stress corrosion cracking. It is easily welded or brazed by various commercial methods. Since 6063 is a heat-treatable alloy, strength in its –T6 condition can be reduced in the weld region [14]. This material was chosen for this work as it is representative of the aluminum alloys used in many aerospace structures.
Ceramic (Cordierite)
Cordierite is a magnesium aluminum silicate which possesses an extremely low thermal expansion and low thermal conductivity. Cordierite is used when thermal shock is a concern in the finished product. It is available in the self-glazing form where higher strength, thermal shock, and dielectric strength is required [15]. This material was chosen for this work because it has very good thermal properties and can be easily obtained at low price.
The properties of the materials used in this study are shown in Table 4. The ceramic properties are those given by the manufacturer (ISOLUSA, Refractários e Isolamentos, Lda.) The properties of the aluminium 6063-T6 were obtained with web material databases [16]. The adhesive properties were taken from the literature [11, 12, 13, 17,18].
Table 4 – Materials properties at room temperature
Adherends Adhesives Aluminum 6063 T6 [16] Ceramic (Cordierite) RTV106 silicone [11,12] AV138 Epoxy [13,17] XN1244 Epoxy [18] Ultimate tensile strength (MPa) 207 - - 41 - Ultimate shear strength (MPa) 159 - 2 30 - Young’s modulus (MPa) 67000 120000 1.6 4590 5800 Poison’s ratio 0.33 0.25 0.5 0.3 0.3 Tg (°C) - - -60 63 155 Specific heat (J/g.K) 0.897 0.35 - 1.2 1.2
4.2. Thermal experiment
The procedure described in this section was undertaken to guarantee an uniform temperature distribution in the adhesive when the joint was heated by a heat source on the side of the ceramic. Two heat sources and nine thermocouples distributed in bonding area were used with the intent of understanding and uniformizing the temperature in the joint.
The results of the tests carried out in the thermal experiences were not directly used in the final mechanical testing procedure as the specimen design and heating methods were slightly changed along the course of the work. Nonetheless, much valuable information was gathered and is presented here.
4.2.1. Joint geometry
A ceramic tile (cordierite) with 140x80x12.8mm3 was bonded in the middle of an aluminium substrate with 240x80x2mm3 by the high temperature epoxy AV138. The specimen design is shown in Figure 7.
Figure 7 – Specimen design for thermal experiments
Nine thermocouples were bonded to the aluminium substrate with cyanocrylate. The thermocouples positions in relation to the ceramic substrate are shown in Figure 8.
Figure 8 - Distribution of the thermocouples in the adhesive joint (mm)
This joint is a model to represent the spacecraft fuselage. The ceramic tile represents the thermal protection system (TPS) which protects the spacecraft from the high thermal loads during re-entry and the aluminium represents the underlying structure.
4.2.2. Testing procedure
The first stage of the present project was to determine the temperature distribution in the adhesive when the ceramic is heated such as in the re-entry of a space vehicle. For that two heat sources (A and B) were used and positioned as shown in Figure 9. The heat sources are gas burners (Campingaz TC2000) using butane-propane mix gas with a flame temperature of 1750°C containing 170g. Using a configurable mounting frame (Figure 9) and changing the distance between heat sources, the objective was to cover the entire surface and obtain the most uniform temperature distribution. For that, several configurations were tested. AV138 epoxy was used because it was the best available adhesive at the time and has sufficiently close properties to the epoxy XN1244, which was obtained later and used in the mechanical test.
Figure 9- Heat source position configuration
The thermocouples bonded to the aluminium substrate (Figure 10) measure the temperature at each point where they are connected. The ceramic was heated by the heat sources and the heat transferred across the ceramic and the adhesive until it reached the thermocouples bonded on the aluminium.
Figure 10 –Thermocouple cables bonded to aluminium substrate
The thermocouples were connected to a data acquisition system (National Instruments SCXI-1001, Figure 11) for temperature measurement as a function of time.
Figure 11 - Data acquisition system for temperature measurement
The heat source positional configuration and power configuration (the power was adjusted by increasing or decreasing the power using the power control from one position previously defined using a mark manually done, because the heat sources did not have gas flow measurement) was changed along the test to find the most uniform temperature distribution in the adhesive joint. But it is not a very precise test because it is difficult to repeat the test with the same positional and power control configuration. Room temperature and gas pressure inside the heaters can influence the result.
The heat source was positioned 80mm away from the adhesive joint. The heat was applied at the point represented in Figure 12. The temperature was increased to 100°C-140°C in 2 minutes. After heating, the adhesive joint was cooled for 1 or 2 hours until room temperature (22°C).
i. Test configuration I
This test was intended to study a configuration with only one heat source, heat source A, to assess the influence of such configuration on the upper zone of the entire adhesive joint.
Figure 12 - Position (mm) of heat source A for test configuration I
ii. Test configuration II
This test was intended to study the influence of only one heat source, but in this case the one of the under heat source (B) (Figure 13).
Figure 13 - Position (mm) of heat source B for test configuration II
iii. Test configuration III
Two heat sources (A and B) were used simultaneously as shown in Figure 14. Heat source B Heat source A
Figure 14 - Position (mm) of the heat sources for test configuration III
iv. Test configuration IV
In the fourth test, the heat sources were positioned as shown in Figure 15 to heat more the lower zone.
Figure 15- Position (mm) of the heat sources for test configuration IV
v. Test configuration V
In this test, the same configuration as test configuration IV was used. The difference was the increased power of the lower heat source (heat source B indicated in Figure 15), to improve the temperature in the lower zone.
Heat source A
Heat source B
Heat source A
vi. Test configuration VI
In this configuration, more power was used in the lower heat source (B) than used in test configuration V and positioned as shown in Figure 16.
Figure 16 - Position (mm) of the heat sources for test configuration VI
vii. Test configuration VII
The previous configuration (test configuration VI) was used. The power in upper heat source (A) was slightly increased.
4.3. Mechanical experiments
4.3.1. Joint geometry
The joint geometry for the mechanical tests was changed from the one used in the heating tests previously presented. This was done to enable a faster and more precise manufacture procedure and to allow the use of a special shear testing tool (to be presented further ahead).
Heat source A
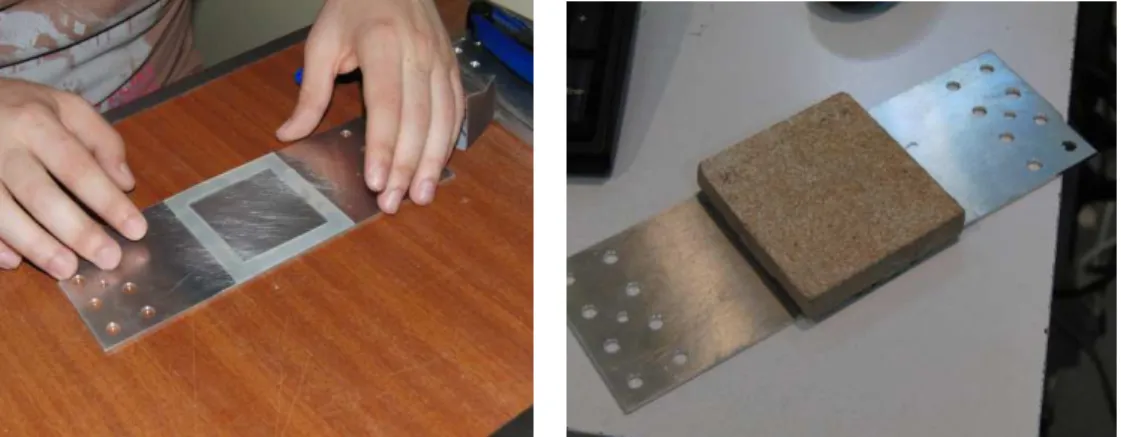
A square ceramic substrate 80x80x12.8mm3 was bonded to an aluminium substrate 240x80x2mm3. The bonded area was 60x60mm2 in the middle of the aluminium, and a silicone frame was used as a physical support between the aluminium and the ceramic to ensure an adhesive thickness of 1mm (Figure 17).
Figure 17 – Silicone to ensure the thickness and bond area to the specimen used for the mechanical experiments
The bondline thickness of 1mm was chosen for two reasons. For RTV silicones, the optimum bondline thickness to be used in a joint, recommended by the manufacturer, is from 1 to 2mm [11]. However, for the epoxy, the manufacturers recommend a bondline thickness between 0.1 and 0.2mm to obtain a maximum strength [1]. The mixed adhesive joint will contain an epoxy adhesive (XN 1244) and a silicone (RTV 106), so to guarantee the best strength and to facilitate the manufacture it was decided to use bondline thickness of 1mm. In Section 5.2, the influence of the adhesive thickness is analysed in the stress distribution.
4.3.2. Manufacture
The manufacture procedure consisted in the following steps.
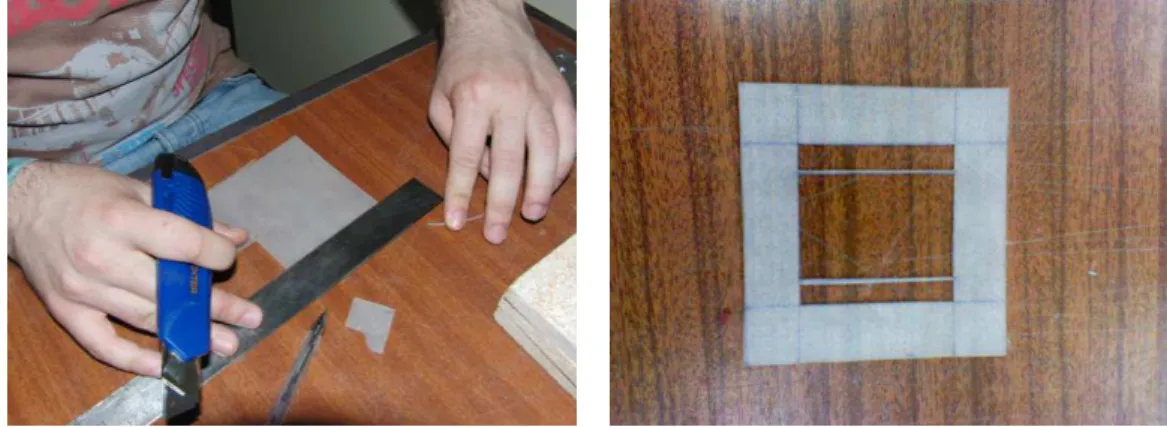
1. A silicone square with 100x100mm2 and 1mm of thickness was cut. Inside that silicone square, another square with 60x60mm2 was cut. That limited the bonded area
and the adhesive thickness to 1mm. For the mixed-adhesive joints, the bonding area was divided in three sections for the different adhesives used (Figure 18).
Figure 18 – Silicone frame used to control the bondline thickness in the mixed-adhesive joints
2. The aluminium substrate was grit blasted (SiO2 with 600μm of size) to remove contaminants and introduce uniform roughness (Figure 19).
Figure 19 – Grit blaster used to treat the aluminium substrate
3. The silicone square was bonded to the aluminium substrate with a cyanocrylate (Figure 20).
Figure 20 – Silicone square bonding
4. The aluminium substrate was positioned in a special mould and channels in the silicone were cut to allow the flow of excess adhesive. This guaranteed a total support of the ceramic on the silicone square and ensured a better alignment (Figure 21).
Figure 21 – Aluminium substrate positioned in the mould with channels in the silicone frame
5. A thermocouples were bonded to the aluminium substrate in the middle using cyanoacrylate, to control the temperature during heating.
6. The adhesive application was made with special care to avoid the presence of air bubbles and voids in the layer (Figures 22 and 23).
Figure 22 – Adhesive application in joints with a single adhesive
Figure 23- Adhesive application in mixed adhesive joints
7. The ceramic substrate was then applied over the adhesive (Figure 24).
8. A load of 900 kgf (2000lbsf) was applied in a press during 5 minutes for the silicone RTV 106 adhesive. Then, the mould was removed from the press and left at room temperature during 7 days to complete the curing process. For the epoxy XN 1244, a load of 675 kgf (1500lbsf) and a temperature of 140°C was applied during 1 hour. In the mixed-adhesive joints, a load of 900 kgf at 140°C during one hour to cure the epoxy adhesive and after the mould was removed with the specimens and left at room temperature during 7 days to cure the RTV silicone.
A metal block was used between the ceramic substrates and the top plate of the press to spread the pressure evenly and avoid damaging the ceramic (Figure 25).
Figure 25 – Pressure application
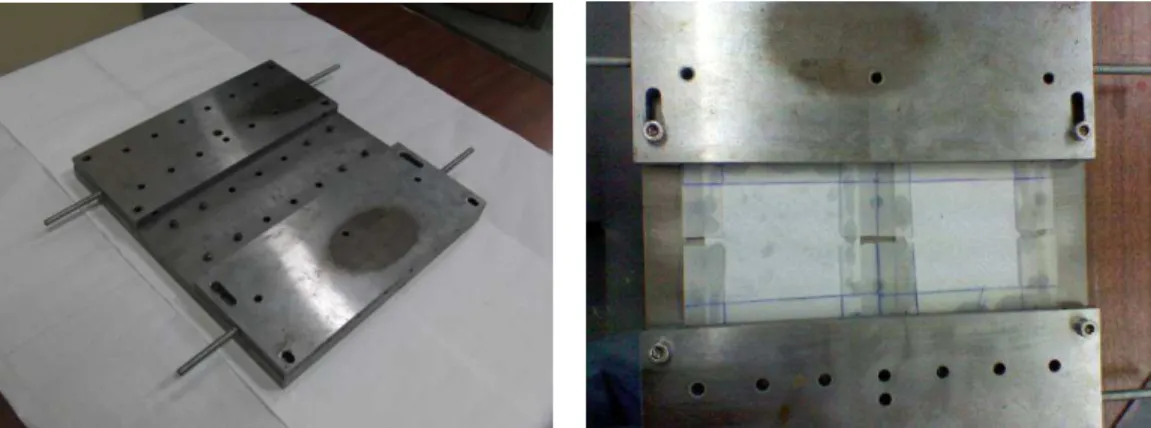
4.3.3. Testing procedure
The specimen was fixed to a tool purposely designed by the Eng. Eduardo Marques for this joint (Figure 26).
The specimen was horizontally fixed by sixteen screws to a fork that moved downward during the test. The upper frame, which is in contact with the ceramic base, does not move during the test. The movement of the lower fork introduces a loading in the bond line with a large shear component. This test was designed to reproduce a shear load that the aluminium-ceramic joint might experience in practice due to an impact. The test is here carried out in static conditions but impact tests will be also carried out
in the future. Note that the stress due to the internal pressure inside the aluminium space is not critical for the silicone adhesive and was therefore not studied here. .
Figure 26- Design of the tool used to fix the specimen and load application
The mechanical tests were done in an MTS universal testing machine (Figure 27) at 1mm/min for the silicone adhesive RTV106 and at 0.5mm/min for the joints bonded with the epoxy XN1244 and for the mixed-adhesive joints. This speed was chosen based on the expected displacement. It is known that the test speed can influence the adhesive strength but as low velocity differences (0.5 mm per minute) are being used between tests, this is expected not have any significant influence in the strength. For the brittle adhesives, less displacement is expected than in ductile adhesives and with a slow testing speed, the failure mechanism is easier to follow.
Specimen
Fork
Figure 27 – Shear test in the MTS machine
A small silicone piece was placed at the base of the loading frame tool where it contacts with the ceramic tile. It introduces some damping and avoids direct contact between the ceramic and the tool which can damage the ceramic (Figure 28).
Figure 28 –Silicone piece between the ceramic and the loading tool
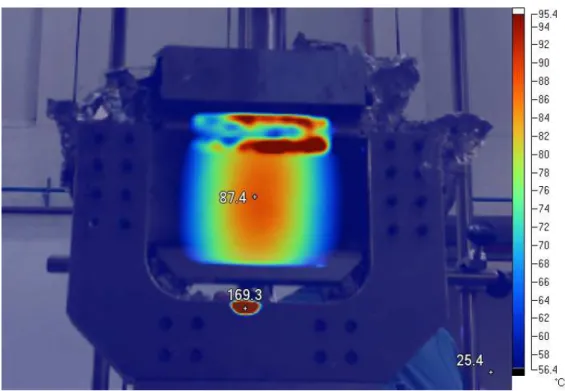
To perform the mechanical test at high temperature, the specimen was heated with the heat sources directed to the ceramic. The heating power was adjusted to maintain high temperature (100°C in the adhesive) and only then the shear test was performed. The heat source was positioned 80mm away from the ceramic. Unlike the thermal experiment where 2 heat sources where used, in this test only one heat source (Figure
29) due to the smaller ceramic area of 80x80mm2 and the bonding area 60x60mm2 . As previously mentioned, due to tool design, mould geometry and specimen manufacture, the joint (ceramic) needed to be slightly modified during the course of the work.
Figure 29- High temperature shear test
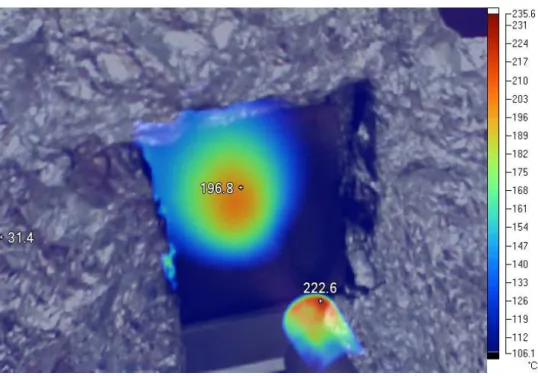
To verify the presence of a uniform temperature distribution, a thermographic camera, model Fluke Ti25 (Figure 30), was used to monitor the temperature distribution on the ceramic and aluminium outer surfaces. The thermocouple in the adhesive was used to control the test temperature (100°C).
Figure 30- Thermo camera FLUKE Ti25
The temperature distribution in the aluminium adherend previously painted in black to consider it as a black body with an emissivity near 1 (0.94 in the thermal camera) is
shown in the Figure 31. The paint used did not turn the surface in ideal black body because the paint was too liquid and fluid, then the results obtained by the thermographic camera may not be completely right.
Figure 31- Thermal image of the aluminium substrate by thermal camera Fluke Ti25
The temperature distribution on the ceramic side (black painted) is shown in Figure 32. Note that for high temperature measurements, an additional lens is required that duplicates the temperature reading. In other words, the temperature of the ceramic is two times that indicated in Figure 32.
Figure 32 - Thermal image of the ceramic substrate by thermal camera Fluke Ti25
Figures 31 and 32 show that the temperature is uniformly distributed which is important to analyse the results when mechanical and thermal loads are applied.
4.4. Experimental results
4.4.1 Thermal tests
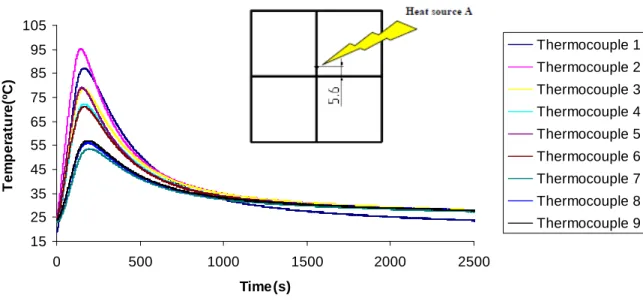
15 25 35 45 55 65 75 85 95 105 0 500 1000 1500 2000 2500 Time (s) T e m p e ra tu re (º C ) Thermocouple 1 Thermocouple 2 Thermocouple 3 Thermocouple 4 Thermocouple 5 Thermocouple 6 Thermocouple 7 Thermocouple 8 Thermocouple 9
Figure 33 - Distribution of temperature during the heating and cooling for test configuration I
It is possible to see that although the heat source is nearest to the centre (nearest to thermocouple 5), thermocouple 2 has the highest temperature and the thermocouples in the lower part of the joint are 40°C lower than the highest temperature. Therefore, this configuration favours the heat incidence in the zone above the heat source having less influence in thermocouples in the lower part of the joint (thermocouples 7, 8 and 9).
One reason for the difference in temperatures is because the hot air rises along the adhesive joint, causing increased heating in the top of the specimen (thermocouple 2).
ii. Test configuration II
20 30 40 50 60 70 80 90 100 0 500 1000 1500 2000 Time(s) T e m p e ra tu re (º C ) Thermocouple 1 Thermocouple 2 Thermocouple 3 Thermocouple 4 Thermocouple 5 Thermocouple 6 Thermocouple 7 Thermocouple 8 Thermocouple 9Figure 34 - Distribution of temperature during the heating and cooling for test configuration II
Like expected, thermocouples 7, 8 and 9 which are in the direction of the heat source have the highest temperature. Usually the temperatures in the sides are lower than the temperature in the centre, for the thermocouples at same elevation.
A maximum temperature difference of 30°C was found between thermocouples 3 and 8.
iii. Test configuration III
20 40 60 80 100 120 0 500 1000 1500 2000 Time(s) T e m p e ra tu re ( ºC ) Thermocouple 1 Thermocouple 2 Thermocouple 3 Thermocouple 4 Thermocouple 5 Thermocouple 6 Thermocouple 7 Thermocouple 8 Thermocouple 9
The thermocouple 1 was failed. The reason for that was the damaged thermocouple cable. Figure 35 shows that the upper part of the joint (thermocouples 2 and 3) was more heated than the lower part (thermocouples 7, 8 and 9).
There is a maximum temperature difference of 40ºC between the thermocouples 2 and 9.
iv. Test configuration IV
20 40 60 80 100 120 20 520 1020 1520 Time(s) T e m p e ra tu re (º C ) Thermocouple 1 Thermocouple 2 Thermocouple 3 Thermocouple 4 Thermocouple 5 Thermocouple 6 Thermocouple 7 Thermocouple 8 Thermocouple 9
Figure 36- Distribution of temperature during the heating and cooling for test configuration IV
With this configuration, thermocouples 7, 8 and 9 continue to be at a lower temperature but less difference exists between the maximum and the minimum temperatures (30°C) than with the previous configuration.
v. Test configuration V
20 40 60 80 100 120 0 500 1000 1500 2000 Time(s) T e m p e ra tu re (º C ) Thermocouple 1 Thermocouple 2 Thermocouple 3 Thermocouple 4 Thermocouple 5 Thermocouple 6 Thermocouple 7 Thermocouple 8 Thermocouple 9Figure 37 - Distribution of temperature during the heating and cooling for test configuration V
With this configuration, the thermocouples from the right side of the adhesive joint were colder than the thermocouples from the centre and left side, but there is only 20°C difference between thermocouples 4 and 9 (maximum and minimum temperatures).
vi. Test configuration VI
20 30 40 50 60 70 80 90 100 110 120 0 500 1000 1500 2000 2500 Time(s) T e m p e ra tu re (º C ) Thermocouple 1 Thermocouple 2 Thermocouple 3 Thermocouple 4 Thermocouple 5 Thermocouple 6 Thermocouple 7 Thermocouple 8 Thermocouple 9
The temperatures of thermocouples 8 and 9, from the bottom of the adhesive joint, are the highest because of the heat source position. The maximum difference of temperature is 25°C between thermocouple 8 and 3.
vii. Test configuration VII
20 30 40 50 60 70 80 90 100 110 120 0 500 1000 1500 2000 Time(s) T e m p e ra tu re (º C ) Thermocouple 1 Thermocouple 2 Thermocouple 3 Thermocouple 4 Thermocouple 5 Thermocouple 6 Thermocouple 7 Thermocouple 8 Thermocouple 9
Figure 39 - Distribution of temperature during the heating and cooling for test configuration VII
Thermocouple 2 still shows the highest temperature but the maximum difference of temperature is 25°C (between thermocouple 2 and 7). It is possible to find the highest temperatures in the centre of the adhesive joint because this is the direction of the heat source.
Considering the lower maximum difference between thermocouples in the test configurations previous showed, it can be concluded that the best configuration was obtained for test configuration V, where 20°C of temperature difference was found
between thermocouples 4 and 9. But this is not an easy procedure to reproduce due to the heat source limited positional precision and imprecise heat power control.
Specimens used in the mechanical test due to tool design, mould geometry and specimen manufacture, needed to be modified. Also, the ceramic area used in the specimen was 80x80mm2 and the bonding area 60x60mm2. With this modification, it would have been difficult to reproduce this setup because only one heat source could be used to avoid heating the fixing devices.
To obtain the most uniform temperature in the joint during the mechanical test, a thermographic camera was used to monitor the temperature.
4.4.2. Mechanical results
4.4.2.1. Test at room temperature
i. Silicone RTV 106 adhesive
The load-displacements curves are shown in Figure 40. The test was done at a speed of 1mm/min.
0 1000 2000 3000 4000 0 1 2 3 4 5 6 Displacement (mm) L o a d ( N ) RTV_GR_1 RTV_GR_2 RTV_GR_3
Figure 40- Load-displacement curves of aluminium-ceramic joints with silicone at room temperature
The RTV silicone joints did not exhibit consistent results but were usually above 2000N. The adhesive flexibility allows a long displacement during test. The typical cohesive fracture surface in the silicone is shown in Figure 41.
A failure load of 7200N was expected for RTV106 if global yielding in the adhesive is assumed with a shear strength of 2MPa and a load bearing area of 60x60mm2=3600mm2. The expected value is well above the experimental result. Due to the geometry of the specimen, most specifically the ceramic tile where the load was applied, the adhesive is not only loaded in shear. When a load is applied to the ceramic, due to its height, it will introduce a moment in the joint which translates into a peel stress in the adhesive layer. In ductile adhesives like silicone, the peel stress influence is reduced when compared with brittle adhesives but it is not negligible. However, the stress distribution was numerically analysed with ABAQUS using the maximum experimental load in the numerical analysis, with the intent of verifying if the maximum stress obtained approaches or exceeds the adhesive. The Von Mises stress was used and compared with the adhesive tensile strength. For highly deformable adhesives like the silicone being studied here, the shear strength and the tensile strength are comparable, therefore the shear strength value indicated in Table 4 was used for the tensile strength of the silicone.
The Von Mises stress distribution obtained along the overlap in the middle of the adhesive layer is shown in Figure 42.
0 0,2 0,4 0,6 0,8 1 1,2 1,4 1,6 0 10 20 30 40 50 60 Bondline length (mm) V o n M is e s s tr e s s ( M P a )
Figure 42 shows that the stress is higher at the edge representing 70% of the silicone RTV strength (2MPa). This is related to the presence of peel forces near the edge, caused by the significant rotation of the ceramic tile during the loading. A possible explanation for the lower joint strength with the silicone is adhesive insufficient cure. This silicone cures with the air moisture in 7 days. However, the large area and thick bondline makes difficult the diffusion of moisture in the adhesive. In addition, the silicone adhesive joints were found to have a more complex adhesive application method (in relation to the epoxy XN 1244) due to the tube application and high viscosity. This, along with adhesive storage concerns, explains the inconsistent results found during testing.
ii. Epoxy XN 1244 adhesive
Epoxy adhesive joints were tested at 0.5mm/min and the load-displacement curves are shown in Figure 43. 0 1000 2000 3000 4000 5000 6000 0 0,5 1 1,5 2 Displacement (mm) L o a d ( N ) XN_GR_0 XN_GR_1 XN_GR_2 XN_GR_3 XN_GR_4
Figure 43 – Load-displacement curve of the epoxy XN 1244 adhesive in the mechanical test at room temperature
The failure load was around 5000N in all the tests. The fracture was cohesive in the ceramic in all of them. A typical fracture surface is shown in Figure 44.
Figure 44 –Cohesive rupture in the ceramic for aluminium- ceramic joints bonded with the epoxy adhesive
The upper limit expected for this joint is when the adhesive is at global yielding. Assuming a shear strength of 35MPa, that would give a failure load of 126000N. This is well above the experimental failure load, firstly because the adhesive is not sufficiently ductile to yield along the whole overlap and secondly because the ceramic failed before the adhesive could develop its full potential.
iii. Mixed- adhesive joint
Mixed-adhesive joints with bondline lengths of 10 mm for the silicone, 40 mm for the epoxy and again 10 mm for the silicone (Figure 45) were tested with a speed of 0.5mm/min. The load displacement curves are shown in Figure 46.
Figure 45-Mixed- adhesive joints configuration
0 1000 2000 3000 4000 5000 6000 7000 0 0.5 1 1.5 2 2.5 Displacement (mm) L o a d ( N )
Mix_10_40_10_1 Mix_10_40_10_2 Mix_1mm_10_40_10-3 Mix_1mm_10_40_10-4
Figure 46 –Load-displacement curve of the mixed-adhesive joint in the mechanical test at room temperature
The rupture was cohesive in the ceramic substrate like in the case of the joint with the epoxy alone, however, in this case the silicone layer located at the edge where the load was applied also caused failure of the ceramic, in cooperation with the central section of the epoxy adhesive which retains most of the loads. The silicone adhesive layer in the opposite edge from where the load was applied had a cohesive rupture. The later failure of the silicone (especially evident in the dark blue load-displacement curve in Figure 46) makes the joint failure of the mixed-adhesive safer in relation to a
RTV 106 silicone
joint with the epoxy alone. This failure mode proves the presence of stresses other than shear, causing a moment in the ceramic adherend. A typical fracture surface is shown in Figure 47. The dispersive results obtained could be due to some defects in the ceramic, which modify the joint strength.
Figure 47- Cohesive rupture in the ceramic and cohesive rupture in the silicone at the opposite load edge for mixed adhesive joints
Figure48 shows on the same graph typical load-displacement curves of joints with a single adhesive and of a joint with two adhesives. It should be born in mind that the joint with silicone alone is the reference and the goal is to improve the mechanical behaviour of that joint speciality at high temperatures.