Abstract— This paper reports the experimental results with an
open multideck display case with dual air curtain. Manufacturers seek during the design phase of the equipment to certify its suitability to the testing standards with the lowest energy consumption and ensuring food safety. The testing standard ISO 23953 is usually followed to determine the thermal cooling load. The thermal cooling load depends on the procedure to set the external air velocity. According to ISO 23953, the mean horizontal air velocity, with the refrigerated display case switched off, shall be 0.2 m s-1. This paper reports experimental test results where the initial procedure of setting the air velocity followed two different methods. Considering that (1) the display case is initially switched off as required by ISO 23953 and (2) the display case is initially switched on and the external air velocity is adjusted to the required level using auxiliary fans. After reaching steady state conditions, the 24-hour tests began with the display case switched on. The comparison of experimental results for the two conditions (switched off relatively to switched on) provide the quantitative variation of frost formation (-24%) and condensed water (+180%) on the evaporator coil and how this phenomena affects the distribution and magnitudes of air velocity (+0.17 m s-1); inlet (+5.9°C) and outlet temperatures (+5.5°C); the components of the total sensible (+10%) and latent (+15%) heat loads; and the average product temperatures (+176%). The analysis of experimental data provides the necessary basis to conclude that the method how the initial procedure of setting the air movement is performed affects significantly the performance of the equipment under testing. The results show that air movement procedure defined in the standard may not be sufficient to set a constant air movement during the 24 hours test due to the interaction with the air curtain flow. This condition is reflected in a higher thermal cooling load.
Keywords— Refrigeration, Display case, experimental testing,
heat loads, frost formation, airflow distribution.
I. INTRODUCTION
HIS study aims to understand the influence of the external air velocity on the performance of display case Gustavo G. Heidinger is with the Department of Electromechanical Engineering - University of Beira Interior, Portugal and EletroFrio Refrigeração, Brazil.
Samuel M. Nascimento is with the Department of Electromechanical Engineering - University of Beira Interior, Portugal and EletroFrio Refrigeração, Brazil.
Pedro D. Gaspar is with the Department of Electromechanical Engineering - University of Beira Interior, Portugal (phone: +351 275329759; fax: +351 275329772; e-mail: [email protected]).
Pedro D. Silva is with the Department of Electromechanical Engineering - University of Beira Interior, Portugal.
evaporators knowing that 46% of the number of display cases are vertical open type for meat, deli and dairy products refrigeration [1]. The infiltration load of a vertical open refrigerated display case (VORDC) corresponds from 67% to 81% of the total heat load [2-4]. The infiltration load is strongly connected to the environmental conditions of the store in which they are placed, to the air curtain velocity, width and thickness and rate of air curtain agitation [3]. The air curtain agitation can be caused by shoppers passing and interfering on the air curtain to achieve some product or also by external air currents from the outputs of air conditioning systems, fans and pressure differences that originate mass flows. The increase of the air curtain agitation increases the condensation rate and the frost formation on the heat exchanger, which in turn requires a greater frequency of daily defrosting. This condition increases the heat load due the need to recover the preservation temperature of food products after defrosting. Additionally, it promotes the temperature instability of the exposed products.
Air movement in laboratory tests shall be provided to simulate field conditions. The air movement must be parallel to the plane of the VORDC opening and to the longitudinal axis. With the VORDC switched off, the air velocity shall be 0.2 m s-1 [5]. Gaspar et al. [2] quantified experimentally the total heat load of a VORDC when the external airflow changes its direction and magnitude. At the reference experiment, the air velocity was fixed at 0.2 m s-1 and the direction of the airflow was parallel to the plane of the display opening (0°). The total heat load increased 4.6% when the airflow was oblique (45°) and increased 6% when the airflow was perpendicular (90°). When the airflow velocity was changed to 0.4 m s-1 parallel to the frontal opening of the VORDC (0°), the total and latent heat loads increased 54% and 77% respectively. Gaspar et al. [6-7] developed a detailed CFD model of a refrigerated display cabinet to design a set of parametric studies. Based on that models the influence of airflow (0°, 45° and 90°) and heat transfers impact in thermal entrainment was simulated numerically [8-9]. When the air movement goes from parallel to perpendicular there an increase of air infiltration into the refrigerated space, and consequently occurs an increase in circulating air temperatures and condensation rate. The product temperatures were above the food safety limits in all experimental tests. Additionally, Gaspar et al. [10] studied numerically the dependency of air
Variation of the thermal performance of open
multideck display case due to the procedure of
setting the external air velocity
Gustavo G. Heidinger, Samuel M. Nascimento, Pedro D. Gaspar and Pedro D. Silva
curtain performance on the discharge air velocity (grille and back panel) of open refrigerated display cabinets. Traboulsi et al. [11] developed experimental and two-dimensional (2D) CFD study to evaluate the impact of intentional and non-intentional obstructions on the performance of the air curtain. Qualitative design combination of various geometrical parameters and various levels of obstruction in the direction of the air curtain flow are proposed in order to guarantee the existence of the air curtain. The velocity profiles were predicted and the infiltration rates were calculated assuming no obstruction or shelf extension for different values of the air curtain flow rate (from 0.02 to 0.13 m s-1). The infiltration rate decreases upon the increase of the flow rate, indicating the impact of increasing the Reynolds number and width of DAG. The infiltration rate was also evaluated for different values of the DAG angle (positive and negative). The minimum infiltration rate was found at discharge angle of -11º < α < -10.5º for a flow rate of 0.05 kg s-1.The obstruction of protruding shelves and boxes and cases near RAG was also numerically simulated. Besides the air curtain, also the efficiency of the heat exchanger is reduced to the environmental conditions. Finned-tube heat exchangers are extensively used in various industrial applications, including refrigeration. They are very compact, lightweight, and characterized by a relative low manufacturing cost [12]. Compact plate fin-and-tube heat exchangers (cooper circular tubes with or without inner corrugation and aluminium-corrugated fins) are usually used in VORDC. The most common arrangements of tubes are aligned and staggered. The latter option gives better performance in heat transfer due to the promotion of greater mixing in the flow. The staggered tubes result in a more efficient thermal interaction between air and the surfaces of the fins and tubes [13]. The heat transfer occurs between the air flowing through the fins and the refrigerant flowing inside the tubes in cross flow. The heat transfer coefficient at the airside is much smaller than the heat transfer coefficient from the inner side of the tubes, so it is important to optimize the heat transfer in the external flow [13]. The fins are responsible for a large increase in the area of external heat transfer, and still, the airside is responsible for at least 85% of the total resistance to heat transfer in this type of equipment [14-15]. During the VORDC running, the surfaces of the heat exchangers are at temperatures below the dew point and lower than the freezing point of water, therefore, condensation of water vapour present on the airflow with subsequent freezing on the surfaces of the fins and tubes is unavoidable. The frost formation between the fins reduces the air passage area, thus increasing the pressure drop and reducing the airflow. The significant reduction in airflow during the frost formation deteriorates the air curtain that protects the refrigerated space in case of VORDC. Thus, as the ambient air enters the refrigerated space, the optimal storage temperature of products is affected. This can lead to large losses due to changes in organoleptic properties of food. Hence, VORDC needs regular and scheduled stops of
operation to defrost the ice from the evaporator in order to recover the initial conditions of performance without affecting the food safety. Regarding the process of frost formation and defrost, an optimal design of a VORDC is achieved when it has the lowest frequency and time of defrosting. This way ensures a longer refrigeration time with consequent lower oscillation of displayed products temperature. The type, frequency and duration of defrosting are determined through experimental homologation tests conducted by the manufacturers of VORDC that are guided by current technical standards and that are directly related to the design of the heat exchanger. This issue has been widely studied, from refrigerants use [16-17], the performance evaluation of finned heat exchangers under frost formation conditions [18], the influence of environmental conditions on frost formation and defrosting on heat exchangers of VORDC [19] to the energy efficiency strategies in refrigeration systems of large supermarkets [20].
This paper follows the work developed by [21-24] and describes the results of 24-hours experimental tests following different test preparation procedures. The standard ISO 23953-2:2005 [5] defines that “5.3.2.2 Air movement: The air movement, shall be, as far as practicable, parallel to the plane of the cabinet display opening and to the longitudinal axis… …With the refrigerated display cabinet switched off, the air velocity at the three points… …shall be 0.2 m s-1”. Additionally it states that “5.3.2.4 Running in: …The test room shall be maintained at the desired climate class as specified in 5.3.1, while the temperatures of the M-packages are recorded”. If standard ASHRAE 72:2005 [25] is followed, the preparation of test cabinet and general test procedures states that “5.1.3 Air Currents. Test-room air currents shall be 90 degrees to the plane of case air curtain at a velocity range of 0.15-0.25 m s-1….” and “8.2 Stabilization Period: …With the test conditions stabilized as specified in Section 5, the refrigerator under test shall be pre-cooled and operated until repetitive conditions occur…”. Comparing the standards, there is a difference on the values range for the external air velocity in the test room. So, this paper tries to answer the following questions: (1) How the conditions of the test room should be specified? Following standard 23953-2:2005 [5], what will be the performance deviation if the air velocity of the test room is adjusted to meet 0.2 m s-1 after switching on the VORDC? (2) Since standard ASHRAE 72:2005 [25] allows a minimum external air velocity of 0.15 m s-1, upon this condition will the VORDC performance be significantly different? Answering these questions, it will be able to evaluate the relevance of the external air velocity on the VORDC performance. Two experimental tests (ET) were performed. Before the 24 hour test, the initial procedure to ensure an air velocity of 0.2 m s-1 at the front of the VORDC was performed considering that: (ET1) display case was switched off as required by ISO 23953-2:2005 [5] and (ET2) was switched on and used auxiliary ventilation to ensure an air velocity of 0.2 m s-1. Then, after reaching steady state conditions, the experimental
tests run for 24 hours. This paper compares and discusses the experimental results and performance parameters obtained for these tests. Its aim is to increase the awareness of all food chain players about the suitability of the initial procedure for setting the air movement defined in the standard.
II. EXPERIMENTAL PROCEDURE
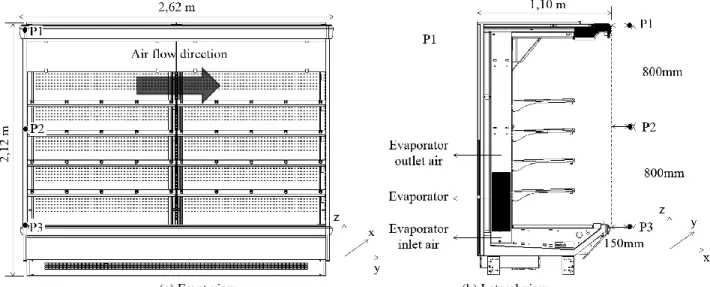
Tests were conducted in an environmental test chamber (Fig. 1) constructed according to ISO 23953 [5]. The cooling equipment selected for the experiments is a VORDC (1.10m×2.62m×2.12m) with a dual air curtain used for displaying meat products, which temperature should be maintained between -1 °C and 5 °C (ISO 23953-2:2005 class M1). After reaching steady state conditions using the different procedures of setting the external air movement (ET1 and ET2), each test period to analyse the thermal performance of the VORDC and its evaporator run for 24 hours. Each ET was carried out three times to minimize uncertainty.
Fig. 1 Environmental test chamber.
Thus, each ET followed a different procedure concerning the test room preparation:
ET1 (strictly according to ISO 23953-2:2005 [5]):
- Average value of the air movement parallel to the frontal opening of the VORDC switched off is set to 0.2 m s-1 (±10%) in each of the three air flow measuring points (P1, P2 and P3) shown in Fig. 2b;
- After reaching steady state conditions, the VORDC is switched on, and the experimental test runs for 24 hours.
ET2 (according to ISO 23953-2:2005 [5]):
- With the VORDC switched on, the air movement parallel to the frontal opening of the VORDC is adjusted with auxiliary fans to meet a value of 0.2 m s-1 (±10%) in each of the three air flow measuring points (P1, P2 and P3) shown in Fig. 2b;
- The experimental test runs for 24 hours after reaching steady state conditions.
A. Experimental Apparatus
The VORDC shown in Fig. 2 comprises (1) an insulating body (IB) surrounding all the equipment; (2) tube and fins heat exchanger (HX); (3) discharge air grille (DAG); (4) return air grille (RAG); (5) perforated back panel (PBP) and shelves (SH). The temperature of the refrigerated compartment is provided by the cold air mass flow that exits DAG and PBP and returns to RAG to be cooled again in the HX. The airflow exiting DAG forms an air curtain that protects the inner refrigerated compartment. Note that this equipment has a primary air curtain (PAC) and a secondary air curtain (SAC) in order to promote a more effective aerothermodynamics sealing. The air for SAC is collected from the bottom front of the VORDC. The equipment has four fans with 53 W each to supply a flow rate of 0.4 m3 s-1 to DAG and PBP. The air, before reaching the DAG, passes through an evaporator with dimensions 2.20x0.13x0.35 m3 constituted by 222 fins and three rows of tubes in the airflow direction and 8 rows of tubes perpendicular to it. The DAG has a total width, b, of 140 mm, which is equally distributed to form the PAC (bPAC = 70 mm)
and SAC (bSAC = 70 mm). It was installed a remote mechanical
system with a compressor Octagon 2DC-3.2 and water condenser. The measuring instruments were selected in order to obtain reliable measurements of the relevant physical properties variation collected every minute during the experimental test.
(a) Front view. (b) Lateral view. Fig. 2 Open vertical refrigerated display case with dual air curtain.
The manufacturer of the VORDC recommends for ideal operation an evaporation temperature of -10 ºC, ensuring products temperature within the prescribed limit range: -1 ºC to 5 ºC. Initially, the VORDC defrosts 10 times per day, and each defrost period lasts 12 minutes. The defrosting control system consists of stopping the cooling system while maintaining the fans in operation in order to defrost the ice on the evaporator surface by flowing ambient-temperature air. For testing purposes, there is no controller limiting the compressor work, whether a thermostat that ceases its operation depending on temperature, or some other mechanism, which turns off the compressor during the operating period. The compressor is only switched off when the defrosting process begins.
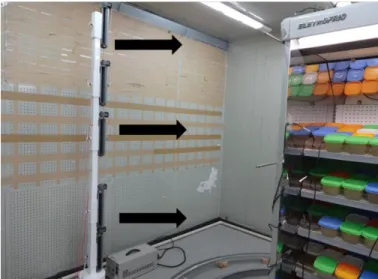
For ET2, centrifugal fans were used to adjust the external air velocity to 0.2 m s-1 (±10%) in each of the three airflow-measuring points (P1, P2 and P3). These devices are shown in Fig. 3.
Fig. 3 Location of centrifugal fans used to provide auxiliary ventilation.
B. Measuring Devices
Air temperature and humidity sensors Super MT 530 were placed in DAG, RAG and ambient. Temperature sensors type PT1000 were placed in the test M-packages (product simulators) (see Fig 4a). A Coriolis flow meter MASSFLO 2100 DI 6 was installed at the liquid refrigerant line. Table 1 shows the experimental techniques and probes/experimental measuring devices used to collect the relevant physical properties. Data acquisition related to air and products temperatures, relative humidity, velocity and pressure drop was conducted at 1-minute interval in order to analyse
variations of these values over time. To measure physical parameters on the R22 refrigerant side and external airflow velocity, data was collected according to the recommendations provided by ISO 23953:2005 [5].
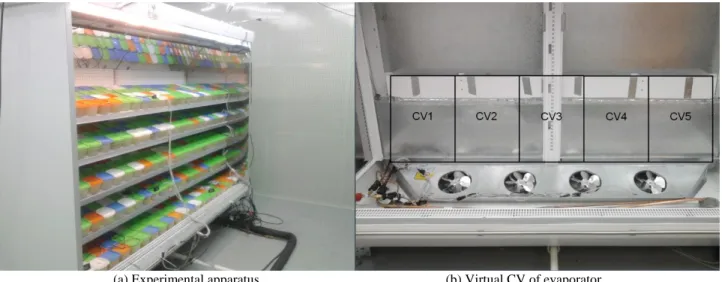
To measure physical quantities on the evaporator airside, sensors were positioned at five equidistant points from the air inlet and outlet along the length (y) of the evaporator (Fig. 2a). Thus, the evaporator was divided into 5 virtual control volumes (CV), so that air temperature, humidity and velocity in each CV are considered constants (Fig. 4b). The air distribution in the evaporator as well as which zones are more or less likely to form frost was determined following this procedure. The mass of water condensed during defrosting was manually collected and measured during each test period. The outlet mass flow of the liquid coolant, which passed through the evaporator during each operating period, was monitored by a Coriolis flow monitor.
III. MATHEMATICAL MODEL
The total heat load of the cooling system on the refrigerant liquid side, QTOT, is determined by calculating the difference in enthalpies between inlet, ir,i, and outlet,
i
r,o, and the massflow of the liquid refrigerant, mr, as described in ISO 23953 [5] and shown in (1).
r,o r,i
r TOT m i i
Q (1)
In order to determine the total heat load and its components on the airside, the airflow rates and the condensation and freezing rates of water for each cooling cycle were determined. The mass flow of air, ma, was determined by (2), assuming uniform rates of outflow for each CV, and using the average values of air velocity, Va, and density, a, at the inlet and outlet
(experimental measurements based on the principle of conservation of mass areas) of the evaporator of cross section, A.
A V ρ
ma a a (2)
Table 1. Experimental techniques and probes/experimental measuring devices.
Experimental technique Model Measuring range Accuracy
Thermometry PT 1000 -40°C to +80°C ± 0.3 °C
MT 530 Super -10°C to 70°C ± 1.5 °C
Hygrometry MT 530 Super 20% to 85% ± 5%
Anemometry HD2903TC3.2 0.05 m.s-1 to 1 m.s-1 ± 2%
Flowmetry MASSFLO 2100 0 to 1000 kg.h-1 ± 0.1%
(a) Experimental apparatus. (b) Virtual CV of evaporator. Fig. 4 Division of evaporator into virtual control volumes (CV).
The absolute humidity of the air at inlet,
a,i, and outlet, oa,
, areas of the evaporator was measured using psychrometric concepts using the average values of air temperature and relative humidity in these locations. Thus, the mass flow of condensed water is determined for the period in which the refrigeration was turned on, mw,OP, and for theperiod in which the refrigeration was turned off, mw,DEF, using
(3). The mass flow of water collected in experimental sampling during the defrosting period, mw,EXP, given by (4), is
the sum of the mass flow of ice formation on the evaporator during the operation period, mI, and mw,DEF. A small part of
the mw,OP was drained without freezing. This mass flow,
DRAIN w, m , is determined by (5).
a,i a,o
a w
m
m
(3) DEF w, I EXP w, m m m (4) I OP w, DRAIN w, m m m (5)The total heat load can be determined by the sum of the heat load components expressed by (6) to (10), according to Sweetser [15]. These components are: Qa,COLD = latent heat load of air-cooling (air passing through the evaporator);
COND w,
Q = Sensible heat load of water vapour condensation; Qw,FREEZE = sensible heat due to freezing of condensate water; QI,COLD = latent heat load of ice cooling.
a,i a,o
COND w, COLD a, Q m i i Q a (6) w OP w, COND w, m h Q (7)
DEW FREEZE
w p, I COLD w, m c T T Q (8) h m Qw,FREEZE I I (9)
T T
c m QI,COLD I p,I FREEZE I (10)The total, sensible and latent heat loads can be determined by (11), (12) and (13), respectively. COLD I, FREEZE w, COLD w, COND w, COLD a, TOT Q Q Q Q Q Q (11) FREEZE w, COND w, LAT Q Q Q (12) COLD I, COLD w, COLD a, SENS Q Q Q Q (13)
Correspondingly, two methods of determining the refrigeration heat load are obtained. The results of these two calculation methods are compared and discussed.
IV. ANALYSIS AND DISCUSSION OF RESULTS A. External air velocity
During the phase of preparation of test VORDC and general test procedures, the external air velocity was set by two different methods: ET1 and ET2. According to standard ISO 23953:2005 [5], the air velocity shall be 0.2 m s-1 (±10%) at the three reference points (P1, P2 and P3) with the VORDC switched off (ET1). However, since the objective is to maintain the external air velocity at 0.2 m s-1, other test was performed (ET2). In this test, the VORDC is switched on and the external air velocity is adjusted by auxiliary ventilation to meet an average value of 0.2 m s-1 measured during 1 min with a maximal interval of 5 sec at each of the points P1, P2 and
P3. For both tests, after accomplishing this condition, 24-hour tests were performed to the VORDC. The comparison of these experimental results allows to evaluate the influence of the initial procedure used to set the external air movement on airflow distribution, thermal load and energy consumption. Additionally, allows quantifying the effect of the two methods on the evaporator performance.
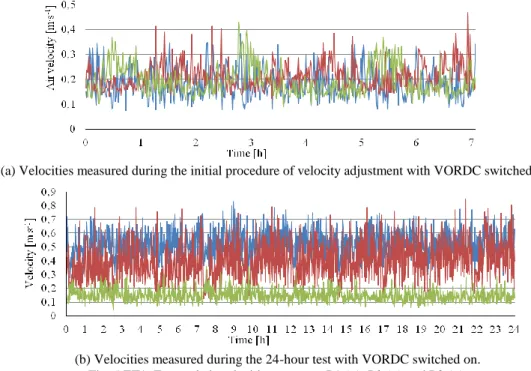
Fig. 5 shows the measured values of the air velocity on points P1, P2 and P3 for ET1. Fig. 5a shows the air velocities measured during the initial procedure of setting the external air velocity with the VORDC switched off. This procedure last 7 hours until steady state conditions were accomplished inside the test chamber and VORDC. The three points average velocity was 0.193 m s-1 (±10%), which complies with standard. Then, the 24-hour test with VORDC switched on was started. The air velocities measured during this test are shown in Fig. 5b. Comparing Fig. 5a and Fig. 5b for the initial procedure used in ET1, the values of the external air velocity are significantly changed from the 0.2 m s-1 previously set when the 24-hour test began.
The air velocity at P1 and P2 increases and at P3 decreases (see Fig. 5b and Table 2). The three points average velocity is 0.353 m s-1 (±10%), so the external air movement becomes higher than 0.2 m s-1 (±10%). This fact is due to the interaction of the ambient airflow with the air curtain flow. Additionally, this interaction promotes the escape of a certain amount of cold air from the air curtain that creates a restriction area to external airflow at the bottom of the test chamber.
For the initial procedure used in ET2, the value of the external air movement was adjusted to 0.2 m s-1 using auxiliary ventilation with the equipment operating, i.e., with the influence of the air curtain flow. Thus, the values of air velocity at points P1, P2 and P3 during the 24-hour test are within the range (0.2 m s-1 ± 10%), described in the standard. Table 2 shows the average air velocity at reference points P1,
P2 and P3 for the two different methods during the 24-hour tests. The ET1 method promotes a greater non-uniformity of air temperature inside the VORDC than the ET2 method. This condition is due to the increased interaction between the external air movement and the air curtain.
Table 2. Average air velocity during 24-hour tests. Test vP1 [m s-1] vP2 [m s-1] vP3 [m s-1]
ET1 0.52 0.39 0.15
ET2 0.17 0.19 0.20
Difference -0.35 -0.20 +0.05
B. Air humidity, condensation and freezing of water The rates of condensation and freezing of water between the evaporator fins increase with the parallel velocity of the ambient air. The aim of this experimental study was to measure how representative is the increase of ambient air velocity on the rates of condensation and freezing during the operation and defrost periods.
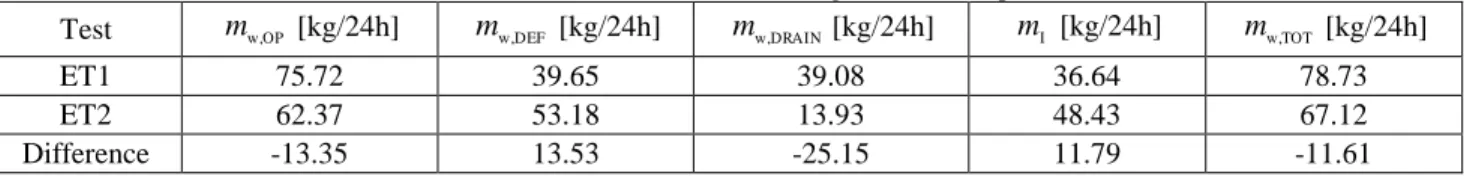
The experimental results obtained for the tests conducted for ET1 and ET2 methods are shown in Table 3. Comparing these experimental results, it can be concluded that in ET1 method: (1) the total quantity of condensed water in the evaporator is 17% greater; (2) the quantity of water that solidifies between fins is 25% lower; and (3) the quantity of water that drains during the operating period is 180% greater. Such figures prove the significant influence of the air movement setting procedure on the operation of the evaporator regarding its frost formation.
(a) Velocities measured during the initial procedure of velocity adjustment with VORDC switched off.
(b) Velocities measured during the 24-hour test with VORDC switched on. Fig. 5 ET1: External air velocities at sensor P1 (−), P2 (−) and P3 (−).
Table 3 Values of condensation and freezing of water in experimental tests.
Test mw,OP [kg/24h] mw,DEF [kg/24h]
m
w,DRAIN [kg/24h] mI [kg/24h] mw,TOT [kg/24h]ET1 75.72 39.65 39.08 36.64 78.73
ET2 62.37 53.18 13.93 48.43 67.12
Difference -13.35 13.53 -25.15 11.79 -11.61
C. Air distribution and pressure loss in the evaporator For both 24-hour tests with different air movement setting procedures, the distribution of airflow was evaluated at two separate times: when the evaporator was completely clean, i.e. after defrosting the coil, and immediately before defrosting it (largest frost formation). The percentage distribution of airflow in the five virtual CV of the evaporator is shown in Fig. 6. The airflow is equally distributed in each CV for both initial procedures for setting the air movement (ET1 and ET2) after defrosting. The CV2 possesses the largest airflow and the largest air velocity passing between fins. The lowest quantity of airflow circulating in CV1 and CV5 can be attributed to extremities effects (friction and consequent pressure drop) on the evaporator. When the evaporator is ready to be defrosted, the percentage distribution of airflow is significantly different from after defrosting. This fact is attributed to the irregular formation of frost. The airflow through CV1 is less than in other CV. The frost most likely will form in this region because the airflow has the first contact with the air curtain in this area (this result is in accordance with the numerical simulations of Gaspar et al. [6]. For ET1, the airflow reduction (due to more frost) is more significant because before defrosting only 4% of the airflow circulating in the evaporator went through this region. This drastic reduction suggests that the frost formation grows significantly as a function of air velocity magnitude. The increase in the percent airflow mainly in CV2 and CV4 is due to being regions less likely to form frost and therefore, as the resistance to outflow is lower than other CVs, they become the preferred paths for air. During the cooling period, the total absolute airflow decreased 13% for ET1 and 23% for ET2.
D. Influence of frost formation on air and product temperatures
Fig. 7 shows the variation of air temperature entering and leaving the evaporator for ET1 and ET2. The air temperature at the evaporator outlet is lower for ET2 than ET1. This is due to the lower value of the external air velocity. For ET1, the air inlet and outlet temperatures are much greater than for ET2 because the air curtain is strongly affected by the increase of external air velocity. This fact explains the lower ice formation and greater condensation when the ET1 is used to set the external air velocity.
Fig. 7 Air temperatures in the evaporator.
(a) ET1. (b) ET2.
Table 4 Thermal cooling load and M-packages temperature at different heights (shelves) for the case studies.
Test Heat load [kW] M-packages temperature [°C]
Shelf 4 (SH4) Shelf 3 (SH3) Shelf 2 (SH2) Shelf 1 (SH1) Well tray (WT)
ET1 5.93 9.8 8.7 8.6 9.2 10.7
ET2 5.28 4.1 3.3 2.9 3.1 3.6
The temperature of M-packages (product simulators) in ET1 stabilized in higher values than in ET2 as shown in Table 4. The average product temperatures is 9.4 °C for ET1 and 3.4 °C for ET2. The limit to maintain the food safety of products is 5 °C. This condition also highlights the influence of the external air velocity on the thermal performance of the VORDC.
E. Heat Loads
The total heat load and its components are shown in Fig. 8. The heat load of the equipment decreases 12% from ET1 to ET2. For ET1, the latent heat load represents 42% of the total heat load, with the remaining 58% due to sensible heat of cooling the air, water and ice. The latent heat due to freezing the water represents only 2.5% of the total load and the sensible heat load due to cooling water and ice represents only 0.5% of the total load. In ET2, the latent heat load (condensation and freezing of water) represents 41% of the total heat load, with the remaining 59% due to sensible heat of cooling the air, the water and frost. The latent heat due to freezing of water represents only 4% of the total load and the sensible heat load due to cooling the water and ice represents only 0.4% of the total load.
Another comparison that is worth to be mentioned is the ambient air velocity defined in ASHRAE standard 72-2005. This standard suggests an air velocity parallel to the frontal opening of the VORDC between 0.15 m s-1 and 0.25 m s-1. As this standard allows testing the VORDC with lower air velocity, the performance results for the same VORDC will be better. Future work will be developed with the aim of comparing the performance of the VORDC when subjected to the test conditions of ASHRAE and ISO. The results should contribute to the development of new equipment with reduced energy consumption, heat exchangers size and production cost.
V. CONCLUSIONS
Experimental tests are performed for different external air movement setting procedures. One test follows strictly the procedure defined in the ISO 23953, i.e., setting the air movement with the display cabinet switched off (ET1). The other test considered setting the external air movement with the open refrigerated display case switched on (ET2) using auxiliary ventilation. After reaching steady state conditions, each test run for 24 hours. The main conclusions of this study are: (1) the procedure defined in ISO 23953, i.e., setting the air movement with the display cabinet switched off (ET1) results in a higher requirement for food safety. The average air velocity in front of the equipment will be higher due to the interaction with the air curtain when the display case is operating. (2) The thermal load is 12% higher when the ET1 method is used; (3) By opposition, if the air movement is set to 0.2 m s-1 (±10%) with the display cabinet switched on (ET2), the effective value of the horizontal air movement is lower than ET1 as it already considers the contribution of the air curtain velocity. Thus, the ambient condition simulated is less demanding although it maintains a constant external air velocity; (4) The increase of internal temperature in the display case means that less ice is formed between the evaporator fins, but more water is condensed during the operation, thus reducing the frequency of periodic defrost; (5) The area on the evaporator most affected by ice formation is the extremity located on the side where the ambient air is coming from.
(a) ET1. (b) ET2.
This paper verifies that the air movement procedure is very relevant for the thermal cooling load calculation. An equipment design according to this procedure of the testing standard will be able to operate correctly under ambient conditions more demanding and thus providing a better thermal performance. However, the equipment design following strictly the part of the general test procedures defined in ISO 23953 will provide an equipment with higher energy consumption. Nevertheless, this equipment are able to handle with adverse ambient conditions ensuring the food safety. However, the experimental results show that air movement procedure defined in the standard may not be sufficient to set a constant air movement during the 24 hours test due to the interaction with the air curtain flow. This condition is reflected in a higher thermal cooling load. Performing tests with the VORDC switched on and ensuring an external air movement within 0.2 m s-1 (±10%) allows marketing a VORDC with lower energy consumption without showing operation problems. Another possibility is to perform tests according to ASHRAE standard 72-2005, as the procedure to adjust the air velocity in the climatic chamber can be carried out with the VORDC switched on and using a lower air velocity (0.15 m s-1). NOMENCLATURE A Area (m²) CV Control Volume p c Specific heat (kJ kg-1 K-1)
DCOFF Display case switched off DCON Display case switched on
h Latent heat (kJ kg-1)
i Specific enthalpy (kJ kg-1)
m Mass flow (kg s-1)
P Reference point
Q Heat load of cooling (kW)
T Temperature (°C)
V Velocity (m s-1)
Absolute humidity (kgwat kgair-1)Greek symbols Specific mass (kg m-3) T Temperature difference (°C) Subscripts a Air COLD Cooling COND Condensation DEF Defrosting DEW Dew DRAIN Drain EXP Experimental FREEZE Freezing i Inlet I Ice LAT Latent o Outlet OP Operation P1 Reference point 1 P2 Reference point 2 P3 Reference point 3 r Refrigerant fluid SENS Sensible TOT Total W Water REFERENCES
[1] H. K. Navaz, R. Faramarzi, M. Gharib, D. Dabiri, D. Modarress, "The application of advanced methods in analyzing the performance of the air curtain in a refrigerated display case", Journal of Fluids Engineering, vol. 124, no. 3, pp. 756-764, 2000.
[2] P. D. Gaspar, L. C. Gonçalves, R. A. Pitarma, "Experimental analysis of the thermal entrainment factor of air curtains in vertical open display cabinets for different ambient air conditions", Applied Thermal Engineering, vol. 31, no. 5, pp. 961-969, 2011.
[3] ASHRAE Handbook: Refrigeration, American Society of Heating, Refrigerating and Air Conditioning Engineers (ASHRAE), Inc, 2010. [4] R. Faramarzi, "Efficient display case refrigeration", ASHRAE Journal,
vol. 4, no. 11, pp. 46–51, 1999.
[5] ISO 23953-2 2005, Refrigerated display cabinets - Part 2: Classification, requirements and test conditions, International Organization for Standardization (ISO), 2005.
[6] P. D. Gaspar, L. C. C. Gonçalves, R. A. Pitarma, "Detailed CFD modelling of open refrigerated display cabinets", Modelling and Simulation in Engineering, Hindawi Publishing Corporation, vol. 2012, 2012.
[7] P. D. Gaspar, L. C. C. Gonçalves, R. A. Pitarma, "CFD parametric studies for global performance improvement of open refrigerated display cabinets", Modelling and Simulation in Engineering, Hindawi Publishing Corporation, vol. 2012, 2012.
[8] P. D. Gaspar, L. C. C. Gonçalves, X. Ge, "Influence of ambient air velocity orientation in thermal behaviour of open refrigerated display cabinets", in Proc. ASME ESDA 2010 - 10th Biennial Conference on Engineering Systems Design and Analysis, 2010.
[9] P. D. Gaspar, L. C. C. Gonçalves, X. Ge, "CFD parametric study of ambient air velocity magnitude influence in thermal behaviour of open refrigerated display cabinets", in Proc. 5th European Conference on Computational Fluid Dynamics (ECCOMAS CFD 2010), Lisbon, Portugal, 2010.
[10] P. D. Gaspar, L. C. C. Gonçalves, A, Vogeli, A., "Dependency of air curtain performance on discharge air velocity (grille and back panel) in open refrigerated display cabinets", in Proc. ASME Int. Mechanical Engineering Congress and Exposition, Lake Buena Vista, Florida, U.S.A, 2009.
[11] S. M. Traboulsi, A. Hammoud, M. F. Khalil, "Air curtains integrity when misusing the refrigerated display cabinets", WSEAS Transactions on Fluid Mechanics, vol. 4, no. 2, pp. 58-72, 2009.
[12] C. C. Wang, Y. M. Hwang, Y. T. Lin, "Empirical correlations for heat transfer and flow friction characteristics of herringbone wavy fin-and-tube heat exchangers", International Journal of Refrigeration, vol. 25, no. 5, pp. 673–680, 2002.
[13] R. L. Webb, Principles of enhanced heat transfer. John Wiley & Sons, Inc., U.S.A, 1994.
[14] C. C. Wang, W. L. Fu, C. T. Chang, "Heat transfer and friction characteristics of typical wavy fin and tube heat exchangers", Experimental Thermal Fluid Science, vol. 14, no. 2, pp. 174–186, 1997. [15] C. C. Wang, Y. T. Lin, C. J. Lee, Y. J. Chang, "Investigation of wavy fin-and-tube heat exchangers: a contribution to databank", Experimental Heat Transfer, vol. 12, no. 1, pp. 73–89, 1999.
[16] I. Sârbu, E. S. Valea, "Past, present and future perspectives of refrigerants in air-conditioning, refrigeration and heat pump applications", WSEAS Transactions on Heat and Mass Transfer, vol. 9, pp.. 27-38, 2014.
[17] M. Feiza, M. D. Elena, M. Panaitescu, M., "A point of view on efficiency and innovation in refrigeration", Recent Advances in Energy, Environment, Economics and Technological Innovation - Mathematics and Computers in Science and Engineering Series, 19, WSEAS Press, Greece, 2013.
[18] N. F. Aljuwayhel, D. T. Reindl, S. A. Klein, G. F. Nellis, "Experimental investigation of the performance of industrial evaporator coils operating under frosting conditions", International Journal of Refrigeration, vol. 31, no. 1, pp. 98-106, 2008.
[19] S. A. Tassou, D. Datta, "Influence of supermarket environmental parameters on the the frosting and defrosting of vertical multideck display cabinets", ASHRAE Transactions, vol. 105, no. 1, pp. 491-496, 1999.
[20] J. M. Garcia, L.M.R. Coelho, "Energy efficiency strategies in refrigeration systems of large supermarkets", International Journal of Energy and Environment, vol. 4, no. 3, pp. 63-70, 2010.
[21] G. G. Heidinger, S. M. Nascimento, P. D. Gaspar, P. D. Silva, "Impact of environmental conditions on the performance of open multideck display case evaporators", in Proc. 2nd IIR International Conference on Sustainability and the Cold Chain (ICCC 2013), Paris, France. April 02 - 04, 2013.
[22] S. M. Nascimento, G. G. Heidinger, P. D. Gaspar, P. D. Silva, "Experimental quantitative evaluation of thermal performance in refrigerated displays case with variation of the thickness of the air curtain and perforation density of the back panel", in Proc. 2nd IIR International Conference on Sustainability and the Cold Chain (ICCC 2013), Paris, France. April 02 - 04, 2013.
[23] S. M. Nascimento, G. G. Heidinger, P. D. Gaspar, P. D. Silva, "Experimental evaluation and qualitative increase of thermal load in open refrigerated display cases due to breakage of the air curtain", in Proc. 2nd IIR International Conference on Sustainability and the Cold Chain (ICCC 2013), Paris, France. April 02 - 04, 2013.
[24] S. M. Nascimento, G. G. Heidinger, P. D. Gaspar, P. D. Silva, "Performance variation of vertical open refrigerated display cases in-situ operation and testing according to ISO and ASHRAE standards", in Proc. 3rd IIR International Conference on Sustainability and Cold Chain (ICCC 2014), London, United Kingdom, June 23-25.
[25] ASHRAE 72-2005, Method of testing open and closed commercial refrigerators and freezers (ANSI Approved), American Society of Heating, Refrigerating and Air Conditioning Engineers (ASHRAE), Inc, 2005.
[26] R. Sweetser, Investigation of relative humidity impacts on the performance and energy use of refrigerated display cases, University of Groningen, GAS Research Institute, Final Report, 2000.