UNIVERSIDADE DE LISBOA
FACULDADE DE CIÊNCIAS
DEPARTAMENTO DE BIOLOGIA ANIMAL
Characterization of Cetaceans in the South coast of
Portugal between Lagos and Cape São Vicente
Joana Madeira Cardoso de Castro
Mestrado em Ecologia Marinha
UNIVERSIDADE DE LISBOA
FACULDADE DE CIÊNCIAS
DEPARTAMENTO DE BIOLOGIA ANIMAL
Characterization of Cetaceans in the South coast of
Portugal between Lagos and Cape São Vicente
Joana Madeira Cardoso de Castro
Mestrado em Ecologia Marinha
Dissertação orientada por:
Professor Doutor Carlos A. Assis
Acknowledgments
This thesis could not have been done without the help of several people.
First of all, a big “THANK YOU” to my dear adviser and friend Carlos A. Assis. For always be there for me, at any time! For the support, help, trust and consideration. There are no words to express how grateful I am. In the past 5 years of my life You were a truly adviser, in all the aspects.
To Renaud de Stephanis, as adviser and friend. For being responsible for an enormous change in my life, that I will never forget.
To the company “Mar Ilimitado” for all the help and for all the data, that allowed the realization of this project!! A very special “thanks”.
To Dave and Lesley Lundquist, for everything! A special thanks to Dave for being the best “boss” ever, for all the teaching, and most of all for being a true friend.
To Aude Pacini, for being amazing!! For all the skype conversation that help so much during this process! Thanks for always being present in my life.
To Mithriel MacKay, another big friend in the adventure that is to study cetaceans! Thanks for all the English corrections and all the support. Also to Arnold B-Nagy, for all the corrections in the GIS analyze.
To Patrícia Malico….There are no words!!! Absolutely tireless in all this process. I couldn’t have make it without you…. There are really no words!
To all the CIRCÉ team, Portuguese and Spanish, for the enormous support and help in the data analyse. A special thanks to João Gonçalves, Gonçalo Prista e Marina Laborde. To André Cid, for never judging me. Always present, always comprehensive and always there.
Finally to my family!!! This thesis is dedicated to them. Thanks for always believing in me. Thanks for always deal with my bad moods, thanks for everything…… to my mom, for making me laugh when I really just wanted to cry; to my dad, for the giving me all the serenity and guidelines in my life; to my sister Teresa, that at this point is sick of hearing about dolphins, but always supportive; to my sister Rita, for always telling me not to worry; and to my grandfather João, for reminding me that “Joana és a fera da casa, tu safaste bem”. Thanks to all of you!
1
Index
RESUMO ... 5 Abstract ... 8 1. Introduction... 9 2. Study Area... 11 3. Studied Species ... 14 4. Methodology ... 194.1. Data Collection – Survey and Sightings ... 19
4.1.1. Field data collection... 19
4.1.2. Presence and relative abundance of cetaceans ... 20
4.1.3. Spatial distribution and bathymetry... 21
4.1.4. Social organization: group size, group cohesion and presence or absence of calves... 21
4.2. Data Collection - Photo-ID... 22
5. Results... 25
5.1. Surveys and Sightings... 25
5.1.1. Presence of cetaceans and relative abundance ... 25
5.1.2. Spatial distribution of the different species of cetaceans... 26
5.1.3. Bathymetry and Slope ... 34
5.1.4. Social organization ... 37
5.2. Photo identification... 43
6. Discussion... 44
6.1.Spatial distribution, abundance and social organization of cetaceans ... 44
6.2. Photo identification... 52
7. Final Considerations... 54
8. References ... 55
-Index of Figures
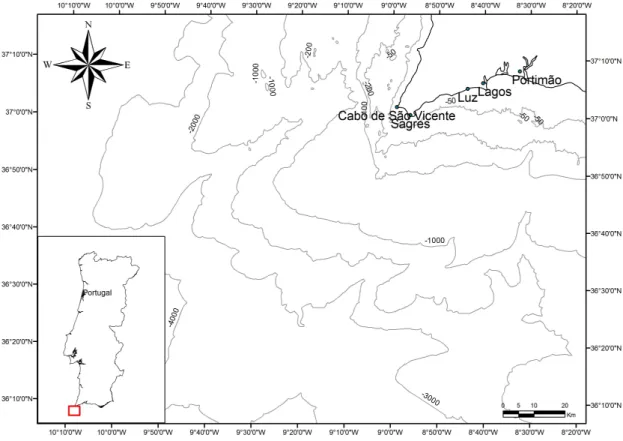
Figure 1. Location of the study area... 12
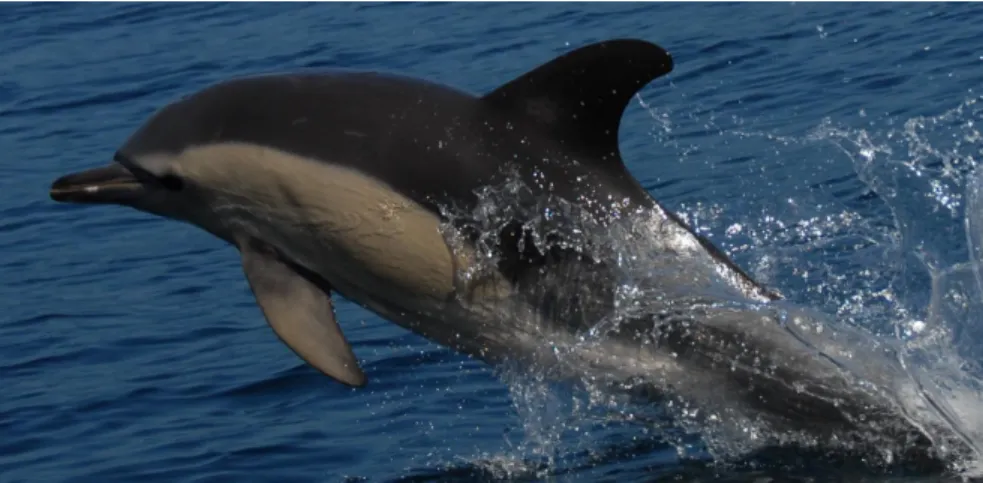
Figure 2. Short-beaked Common dolphin in the South of Portugal (photo by Joana Castro)... 14
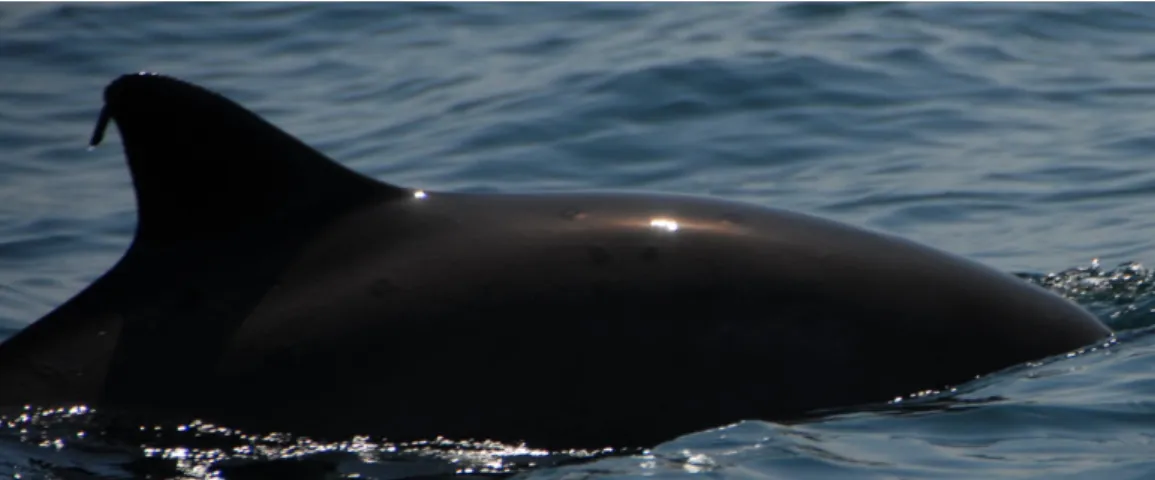
Figure 3. Harbour porpoise in the South of Portugal (photo by Joana Castro)... 15
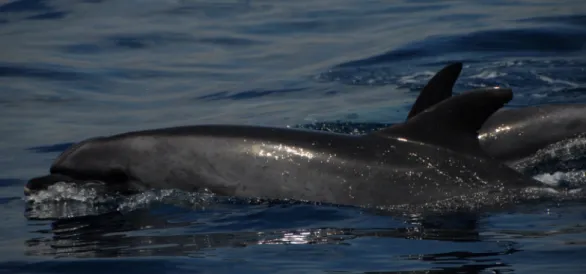
Figure 4. Atlantic Bottlenose dolphin in the South of Portugal (photo by Joana Castro). . 16
Figure 5. Photo-id angles... 23
Figure 6. Photo Q0... 24
Figure 7. Photo Q1... 24
Figure 8. Photo Q2... 24
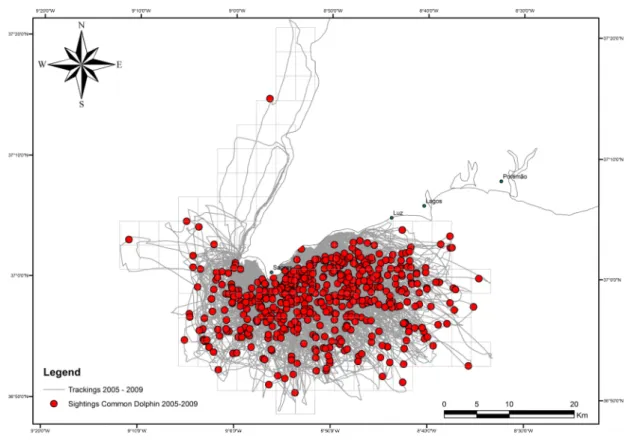
Figure 9. Observation effort (km) during 2005-2009 (grey lines) and the sightings of Common dolphins (red dots)... 27
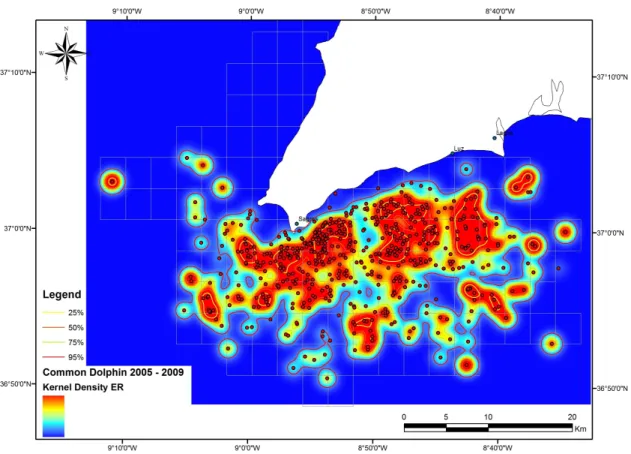
Figure 10. Kernel density spatial distribution of Common dolphins weighted by the encounter rate (ER) during 2005-2009, representing areas of higher probability of hotspots. ... 28
Figure 11. Kernel density spatial distribution of Common dolphins weighted by the abundance index (AI) during 2005-2009, representing areas of higher probability of hotspots. ... 28
Figure 12. Observation effort (km) during 2009 (grey lines) and the sightings of Harbour porpoises (blue dots). ... 29
Figure 13. Kernel density spatial distribution of Harbour porpoise weighted by the encounter rate (ER) during 2009, representing areas of higher probability of hotspots. ... 30
Figure 14. Kernel density spatial distribution of Harbour porpoises weighted by the abundance index (AI) during 2009, representing areas of higher probability of hotspots. ... 30
Figure 15. Observation effort (km) during 2009 (grey lines) and the sightings of Bottlenose dolphins (green dots). ... 32
- 2
-
3
Figure 16. Kernel density spatial distribution of Bottlenose dolphins weighted by the encounter rate (ER) during 2009, representing areas of higher probability of hotspots. ... 32 Figure 17. Kernel density spatial distribution of Bottlenose dolphins weighted by the abundance index (AI) during 2009, representing areas of higher probability of hotspots. ... 32 Figure 18. Observation effort (Km) during 2009 (grey lines); sightings of Minke whale (pink dots); sightings of Risso’s dolphin (yellow dots); sightings of Humpback whale (black dots). ... 33 Figure 19. Distribution of number of sightings of Common dolphins (bars) and encounter rate in sightings/kilometers (♦) in relation to depth from 2005-2009... 34 Figure 20. Distribution of number of sightings of Harbour porpoise (bars) and encounter rate in sightings/kilometers (♦) in relation to depth in 2009. ... 35 Figure 21. Distribution of number of sightings of Bottlenose dolphins (bars) and encounter rate in sightings/kilometers (♦) in relation to depth in 2009. ... 36 Figure 22. Number of sightings of Common dolphins in relation to group size in2005-2009... 37 Figure 23. Number of sightings of Common dolphins in relation to group cohesion in 2009.
... 38 Figure 24. Box & Whiskers plot: Effort rate to sight at least a group with calves per year (presence or absence of calves/distance navigated in each track (Kilometers)). .. 39 Figure 25. Number of sightings of Harbour porpoise in relation to group size in 2009. .... 40 Figure 26. Number of sightings of Harbour porpoise in relation to group cohesion in 2009.
... 40 Figure 27. Number of sightings of Bottlenose dolphins in relation to group size in 2009.. 41 Figure 28. Number of sightings of Bottlenose dolphins in relation to group cohesion in 2009... 42 Figure 29. Number of sightings of Bottlenose dolphins in relation to present (Pr) or absence (Ab) of calves during 2009. NI stands for no information... 42
4
Index of Tables
Table I - Classifications of group cohesion... 21 Table II - Quality rating for photos used in photo-id process... 23 Table III - Number of sightings of common dolphins (Delphinus delphis), mean group size, standard deviation (SD), encounter rate (ER) and abundance index (AI) calculated in relation to the observation effort in 2005-2009... 25 Table IV - Number of sightings per species, mean group size, standard deviation (SD), encounter rate (ER) and abundance index (AI) for 2009. ... 26 Table V - Distribution of number of sightings of Common Dolphin and encounter rate in relation to slope during 2005-2009... 35 Table VI - Results from the Dunn test, showing the significance between the years (significant p values in bold)... 39 Table VII - Number of pictures analyzed according to quality rating. ... 43
5
RESUMO
A Costa Sul de Portugal Continental é uma das regiões do país mais populares para observação de cetáceos na natureza, contando actualmente com a presença de 14 empresas licenciadas para a actividade. No entanto, os conhecimentos e os estudos realizados sobre cetáceos nesta região são muito limitados. De facto, grande parte da informação sobre a ocorrência de cetáceos na Costa Algarvia é proveniente de dados de arrojamentos, que indicam a possivel presença de 11 espécies de cetáceos diferentes.
Para uma melhor compreensão da utilização das águas a Sul da Península Ibérica pelas diferentes espécies de cetáceos que aí ocorrem, é necessária uma caracterização das espécies ou populações existentes ao largo da costa algarvia. Neste sentido, pretende-se com este projecto levar a cabo uma caracterização da área entre Lagos e o Cabo de São Vicente no que se refere às espécies de cetáceos que aí possam ocorrer e comparar os resultados obtidos com dados disponíveis referentes às populações estudadas até ao Estreito de Gibraltar.
Para este estudo utilizar-se-ão dados recolhidos em cooperação com uma empresa de Whale watching “Mar Ilimitado”, tomada como plataforma de oportunidade para recolha de dados no campo. A recolha dos dados está limitada à área abrangida pela empresa (Sagres-Lagos), bem como pelo limite de distância à costa a que a embarcação está sujeita, no caso em questão 5 milhas. Para o presente estudo serão recolhidos e analisados dados correspondentes à época de 2009, complementados com dados anteriormente recolhidos pelos técnicos da empresa, correspondentes a uma série temporal com início no ano de 2005. Pretende-se também complementar estes dados com informações fornecidas por outras empresas existentes ao longo da costa algarvia.
Com este projecto espera-se obter os conhecimentos necessários para a caracterização das populações de cetáceos ocorrentes na costa Sudoeste de Portugal e contribuir para o alargamento desses conhecimentos à costa Sudoeste da Península Ibérica. Especificamente, espera-se obter uma listagem das espécies de cetáceos que ocorrem entre Lagos e o Cabo de São Vicente; uma base de dados de ocorrência, distribuição e abundância de cetáceos na área de estudo; catálogos destinados a permitir a foto-identificação dos cetáceos ocorrentes na área de estudo, em particular os golfinhos comuns, a espécie consistentemente mais observada na região; mapas com a distribuição das espécies, grupos ou indivíduos observados ao longo do período coberto pelo estudo; mapas de possíveis hotspots para as espécies presentes; distribuição das espécies em relação à batimetria e declive da área de estudo; análise da coesão e estrutura dos grupos; presença ou ausência de crias para as espécies mais
6
frequentemente avistadas, nomeadamente o golfinho comum e o golfinho roaz; comparar o catálogo de foto-identificação de golfinho comum, elaborados no âmbito deste projecto, com documentos equivalentes abrangendo ocorrências no Golfo de Cádiz.Entre os anos de 2005 a 2009, inclusive, foram avistados na área de estudo 556 grupos de golfinhos comuns, resultando numa taxa de avistamento (ER) de 2.01 avistamentos.100 km-1.
Apenas durante o ano de 2009, foram avistados 228 grupos de cetáceos, correspondendo ao encontro de 6 espécies diferentes na área. Entre estes, a espécie mais avistada foi o Golfinho Comum (182 avistamentos; ER = 1,9 avistamentos.100km-1), o Boto (22 avistamentos; ER = 0,2 avistamentos.100km-1) e Golfinho Roaz (20 avistamentos; ER = 0,2 avistamentos.100km-1). As restantes espécies foram observadas ocassionalmente resultanto em, 2 avistamentos de Grampos, um avistamento de Baleia anã e um avistamento de Baleia de bossa. Em relação à batimetria, 99,3% dos avistamentos de golfinhos comuns ocorreram entre 50-200 m de profundidade. Em relação ao Boto e ao Golfinho Roaz, 100% dos avistamentos ocorreram entre 50-200 m de profundidade. O declive da área de estudo não é muito acentuado, sendo que no caso do Golfinho Roaz e do Boto, 100% dos avistamentos ocorreram na classe de declive de 0 – 80 m.km-1. Quanto ao golfinho comum 98,6% dos avistamentos ocorreram na classe de declive de 0 – 80 m.km-1.
A presença de crias de golfinhos comuns e roazes, foi uma constante durante o período amostrado. Em mais de 50% dos avistamentos de golfinhos roazes, durante o ano de 2009, crias estavam presentes no grupo; em relação ao Golfinho comum, usou-se o teste não paramétrico Kruskal-Wallis, com um intervalo de confiança de 95%, para comparar as diferenças entre os anos de 2005 a 2009 em relação à presença/ausência de crias. Verificou-se que existem diferenças significativas em relação ao esforço, de ano para ano, para encontrar pelo menos um grupo com crias (H=91,6; p << 0,05).
O cátalogo de foto-identificação de Golfinhos Comuns, iniciado no verão de 2009, permitiu o registo de 342 indivíduos. Ao comparar-se este catálogo com o já existente para o Golfo de Cádiz, com 223 indivíduos (catálogo pertencente à CIRCÉ), não foi registada qualquer coincidência de indivíduos. No entanto este resultado não significa que não possa existir fluxo de individuos entre as regiões. A epóca de amostragem é limitada, bem como o número de fotografias recolhidas e passíveis de usar para fins de foto-identificação. Desta forma é necessário manter ambos os catálogos em constante actualização e comparação. O uso de plataformas de oportunidade, barcos de Whale
watching, para a recolha de fotografias destinadas a foto-identificação deve continuar e
7
Apesar destes resultados apresentarem várias limitações tal como o facto de a amostragem ser referente a uma pequena área geográfica da costa algarvia e à região costeira, bem como a períodos sazonais, neste caso à época de verão, sugerem que esta área pode ser particularmente interessante em termos de abundância e diversidade de cetáceos. De acordo com os mapas de distribuição, existe um enorme potencial de zonas de hotspot principalmente para o golfinho comum, no entanto estes resultados também revelam a presença de espécies ameaçadas tal como o Golfinho Roaz e o Boto. A determinação de hotspots para estas espécies, no presente estudo, é no entanto muito limitada uma vez que apenas se estão a analisar dados referentes a um curto espaço temporal.É necessário continuar o trabalho desenvolvido, e expandi-lo a áreas mais abrangentes, quer ao longo e ao largo da costa algarvia, bem como para zonas fora da plataforma continental. Os cetáceos são animais com enorme mobilidade e grande distribuição. Medidas efectivas de conservação e estudo devem ter em conta a relação entre as populações e o seu habitat. Desta forma é necessário perceber quais são os habitats usados com maior frequência. O uso do habitat por parte destas espécies, está relacionado com factores ambientais (bióticos e abióticos), tais como a disponibilidade de alimento, épocas de reprodução e acasalamento e, por exemplo, a temperatura da água. É necessário recolher mais informação, não só no Sul de Portugal, mas também em todo o restante Golfo de Cádiz, para se conseguir obter informações de uma forma realista, rubusta e global das espécies e populações que ocorrem nesta região.
É ainda necessario ter em conta que as populações de cetáceos são bastante afectadas por acções humanas, que, sobre elas causaram ou podem causar, efeitos negativos, interferindo ou não com seus estatutos de conservação. A falta de estudos e conhecimento sobre o uso de habitat por parte das espécies de cetáceos na costa Algarvia, representa um impedimento para a implementação de medidas efectivas de conservação.
Contudo, os resultados deste trabalho sugerem que costa Sul-Oeste do Algarve é uma importante area para diferentes espécies de cetáceos e apresenta o potencial para o estabelecimento de areas marinhas protegidas.
Palavras chave: Sul de Portugal; Cetáceos; Hotspots; Foto-identificação; Whale
8
ABSTRACT
The South of Portugal is one of the most popular regions in the country to observe cetaceans, although until now no studies have ever been carried out in the area. The present work provides a first approach on the species occurring in the area between Lagos and Cape São Vicente.
Until present, the only existing information was based on technical reports from stranding records, indicating the possible presence of 11 cetacean species.
This study, based on data collected on board a whale watching platform, has the propose to investigate the species present in the area, their occurrence and spatial distribution, and the creation of a photo-id catalogue to Common dolphins.
Between 2005 and 2009, a total of 556 Common dolphin sightings was analysed resulting in an encounter rate (ER) of 2.01 sightings.100 km-1. During 2009, a total of 228 sightings corresponding to 6 different species of cetaceans were made in the area. Among these, the most frequent species sighted were the Short-Beaked Common dolphin (182 sightings; ER = 1.9 sightings.100km-1; the Harbour porpoise (22 sightings; ER = 0.2 sightings.100km-1, and the Atlantic Bottlenose dolphin (20 sightings; ER = 0.2 sightings.100km-1). The rest of the species, only occasionally seen, were the Risso's dolphin (2 sightings), the Minke whale and the Humpback whale (1 sighting both). The Common dolphin photo-id catalogue started in 2009 and allows the identification of 342 individuals.
The results obtained enable the identification of potential cetacean ‘hotspots’ in the study area, particularly concerning the Common dolphin, but also reveal the presence of endangered species, such as the Atlantic Bottlenose dolphin and the Harbour porpoise. Finally, they strongly suggest that the Southwest coast of Algarve is an important area for different species of cetaceans and has the potential for the establishment of marine protected areas.
Keywords: South of Portugal; Cetaceans; Hotspots; Photo-identification; Whale watching;
9
1. INTRODUCTION
The wide diversity of cetaceans that occurres in the South Coast of the Iberia Peninsula has been the target of many studies (Verborgh et al., 2009; Stephanis et al., 2008; Cañadas, 2006). Notwithstanding, the knowledge about the distribution and abundance of cetaceans in the Atlantic coast of the Iberia Peninsula remains very scarce, and often limited to specific areas (Brito et al., 2009; Stephanis et al., 2008; Cañadas, 2006). In Southern Portugal, this type of research, specifically directed, has not been extensively done. In fact, apart from opportunistic platforms, a systematic scientific survey was never been conducted to quantify the occurrence of cetaceans along the coastline of mainland Portugal (Brito et al., 2009,). In last instance, most of the information about cetaceans’ occurrence in Portugal has been collected through strandings’ records (Silva and Sequeira, 2003).
In the Southern region of Portugal, the stranding information indicates the presence of 12 different cetacean species (Sequeira et al., 1992; Sequeira et al., 1996): the Harbour porpoise, Phocoena phocoena (Linnaeus, 1758); the Short-beaked Common Dolphin, Delphinus delphis Linnaeus, 1758; the Atlantic Bottlenose dolphin, Tursiops
truncatus (Montagu,1821); the Striped Dolphin, Stenella coeruleoalba (Meyen, 1833); the
False Killer Whale, Pseudorca crassidens (Owen, 1846); the Risso's dolphin, Grampus
griseus (Cuvier, 1812); the Long-finned Pilot Whale, Globicephala melaena (Traill, 1809);
the Cuvier's Beaked Whale, Ziphius cavirostris Cuvier, 1823; the Gervais' Beaked Whale,
Mesoplodon europaeus (Gervais, 1855); the Fin Whale, Balaenoptera physalus
(Linnaeus, 1758); the Minke Whale, Balaenoptera acutorostrata Lacépède, 1804; and the Sei Whale, Balaenoptera borealis Lesson, 1828. There is also a report on a land sighting of a Northern Right Whale, Eubalaena glacialis (Müller, 1776) with a calf, 400 m from Cape St. Vicent, Portugal (Martin and Walker 1997).
The smallest and the most frequent dolphin along the coast of Portugal is the Short-beaked Common Dolphin (Delphinus delphis), while the most frequent whale is the Fin Whale (Balaenoptera physalus) (Brito et al., 2009).
Another important source of information comes from the whale watching companies. According to the tour operators established in the coast of Algarve the most commonly encountered species are the Short-beaked Common Dolphin (Delphinus
delphis), the Atlantic Bottlenose dolphin (Tursiops truncatus), the Harbour porpoise
(Phocoena phocoena), the Risso's dolphin (Grampus griseus), the Killer Whale, Orcinus
Orca (Linnaeus, 1758), and the Minke Whale (Balaenoptera acutorostrata) (Mar Ilimitado,
Golfinho Mar and Dolphins Driven, personal communication). The different companies consider that the Short-beaked Common Dolphin is the most frequent species in the area,
10
which, although usually found in smaller pods, can form groups that can reach hundreds of animals. The remaining species being only occasionally seen.The South Coast of Portugal is a popular area for ecotourism. In recent years, several companies dedicated to whale watching were created to meet the demand, and the industry keeps expanding every year. Currently 14 companies are licensed to operate whale watching vessels off the South Coast of Portugal (Sequeira, personal
communication) and it is estimated that as many as 10 companies are operating without
licensure. Each company has three boats in operation and averages three trips per boat per day.
The deficient control by the national organs responsible for the control of the activity justifies the high number of companies operating without licensure. Also, the large number of entities that regulate the activity, such as the Instituto de Conservação da Natureza e Biodiversidade, the Turismo de Portugal, the Turismo de Natureza and the Instituto Portuário e dos Transportes, leads to doubts between the operators, due to the differences in information provided by each entity. Apart from that, the poor control may also be due to the fact that, in this area, there is a considerable paucity of data.
Besides that, most of the companies do not have staff with specific formation in order to be able to provide the public with proper information about the species and the operators lack the resources needed to provide the public with current scientific information regarding cetaceans. Ecotourism must include education, environmental awareness, and conservation components to provide a meaningful bridge between the public and the science.
The fact that whale-watching boats are nowadays regularly used as “platforms of opportunity” by scientists for mark-recapture studies has contributed to diminish this problem.
The proposed scheme will utilize the whale-watching boats and crew to collect the data (Photo-ID) combining whale-watch tours with scientific research (Verborgh et al., 2009; Wittich, 2009).
Further, systematically planed studies are critical to better understand the distribution, abundance and occurrence of cetaceans in this area. New guidelines for whale watching in the South of Portugal are also critical for effective long term management. When thinking about conservation measures for cetaceans, it is necessary to identify the species, the various populations and estimate their abundance, habitat use and spatial distribution. It is also important, whenever possible, to have information on their diet and natural history (Cañadas, 2006).
Marine mammals are often referred to as charismatic mega fauna: people care about them more than other species or groups, and that contributes to the conservation of
11
entire ecosystems (Reynolds et al., 2009). In fact, several efforts have been made in order to protect marine mammals and their habitats, as shown by the considerable number of international conventions, laws and organizations devoted to the subject. Portugal, both as an independent country and as member of the European Union, is a party of most of these conventions and agreements, and therefore has the duty to follow the guidelines suggested.
The present study intends to characterize the cetacean’s fauna occurring in the area between Cape São Vicente and Lagos, a region chosen because of the lack of studies on the subject.
The study will attempt to answer the following questions: a) Which species occur in the area?
b) What is the encounter rate and abundance index for each species?
c) What is the spatial distribution of the different species with relation to the bathymetric features of the Cape São Vicente area?
And to create a Photo-Id catalogue for common dolphins.
Despite having obtained data for several species of cetaceans during the time of this study, this work will focus especially, on the common dolphin, the Bottlenose dolphin and the Harbour porpoise, and intends to be an initial step into the cetaceans’ investigation in the area, and serve as a baseline for future works.
2. STUDY AREA
The south coast of Portugal belongs to the Algarve region. It includes approximately 160 km, from Sagres to the Guadiana river mouth (Alveirinho Dias, 1988). The continental platform is very short, varying between 7 km and 28 km wide (Magalhães, 2001 and Marques, 1982), with 17 km as the average value (Lopes & Cunha, 2010). The slope is soft and well defined, located at an average depth of 110 m to 150 m. It has 2500 km2 inside the bathymetric depth of 200 m. The morphology reflects a geological evolution controlled by tectonic and sedimentary dynamics similar to other regions of the Gulf of Cadiz (Lopes & Cunha, 2010).
The currents on the Algarve platform region are generally weak. Drift currents predominate. The drift current adapt to the coastal profile, moving parallel to the coast in both directions, near the 30 m isobathymetric line. Currents reach speeds nearly 50 cm.s
12
The tides have a half-day regime and an average amplitude of 2 m (maximum: 3,5 m: minimum: 0,5 m) (Falcão et al., 2003).The average wave energy is considered low along the coast line, with seasonal variations, rising in winter following to rough weather. The result is an increase in beach erosion (Dolbeth et al., 2006).
The 10 m and the 20 m isobathymetric lines follow the coast line with considerable regularity (Costa and Franca, 1982). The hydrologic characteristics, such has The salinity, the pH and the temperature are considerably uniform. The salinity is nearly constant all year, varying between 36.1 and 36.3 at surface and 36.1 to 36.4 at a depth of 50 m . The temperatures peak between July and August and reach minimum values between January and February (Ricardo, 2009).
Another characteristic of the coast of Algarve is the presence of submarine canyons and trenches, which facilitate the flow of the water masses and sedimentary load (Lopes & Cunha, 2010). The most important canyons are the Lagos canyon, the Portimão canyon, the Albufeira canyon, the Faro canyon and the São Vicente canyon. Regarding the trenches it is relevant to refer the Diogo Cão trench and the Álvares Cabral trench. This study focuses on the area between Lagos and Cabo São Vicente (Fig 1) which has the western conditions and characteristics, also part of this area is inserted in the Natural Park, Parque Natural do Sudoeste Alentejano e Costa Vicentina.
13
The São Vicente canyon has substantial influence in this area. It is located in the Gulf of Cadiz (GoC), in the Northwest Atlantic Ocean, off SW Iberia. The GoC is located between the Straits of Gibraltar (5ºW) and the Gorringe Bank (12ºW) between 34ºN and 38ºN (Valadares et al., 2009). The canyon has a general staircase-like shape with the upper and lower parts trending NE-SW and the middle sector with an NNE-SSW direction (Valadares et al., 2009). The São Vicente canyon head lies very close to the shore, at depths shallower than 70 m and runs towards the Horseshoe Abyssal Plain at an approximate depth of 4900 m. It extends for more than 120 km, being the larger submarine canyon on the GoC, reaching up to 20 km in width (Valadares et al., 2009). Tide-topography interaction along a submarine canyon is able to enhance mixing, providing a cross shelf eddy flux of salt. Vertically forced tidal currents advect salty waters from the bottom of the canyon to its head, where mixing takes place. Differences in salinity between up and down canyon tidal currents produce an eddy flux of salt (Vargas-Yáñez et al., 2002)."Meddies" (Mediterranean eddies) are warm, salty eddies of Mediterranean water generated by instabilities in the water flowing from Gibraltar. The Cape São Vicente is a generation site for meddies by a mechanism of separation of the frictional boundary layer at these sharp corners (Serra & Ambar, 2000). Eddies are responsible for upwelling phenomenon, generating richer waters at the surface (Alan E. Burger, 2003; Lee et al., 1999). Eddies also contribute to the upwelling with warmer waters generated by spring-summer winds (Baringer & Price, 1997). Because of these characteristics, the São Vicente canyon has great influence on marine life around Sagres, helping to increase the productivity of these waters and supporting a considerable biodiversity.
14
3. STUDIED SPECIES
The basic knowledge about the species that are the object of the present study will help to better understand their distribution, habitat use and dynamics.
The Short-beaked Common dolphin, Delphinus delphis Linnaeus, 1758:
Figure 2. Short-beaked Common dolphin in the South of Portugal (photo by Joana Castro).
Until today, two species of Common dolphin are recognised worldwide: the short-beaked (Delphinus delphis) and the beaked (D. capensis), with a subspecies of the long-beaked (D. capensis tropicalis) also acknowledged. This consideration of two species is based on the morphological difference which has been supported by genetic analysis, that shows considerable differences in the mitochondrial DNA between both forms (Rosel et
al., 1994), which suggests that they have been separated for a long time and probably do
not interbreed, despite living in sympatry. On the other hand, some authors consider that only one species exists, Delphinus delphis, and that the others are geographic forms or subspecies (Cañadas, 2006).
Even though this species is very widespread in most of the European waters, there are many aspects of common dolphin biology and ecology, including abundance, distribution and taxonomy that remain unclear (ECS 2004).
The Short-beaked Common dolphin is a small cetacean with a very wide distribution (Bearzi et al., 2003). This distribution it is not panmictic and can be found in series of geographically separated populations (Heyning & Perrin, 1994; Perrin & Brownell, 1994; Jefferson & Van Waerebeek, 2002). Studies on the abundance and distribution of cetaceans are not easy, particularly concerning species like common dolphins, with a world hide range, different habitat types (Hammond et al. 2002, Lopez
15
2003, Silva and Sequeira 2003) and both long term and short term movements (Northridge et al., 2004; Brereton et al., 2005).The average size of an adult Common dolphin is approximately 2 m in length, with males slightly larger than females (Evans 1987). Adults’ weight varies between 75 - 85 kg, with a maximum 136 kg (Evans 1987; Evans 1994). Pregnancy is estimated to be 10-11.5 months (Evans 1987; Perrin and Reilly 1984; Murphy 2004) and the calves are born with 80 cm to 90 cm in length (Evans 1987; Evans 1994).
In relation to predators, it is known that cetaceans have very few of them, although the main predators are sharks, Killer whales, False Killer whales and Man (Perrin et al., 2002). In the South of Portugal, there is a anecdotical evidence showing that the presence of Killer Whales (Orcinus orca) and False Killer (Pseudorca crassidens) is very rare, which is why the predators of dolphins here can be reduced to sharks and the Man (direct or accidental death).
Harbour porpoise, Phocoena phocoena (Linnaeus, 1758)
Figure 3. Harbour porpoise in the South of Portugal (photo by Joana Castro).
The Harbour or Common porpoise, Phocoena phocoena (Linnaeus 1758), is one of six species recognised in the family Phocoenidae (Read 1999). It is the smallest cetacean that occurs in the Atlantic Ocean (Sequeira, 1988) and in European waters (Watson, 1985). On average, the size of an adult is around 150 cm to 160 cm and the weight 45 kg to 60 kg (Gaskin et al., 1974). In the North Sea the maximum size for males and females was 170 cm (55 kg) and 171 cm (55.5 kg), respectively (Lockyer 1995; Santos et al., 2001a; Santos and Pierce, 2003). Nevertheless, the information from strandings in the northwest Spain and Portugal shows that Harbour porpoises in these areas seem to be larger, around 200 cm (Donovan & Bjørge 1995; Sequeira 1996).
16
Harbour porpoises are widespread in coastal waters of the Northern Hemisphere and in temperate and subarctic waters in the North Atlantic and North Pacific (Santos and Pierce, 2003). Although this was once the most common of the cetaceans in European waters, it has suffered a serious decline, between 53,000 and 89,000 animals, in the last century (Reijinders, 1992). The species is listed in the Appendix II of CITES and The Red List Category and Criteria for Harbour porpoise is “Least Concern” (www.iucnredlist.org).In continental Portugal, the first records of Harbour porpoises were made in the 19th century, and indicate that this species was very abundant (Bocage in Sequeira 1988; Nobre in Sequeira 1988). In late 1970s the records indicate a decrease in the amount of animals, only seen occasionally and moving alone or in small groups (Teixeira in Sequeira 1988). Nowadays most of the information about this species in mainland Portugal comes from stranding records along the coastline, and that is how the abundance and occurrence have been estimated.
Atlantic Bottlenose dolphin, Tursiops truncatus (Montagu, 1821)
Figure 4. Atlantic Bottlenose dolphin in the South of Portugal (photo by Joana Castro).
The Bottlenose dolphin is distributed worldwide, showing such an extraordinary adaptation to the diverse conditions in different regions that it is difficult to define fixed characteristics for the species’ feeding habits, behaviour or social structure (Cañadas 2004).
Tursiops is a polytypic genus (Hershkovitz 1966). There are a lot of different
morphotypes that differ in coloration pattern, body measures and cranial structure (Walter 1981; Ross and Cockcroft 1990). These differences arise controversy among scientists, and some consider there are more than 20 different species belonging to the genus
17
of the distribution of these characters generally overlaps (Walter 1981; Ross and Cockcroft 1990), Tursiops truncatus was considered as a single species by many experts (Ross and Cockcroft 1990; Wilson and Reeder 1993) until molecular data supported the separation of Tursiops aduncus as a different species (LeDuc et al., 1999; Wang et al., 1999).Studies done in different areas of distribution revealed two distinct morphotypes: the coastal morphotype and the offshore morphotype (Ross 1977, 1984; Walter 1981; Perrin, 1982; Leatherwood and Reeves, 1983; Duffield et al., 1983; Ross and Cockroft 1990; Van Waerebeek et al., 1990; Mead and Potter 1995; Torres et al., 2003). According to Perrin (1982) this distinction is related to and based on morphologic aspects, such as number of teeth and the robustness of the jaw, which might be connected with the type of diet and habitat. Mean adult length ranges between 2.5 m and 3.8 m (Mead and Potter, 1990; Read et al., 1993). These sizes have great variability, especially when both morphotypes described are compared, the coastal being rather smaller than the offshore one (Perrin et al., 2002). Coloration is a more or less uniform dark grey body with white belly. In general Tursiops truncatus is more robust than the other small delphinids, the common dolphin or the striped dolphin for example (Cañadas 2004). Bottlenose dolphins reach sexual maturity at the age of 8-12 years in males and 5-10 years in females (Reynolds et al., 2000). The gestation period is about 12 months and the lactation period goes from 12 to 20 months (Perrin et al., 2002; Reynolds et al., 2000).
Tursiops truncatus is an opportunistic species, feeding on the most abundant prey
(Sequeira, 1988), and feeds mainly on demersal species (Gunter 1942; Tomilin 1957; Evans 1987; Barros and Odell 1990; Gannier 1995). In the Atlantic waters of Portugal and Galicia, the analysis of stomach contents indicates that 99% of the diet is composed by fish, with the Gadidae, and especiallythe blue whiting, as main prey items, (Santos et al., 1996; Silva and Sequeira 1997).
Bottlenose dolphins have a very cosmopolitan distribution. The species is widespread in the world’s temperate and tropical oceans, occupying most marine habitats except the polar zones (Leatherwood and Reeves, 1983; Klinowska, 1991; Wilson et al., 1999). In continental Portugal, several studies were made on a resident population at the Sado Estuary (dos Santos, M. E. and Lacerda, 1987; Gaspar, R. 1994; Freitas, A. 1995; Brito, C. 2001), but there is a lack of knowledge about this species in relation to the distribution, population, and habitat use in other areas of continental Portugal. The only information found related to the south of Portugal belongs to SEC (Sociedad Espanola de Cetáceos), which conducted an expedition in the Gulf of Cadiz and Portuguese waters in 2004, and only sighted one Bottlenose dolphin in Portuguese waters.
18
Other Species
Minke whales, Balaenoptera acutorostrata Lacépède, 1804, are the smallest and most abundant of the roquals. The species can be found in all the world’s oceans, having a large and cosmopolitan distribution (Perrin et al., 2002). Minke whales are considered more frequently distributed near shore than in open ocean (Tetley 2004), often associated with coastal habitats or ice edge areas (Kasamatsu et al., 2002). Most of the information about the occurrence of this species in Portugal comes from strandings (Sequeira et al., 1992; Sequeira et al., 1996).
Humpback whales, Megaptera novaeangliae
(
Borowski, 1781) are known for their wide distribution and long migrations, with several instances of 8000 km migration reported (e.g. Stone et al., 1990; Darling et al., 1996; Stevick et al., 1999), though details of these migrations are poorly known. (Stevick et al., 2003). In the Mediterranean Sea this species has always been considered extremely rare (Aguilar, 1989; Notarbartolo di Sciara and Demma, 1997), but since 1990 the number of sightings has increased (Frantzis et al., 2004). In mainland Portugal, most information on the occurrence of humpback whales comes from the strandings (Sequeira et al., 1992; Sequeira et al., 1996).Risso’s dolphin, Grampus griseus (Cuvier, 1812), is a species with a large distribution. It can be found in all the oceans: in the Pacific, from the Kuril Islands and the Southeast of Alaska, to New Zealand and Chile; in the Atlantic, from the Newfoundland and the Scottish Shetland Islands to Argentina and South Africa; in the Indian, from the south of South Africa to the South of Australia, Tasmania and New Zealand. It is also found in the Red Sea (Evans, 1987). Usually individuals of this species occur in offshore areas, although in the Atlantic it is frequent to observe small groups close to shore on the West coast of Africa, Atlantic islands (Cape Verde, Canarias and Azores) and on the European coast (Mainland Portugal, Golf of Biscay, West coast of Ireland and Scotland) (Evans, 1987).
There are records of the occurrence of this species near mainland Portugal since 1924 (Chaves, 1924). Nowadays, in the Azores it is considered a very common species (Silva et al., 2003), though in mainland Portugal there are few records.
19
4. METHODOLOGY
4.1. Data Collection – Survey and Sightings
4.1.1. Field data collection
A whale watching boat from the company, Mar Ilimitado, operating in Sagres was used as an opportunistic platform in this study. This company conducts three trips a day, with a single vessel boat. Carrying capacity includes 12 passengers, one skipper and one guide. The average duration of each trip is 90 minutes.
Data from sightings of common dolphins (between 2005 and 2009) and Bottlenose dolphins and Harbour porpoises (during 2009), were analysed.
The transepts made by the company were random tracks, with any pre-defined path.
Since a platform of opportunity was used in this work, several limitations are to be considered with this kind of survey: time spent with the animals, the approach of the boat, the velocity during effort, and the duration of each trip.
All trips used in this study were approximately 1h 30 min, but the number of trips per day was variable according to the availability of tourists and meteorological conditions. During the surveys a continuous effort was made at all times, only stopping when a group of cetaceans were approached. In most of the trips two observers searched for the animals covering an 180º angle ahead of the vessel.
The sighting effort was measured as the number of kilometres travelled searching for cetaceans. The position of the boat was recorded during all trips by a GPS (Global Position System), creating the track for each trip.
Data between 2005 and 2009 were collected by the employees of the whale-watching company and, although the company’s database included different data parameters, depending on the observer responsible for collecting the data, several of them, such as the GPS track, the GPS position of the animals, date, species sighted, number of individuals, presence or absence of calves, group cohesion and environmental data (sea state, wind speed, visibility) were consistent across all years. From 15th of June to 30th of September 2009 the following data were systematically collected: GPS track, date, species, GPS position, distance from the boat, angle, the initial cue, initial behaviour, contact behaviour, final behaviour, response of the animal to the boat, cohesion of the group, number of individuals, number of adults, juveniles, calves and newborns, direction of travel of the animal, and information on the number of boats present in a circle of 300m. Environmental data, such as depth, water temperature, visibility, wind direction, Beaufort, sea state and swell were also collected. Although all these information were collected,
20
only the GPS track, the GPS position, date, species, number of individuals, presence or absence of calves, and group cohesion will be analysed in the present work.For purposes of data analysis, the study area was divided into quadrats using a grid with a cell resolution of 2 min latitude (3704 m) by 2 min longitude (3006 m), using ArcGIS 9.3. This scale was used in order make the results comparable to those of previous studies and with future research programs carried out by CIRCÉ (Conservation, Information & Research on Cetaceans). Following de Stephanis et al., (2008), only the cells with a sighting effort of at least 3 km were used in the analyses.
For each cell the total of km (effort for each cell), the total number of sightings, and the total number of animals sighted was calculated.
4.1.2. Presence and relative abundance of cetaceans
To quantify the cetaceans’ relative abundance three parameters were used:
1 – The Encounter Rate (ER) (sightings km-1), the number of sightings of a given species per 100 km of effort: ER = (Sightings/Effort) x 100.
2 – The abundance rate (AR) (ind. km-1) defined as the number of individuals of a given species over the effort in the research area in km: AI = (Individuals/Effort) x 100.
3 - Density Estimation (using “Kernel Density Estimation”, a statistical tool from ArcGIS (Hawth’s Tools)) (Beyer, H. L. 2004), a non-parametric way of estimating the probability density function of a random variable. For example, given some data about a sample of a population, this analysis extrapolates the data to the entire population. Kernel Density Estimation was calculated for Delphinus delphis between the years of 2005 - 2009. For
Tursiops truncatus and Phocoena phocoena only the year of 2009 was used.
The Kernel tool was run using both ER and AI per cell as a weighting factor. If a sighting fell inside a cell with less than 3 km effort, a weight of 1 was attributed, making the point neutral to the analysis (Beyer, H. L. 2004).
21
4.1.3. Spatial distribution and bathymetry
Two bathymetric features were used, the depth and slope. The mean depth and slope were calculated for each quadrat. Depth data were obtained from the Portuguese hydrographic institute (Instituto Hidrográfico - http://www.hidrografico.pt/dowload-gratuito.php). From this data we created a TIN (Triangulated irregular network) in order to get the slope (a raster with a resolution of 100x100 m) and then, each cell assumed as bathymetric gradient the maximum slope and the mean depth.
The distribution of cetaceans according to depth and slope was made based on a continuous depth and slope data set, the mean values of quadrats. Depth and slope were ranked into subjective categories to provide a pertinent ecological context for the interpretation of the results (Figs. 19, 20 and 21; Table V).
Depth was categorised according to the diving capabilities of the observed cetaceans and the minimum and maximum depths in the study area: 50–100 m, 100–150 m, 150–200 m and ≥ 200 m.
The slope was categorised as follows: 0 –80 m.km-1, 80–160 m.km-1, 160–240 m.km-1 and ≥ 240 m.km-1.
4.1.4. Social organization: group size, group cohesion and presence or
absence of calves
The group size was obtained by the minimum and maximum values of the encountered groups per species. In 2009 the group cohesion was calculated to all species (Table I).
Table I - Classifications of group cohesion
D = dispersed (> 5 bodies)
C = compact (1-5 bodies)
VC = very compact (< 1 body)
L = lone individual
NI = not identifiable
Group Cohesion
The presence or absence of calves was analysed based on the data for two species: Delphinus delphis and Tursiops truncatus.
22
For Tursiops truncatus, the total number of sightings was considered, and the presence (Pr), absence (Ab) or the incapacity to identify the presence or absence of calves (not identifiable - NI) in each sighting, during 2009, were analysed.Concerning Delphinus delphis, the data was tested for normality and homoscedasticity and, given the results, the non parametric Kruskal-Wallis test, with a 95% confidence interval, was used to compare the differences in the presence of calves among different years (2005-2009) using the groups in which it was possible to determine this variable. The Dunn test was used for pairwise testing.
4.2. Data Collection - Photo-ID
Photo-identification (Photo-ID) is a methodology that uses photographs of long-term natural marks, such as nicks and notches on the dolphins’ dorsal fins (Würsig and Jefferson 1990; Bearzi et al., 2005) as well as scars and pigmentation patterns (Hammond et al., 1990; Auger-Méthé and Whitehead 2007) to identify individuals. Photo-ID methodology has several advantages, such as the fact that it is a non-invasive and inexpensive technique, allowing extensive use in cetacean studies (Hammond et al., 1990; Auger-Méthé and Whitehead 2007).
During the present study photos were taken with a Nikon D200 camera using 18-200mm and 70-300mm lenses, between 15th June and 30th September 2009, on board a whale watching boat belonging to the company Mar Ilimitado.
All species encountered were photographed, but Common dolphins (Delphinus
delphis) were the only ones included in the catalogue, which is the first catalogue
developed for common dolphins in the south coast of continental Portugal.
All pictures were catalogued and each individual was attributed a code of the form DD_ALG_XXXX, where DD stands for Delphinus delphis, ALG for Algarve (the region of the study) and XXXX the number assigned to the particular individual in the catalogue (ex: DD_ALG_0001). The catalogue was handmade, with no Photo-ID program used. In the identification nicks and notches in the dorsal fin were used (Würsig and Jefferson 1990), as well as body scars and pigmentation patterns (Lockyer and Morris 1990).
Each picture was analyzed and the data information was organized in a Microsoft EXCEL datasheet. The data consisted of basic information such as: sighting number, picture number, number of individuals in the picture, number of the individual analysed in the picture (starting from the closest individual to the furthest and from left to right when two animals were at the same distance), date of the picture, angle, individual quality, and code name of the individual.
23
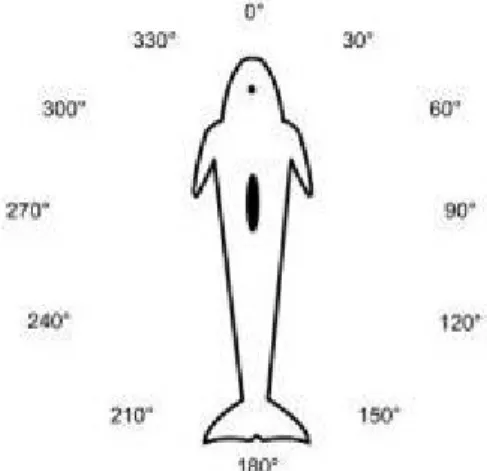
The angle of the picture starts in 0° when the animal is photographed directly from the front and goes around the animal clockwise every 30° (Fig. 5).Figure 5. Photo-id angles.
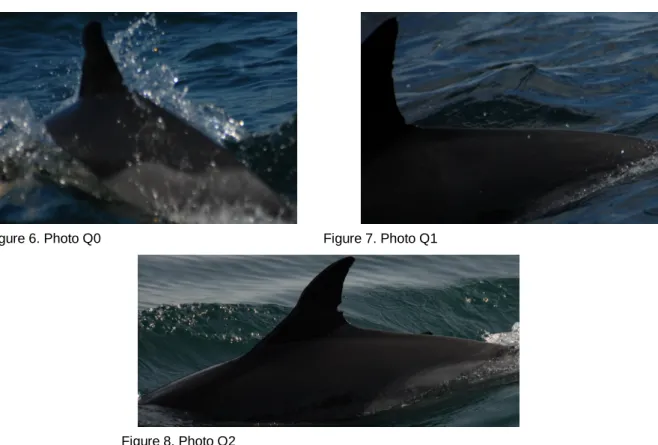
In each picture, each individual was attributed a quality rating (Q) on a scale from 0 to 2 (poor to excellent) based on five characteristics: focus, size, orientation, exposure, and the percentage of the fin visible in the frame (Table II).
For the purpose of the catalogue only the best quality pictures (Q1 and Q2) (Table II) were used.
Table II - Quality rating for photos used in photo-id process
Quality rating (Q) Description
Q0
Unusable individual dorsal fin: blurred, too far away or if the angle is between 330º and 30º or 150º and 210º (Fig. 6)
Q1
Medium quality representation of part of the fin orthe entire dorsal fin (Fig.7)
Q2
High quality representation of the entire dorsal fin24
Following the conditions stated above, a catalogue of the dorsal fins from both the left and the right side was created.This catalogue was compared with that of the Gulf of Cadiz (belonging to CIRCÉ), the closest population to the study area, to see if there were any matches. Only the left side catalogue was considered in this process because there is only a left side catalogue for the Gulf of Cadiz.
Photo 4 - Photo Q0 Photo 1 - Photo Q1
Photo 6 - Photo Q2
Figure 6. Photo Q0 Figure 7. Photo Q1
25
5.
RESULTS
5.1. Surveys and Sightings
5.1.1. Presence of cetaceans and relative abundance
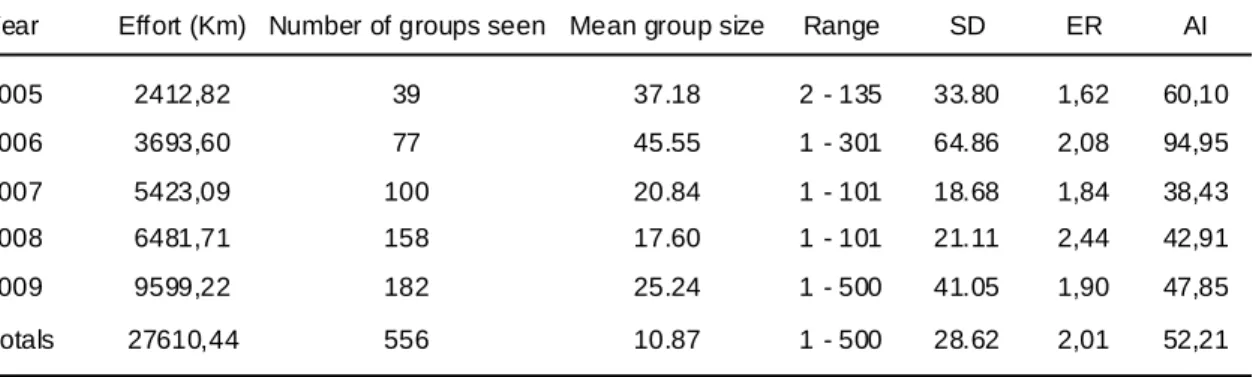
From 2005 to 2009 a total of 27610.44 km of transepts were covered in the study area, with a total of 556 sightings of Common dolphins (Delphinus delphis). The year with higher ER was 2008 and the one with the lowest was 2006. On the other hand, 2006 was the year with higher AI and 2007 the one with the lowest (Table III).
Table III - Number of sightings of Common dolphins (Delphinus delphis), mean group size, standard deviation (SD), encounter rate (ER) and abundance index (AI) calculated in relation to the observation effort in 2005-2009
Year Effort (Km) Number of groups seen Mean group size Range SD ER AI
2005 2412,82 39 37.18 2 - 135 33.80 1,62 60,10 2006 3693,60 77 45.55 1 - 301 64.86 2,08 94,95 2007 5423,09 100 20.84 1 - 101 18.68 1,84 38,43 2008 6481,71 158 17.60 1 - 101 21.11 2,44 42,91 2009 9599,22 182 25.24 1 - 500 41.05 1,90 47,85 Totals 27610,44 556 10.87 1 - 500 28.62 2,01 52,21
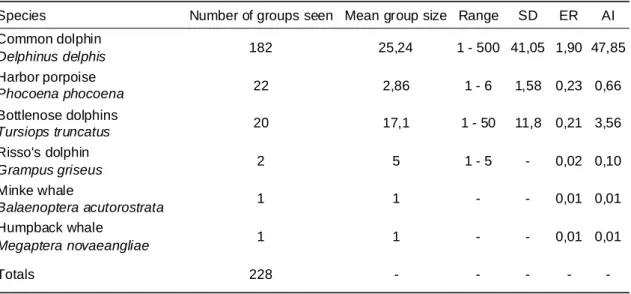
Between February 14th and October 26th 2009, the effort was 9599,22 km in 233 different trips, corresponding to approximately 412 hours, carried out from one vessel. A total of 228 cetacean sightings comprising 6 different species were made (Table IV). Effort and spatial distribution for each species is shown in Figs. 9, 12, 15 and 18.
26
Table IV - Number of sightings per species, mean group size, standard deviation (SD), encounter rate (ER) and abundance index (AI) for 2009
Species Number of groups seen Mean group size Range SD ER AI
Common dolphin Delphinus delphis 182 25,24 1 - 500 41,05 1,90 47,85 Harbor porpoise Phocoena phocoena 22 2,86 1 - 6 1,58 0,23 0,66 Bottlenose dolphins Tursiops truncatus 20 17,1 1 - 50 11,8 0,21 3,56 Risso's dolphin Grampus griseus 2 5 1 - 5 - 0,02 0,10 Minke whale Balaenoptera acutorostrata 1 1 - - 0,01 0,01 Humpback whale Megaptera novaeangliae 1 1 - - 0,01 0,01 Totals 228 - - - -
5.1.2. Spatial distribution of the different species of cetaceans
Common Dolphins (Delphinus delphis)
Spatial distribution - Results for 2005-2009
The results of the analysis of the spatial distribution of Common dolphins are based in all the data pooled among the years 2005 to 2009.
The area covered and the respective trackings and sightings of Common dolphins during the study period are represented in Fig.9.
27
Figure 9. Observation effort (km) during 2005-2009 (grey lines) and the sightings of Common dolphins (red dots).The range in distance from the coast line varies between 313,98 m and 23919,62 m. In Average common dolphins were found 7438,01 m away from shore.
Figs. 10 and 11, show the areas of higher probability density distribution of Common dolphins, according to the Kernel analyses and using the ER and AI as weight factor.
28
Figure 10. Kernel density spatial distribution of Common dolphins weighted by the encounter rate (ER) during 2005-2009, representing areas of higher probability of hotspots.Figure 11. Kernel density spatial distribution of Common dolphins weighted by the abundance index (AI) during 2005-2009, representing areas of higher probability of hotspots.
29
Harbour porpoise (Phocoena phocoena)
Spatial distribution - Results for 2009
The area covered and the respective tracks and sightings of Harbour porpoises during 2009 are represented in Fig.12
Figure 12. Observation effort (km) during 2009 (grey lines) and the sightings of Harbour porpoises (blue dots).
The range in distance from the coast line varied between 738.92 m and 15768.48 m. Harbour porpoises were found at a mean distance of 5873.91 m from shore.
Figures 13 and 14, show the areas of higher probability density distribution of Harbour porpoises in 2009 according to the Kernel analysis using the ER and AI as weight factors.
30
Figure 13. Kernel density spatial distribution of Harbour porpoise weighted by the encounter rate (ER) during 2009, representing areas of higher probability of hotspots.Figure 14. Kernel density spatial distribution of Harbour porpoises weighted by the abundance index (AI) during 2009, representing areas of higher probability of hotspots.
31
Bottlenose dolphin (Tursiops truncatus)
Spatial distribution - Results for 2009
The area covered and the respective tracks and sightings of Bottlenose dolphins during 2009 are represented in Fig. 15.
The range in distance from the coast line varied between 419,74 m and 18650,40 m. In average Bottlenose dolphins were found 5519,34 m away from shore.
Figures 16 and 17 show the areas of higher probability density distribution of Bottlenose dolphins in 2009 according to the Kernel analysis using the ER and AI as weight factors.
32
Figure 16. Kernel density spatial distribution of Bottlenose dolphins weighted by the encounter rate (ER) during 2009, representing areas of higher probability of hotspots.Figure 17. Kernel density spatial distribution of Bottlenose dolphins weighted by the abundance index (AI) during 2009, representing areas of higher probability of hotspots.
33
Other Species
Spatial distribution - Results for 2009
The area covered and the respective tracks and sightings of Minke whales, Risso’s dolphins and Humpback whales, during 2009 are represented in Fig. 18.
Figure 18. Observation effort (Km) during 2009 (grey lines); sightings of Minke whale (pink dots); sightings of Risso’s dolphin (yellow dots); sightings of Humpback whale (black dots).
The Minke whale sighting was made approximately 15469,5 m from shore and in a region 1000 m deep. Risso’s dolphins were found at 18062,6 m and 8652,9 m from shore, at a region 179,23 m and 100 m deep respectively, The Humpback whale was found very close to shore, 1774,39 m away in a region 50 m deep.
34
5.1.3.
Bathymetry and Slope
The number of sightings per 100 km of effort was considered relative to depth and slope.
Concerning depth, and since there are no sightings in zones shallower than 50 m deep, the class between 50 m and 100 m was considered as the first class. It was in this class that most of sightings were made for all species found. In the last class, ≥ 200 m, the number of sightings was very small.
The slope was characterised adopting the categories of Piatt et al., (2006) from 0 to 80 m.km-1, 80 to 160 m.km-1, 160 to 240 m.km-1and ≥ 240 m.km-1. The slope in the study area is not very marked and most of the sightings were made between 0 m.km-1 and 80 m.km-1.
For Common dolphins, data from 2005 – 2009 was considered. Analysing the data from depth, it was in the first class that most of sightings were made but it was in the last one that a higher ER was found (Fig.19). Considering the slope, most of the sightings were made between 0 to 80 m.km-1 (Table V).
Common Dolphin 2005 - 2009
0 50 100 150 200 250 300 350 400 450 500 [50 - 100[ [100 - 150[ [150 - 200[ ≥200 Depth (m) N o . Si gh tin gs 0,00 1,00 2,00 3,00 4,00 5,00 6,00 7,00 8,00 9,00 10,00 11,00 12,00 13,00 ERFigure 19. Distribution of number of sightings of Common dolphins (bars) and encounter rate in sightings/kilometers (♦) in relation to depth from 2005-2009.
35
Table V - Distribution of number of sightings of Common dolphin and encounter rate in relation to slope during 2005-2009
Slope (m.km-1) No. Sightings ER
[0 - 80[ 548 3,49
[80 - 160[ 2 4,7
[160 - 240[
≥ 240 6 6,9
Sightings of Harbour porpoises per 100 km of effort in 2009 are shown in Figure 12. The results of the data from depth (Fig.20) show that most of the sightings were made in the class [50 – 100[, although higher encounter rates were found in the class [150 – 200[.
Harbour Porpoise 2009
0 2 4 6 8 10 12 14 16 18 20 [50 - 100[ [100 - 150[ [150 - 200[ ≥200 Depth (m) N o . Si gh tin gs 0,00 1,00 2,00 3,00 4,00 5,00 6,00 7,00 ERFigure 20. Distribution of number of sightings of Harbour porpoise (bars) and encounter rate in sightings/kilometers (♦) in relation to depth in 2009.
In relation to slope, all the sightings of Harbour porpoises were made between 0 to 80 m.km-1.
36
Sightings of Bottlenose dolphins per 100 km of effort in 2009 are shown in Figure 15. Most of the sightings were made in the class [50 – 100[, although the higher ER is found in the class [150 – 200[ (Fig.21).Bottlenose Dolphin 2009
0 5 10 15 20 [50 - 100[ [100 - 150[ [150 - 200[ ≥200 Depth (m) N o . Si gh tin gs 0,00 1,00 2,00 3,00 4,00 5,00 6,00 7,00 ERFigure 21. Distribution of number of sightings of Bottlenose dolphins (bars) and encounter rate in sightings/kilometers (♦) in relation to depth in 2009.
In relation to slope, all the sightings of Bottlenose dolphins were made between 0 to 80 m.km-1.
37
5.1.4.
Social organization
Common dolphin
From 2005 until 2009, there were 556 sightings of Common dolphins, ranging from 1 to 500 individuals (Table III). It is consistent, in 4 years study that most of the groups found were between 1-25 individuals (Fig 22).
0 20 40 60 80 100 120 140 [1-25[ [25-50[ [50-75[ [75-100[ >100
Group Size (no. of individuals)
N o . o f si gh ti n gs 2005 2006 2007 2008 2009
Figure 22. Number of sightings of Common dolphins in relation to group size in 2005-2009.
The group cohesion data was analysed only for 2009. In 82 sightings the groups were disperse (D), in 8 sightings the groups were compact (C), in 81 sightings they were very compact (VC). Only in one sighting was observed one lone individual (L). and in 10 sightings there is no information in relation to group cohesion (NI) (Fig.23).
38
0 20 40 60 80 100 D C VC L NI Group Cohesion N o . Si gh ti n gsFigure 23. Number of sightings of Common dolphins in relation to group cohesion in 2009.
In this study, calves were observed in 53,53% of the groups in which the presence or absence of calves was possible to determine. A Box & Whiskers plot (Fig. 24) among the years suggested that there were considerable differences between the years. This impression was confirmed by the statistical analysis results that showed significant differences in the effort to encounter at least one group with calves (H=91,59606; p << 0,05).
39
Figure 24. Box & Whiskers plot: Effort rate to sight at least a group with calves per year (presence or absence of calves/distance navigated in each track (Kilometers)).According to post-hoc tests all the pairs are significantly different except for 2005 vs 2006, 2006 vs 2007 and 2008 vs 2009 (Table VI).
Table VI - Results from the Dunn test, showing the significance between the years (significant p values in bold) 2005 2006 2007 2008 2009 Z p Z p Z p Z p Z p 2005 1,527498 1,000000 3,403234 0,006659 6,369619 0,000000 6,927374 0,000000 2006 1,527498 1,000000 2,031051 0,422498 5,382421 0,000001 6,028495 0,000000 2007 3,403234 0,006659 2,031051 0,422498 3,501554 0,004626 4,174652 0,000298 2008 6,369619 0,000000 5,382421 0,000001 3,501554 0,004626 0,643932 1,000000 2009 6,927374 0,000000 6,028495 0,000000 4,174652 0,000298 0,643932 1,000000
40
Harbour porpoise
In 2009, there were 22 sightings of Harbour porpoise (Table IV), in which the largest group found comprised 6 animals (4 sightings). The most common group size was 2 individuals (7 sightings) followed by lone individuals with 5 sightings (Fig 25).
0 2 4 6 8 10 1 2 3 4 5 6
Group size (no. of individuals)
N o . Si gh ti n gs
Figure 25. Number of sightings of Harbour porpoise in relation to group size in 2009.
In relation to the cohesion of the group, in 17 sightings the groups were very compact (VC) although in the rest of the sightings it was not possible to identify the level of cohesion (NI) (Fig.26).
0 5 10 15 20 D C VC L NI Group cohesion N o . Si gh ti n gs
41
Bottlenose dolphin
In 2009, there were 20 sightings of Bottlenose dolphins (Table IV). In 15 sightings the group size ranged between the 1 and 20 individuals, while in 5 sightings groups larger than 20 individuals were observed (Fig 27).
0 2 4 6 8 10 [1-10] ]10-20] ]20-30] ]30-40] >40 Group Size N o . Si gh ti n gs
Figure 27. Number of sightings of Bottlenose dolphins in relation to group size in 2009.
In relation to group cohesion, Bottlenose dolphins were very compact (VC) in 15 sightings, corresponding to 75% of all groups. In 3 sightings the group was considered dispersed (D) and in 2 sightings it was not possible to determine the cohesion of the group (NI) (Fig.28).
42
0 5 10 15 20 D C VC L NI Group cohesion N o . Si gh ti n gsFigure 28. Number of sightings of Bottlenose dolphins in relation to group cohesion in 2009.
The presence or absence of calves in Bottlenose dolphins can be seen in Fig 29. In 11 sightings out of 20, calves were present (Pr). In 2 sightings they were absent (Ab) and in 7 sightings there was no information (NI).
0 5 10 15 20 Pr Ab NI Calves N o . Si gh ti n gs
Figure 29. Number of sightings of Bottlenose dolphins in relation to present (Pr) or absence (Ab) of calves during 2009. NI stands for no information.
43
5.2. Photo identification
Photographs of common dolphins, taken between 15th June and 30th September 2009, were used for identification purposes. There were a total of 140 sightings of Common dolphins during this period.
A total of 1353 photos were analysed (Table VII), based on which 342 individuals were identified. 149 individuals were indentified only on the right side of the fin, 148 only in the left side, and 45 on both sides. The left side catalogue of 193 individuals from the South of Portugal was compared with the 223 individuals in the catalogue from the Gulf of Cadiz. No match was found between the two catalogues.
Table VII - Number of pictures analyzed according to quality rating
Quality No. of pictures
Q0 318
Q1 584
Q2 451