!""!# $ %
%
& ' ( ) *
+ #
,,"-# $.# $ %
$/$ # 0 * 1 *
,,-2# $ %
!
"
#
$
#
Coolants are widely used in industries for metal cutting operations. Though there are varieties of coolants available, the most widely used are water-soluble coolants because of their low cost and better heat dissipation compared to straight cutting oils. In the present investigation, amongst the various causes, which deteriorate the coolant, the role of hardness of water is primarily studied. Accordingly, water from different sources with varying hardness is considered and coolants are prepared from the same. The extent to which hardness can affect the performance of coolants is studied as a function of coolant lubricity in a reciprocating tribometer. Further, the effect of entry of coolants into lubricated machine tool slideways is also assessed by evaluating the mixture of coolant and lubricating oil for its frictional behavior. This is important from assessing the impact of the mixing of coolant and lubricating oil on machine tool slideways with regard to positioning exactness and stick slip behavior of slideways in terms of coolant-lube compatibility.
Keywords: coolants, lubricating oil, tribometer, lubricity, demulsification
Introduction
1
Cutting fluids also known as coolants generally perform three major functions: cooling, lubrication, cleaning and are usually oil or water based. Oil based coolants are often said to offer superior lubricity, longer fluid life, improved surface finish, higher stock removal rate and extended tool life. These advantages are generally offset by the prospects of high cost of set up considering the danger of employing flammable oil added with the ineffectiveness of oil in convective cooling. Water based coolants on the other hand offer improved convective cooling properties coupled with reduction in costs, better cleanliness and the added versatility of being able to be added with various synthetic additives to enhance properties, be it anti rust, anti foaming, improved lubricity or otherwise.
The assessment of the term lubricity with regard to coolants or cutting fluids though being extensively used in literature has been minimal. Liang et.al. (1999) have proposed an experimental methodology that attempts to quantify the tribological effectiveness of the cutting fluid based on the cutting force values obtained through a dynamometer as a function of the variation in the friction coefficient, whereas Sales et.al. (2001) have employed scratch test techniques based on the scratch specific energy to determine the lubricity. Though the two methods proposed do provide a means to assess the lubricity of a cutting fluid, they are less sensitive to reflect changes in additive chemistry or concentration which in turn affects lubricity and also for evaluating cutting fluids for low speed applications. Also compounding the problem in some machinery is the possibility of being unable to prevent the lubricating oil from leaking into the cutting fluid system or vice versa. Though for such situations one can resort to dual or tri-purpose cutting fluids, one still needs to assess the effect of the mixture of coolant and lubricating oil on the machine tool slideway from the perspective of being able to meet the challenging demands of high positioning
Paper accepted August, 2008. Technical Editor: Anselmo Eduardo Diniz.
exactness, good compatibility of the coolant and lubricant, good demulsifying behavior, low stick-slip free coefficient of friction over a wide range of speed.
The current investigation, in addition to proposing a simple and effective means to assess the lubricity of cutting fluids or coolants, also attempts to relate the demulsification behavior of the mixture of coolant and lubricating oil to its tribological behavior through friction curves obtained using a linear reciprocating tribometer.
Coolant Deterioration and Lubricity
The initial investigation addresses the issues pertaining to deterioration of the coolant with emphasis on the role of hardness of water. An investigation into the lubricity properties is also carried out by studying the tribological behavior at varying speeds in the reciprocating tribometer. The coolants employed for the tests were made from single soluble oil (SOL XL). They were prepared by mixing the soluble oil with different sources of water in a ratio of 1:20 by volume. Depending on the water source the coolants were named as under:
Coolant A soluble oil + treated river water Coolant B soluble oil + ground water (tubewell) Coolant C soluble oil + distilled water.
Table 1. Hardness of different sources of water.
Water Source Hardness (ppm of CaCO3)
Table 2. pH values of coolants.
pH Value
Coolant-A Coolant-B Coolant-C Freshly prepared (1:20) 8.91 8.76 9.13
After 3 weeks (1:20) 8.82 8.34 9.13 After 3 months (1:20) 8.43 7.49 8.62
Dissolved minerals or salts or both cause hardness (Yang, 1979) in water. This is expressed as parts per million of Calcium Carbonate: 1ppm of Calcium Carbonate indicates that 1000 liters of water contain one gram of Calcium Carbonate.
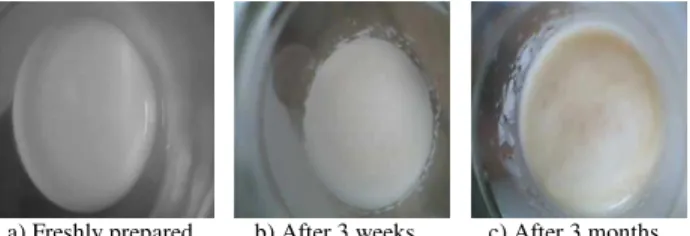
From Table 1, it can be seen that the ground (tubewell) water is harder compared to river treated water. In coolants prepared from hard water the dissolved salts gradually separate out and form a separate layer on the top. The net effect is that part of the concentrate adversely affects the cutting efficiency. Figures 1, 2 and 3 indicate the status of coolants prepared from ground, river treated and distilled water respectively at different time intervals. From the figures it is observed that the softer the water is, the longer it takes for the residue to separate out. In the coolant prepared from distilled water it is observed that no residue is formed even after three months of preparation. Thus, the minerals in water are very detrimental to the stability of coolant mixtures.
Minerals in water not only cause residues to form and corrosion to occur, but they also help bacteria to grow (Institute of Advanced Manufacturing Sciences, 1995). Minerals, other than those which cause hardness such as chlorides and sulphates, contribute to corrosion or rust and, the higher their concentration the more of the cutting fluid concentrate is required to prevent corrosion. The sulphates are particularly detrimental because they promote the growth of bacteria Desulfovibrio desulfuricans, which produce a rotten egg odor (Institute of Advanced Manufacturing Sciences, 1995). The effect of hardness in water is further compounded in the sump. A machine coolant sump acts as a still. The more the fluid is aerated, the more the water evaporates. As this occurs, the content of minerals in the water increases, causing formation of more residues with increased corrosion.
Since the ground and river treated water is found to have dissolved minerals, its pH value can be expected to be less compared to distilled water. The salts being acidic tend to lower the pH value. The pH value indicates the effectiveness of the rust control, cleaning ability and bacterial control. The cutting fluids must be designed such a way that they have a pH value ranging between 8.8 and 9.2. pH less than 8.8 increases bacterial activities and greater than 8.8, result in low bacterial activities. For better rust inhibition on ferrous metals a higher pH is desirable. But, in coolants with pH greater than 9.5-skin irritation becomes a major concern (Ciesko, 1975). The skin has a pH of 6.8 on the acidic side and has a protective layer of natural oils to retard moisture evaporation and to act as a mechanical shield. Consequently, anything that tends to remove the natural oils from the skin and to neutralize the acidity will tend to cause trouble, or to produce dermatitis. From table 2 it is seen that coolant B has got a pH slightly lower than 8.8 and is more prone to bacterial attack with time. From table 2 it is also observed that the pH value of coolants A and B after 3 weeks has slightly reduced. This is mainly due to evaporation of water, which increases the concentration of minerals (Silliman, 1992). Particularly in coolant B it is observed that the pH is reduced to 8.34. In shop floor conditions, where the chances of contamination are greater, a lower pH increases the bacterial activity, due to which the coolant degrades faster.
a) Freshly prepared b) After 3 weeks c) After 3 months
Figure 1. Effect of hardness of water on coolant A.
a) Freshly prepared b) After 3 weeks c) After 3 months
Figure 2. Effect of hardness of water on coolant B.
a) Freshly prepared b) After 3 weeks c) After 3 months
Figure 3. Effect of hardness of water on coolant C.
The above results though pertain to the deterioration of coolant, its lubricity is assessed from a tribological stand point. Coolant samples as prepared above were tested on the linear reciprocating Tribometer, as you can see in the following topics.
Linear Reciprocating Tribometer
A schematic of the Tribometer is shown in Fig. 4. The principle of operation (Fig. 5) consists of reciprocating a moving member (slide) against a stationary counter surface (block) with the slide reciprocating in the guideways of the machine. The slide and the block are made of En 354 steel surface hardened to 60 HRC and ground to a Ra of 0.5 and 0.3
µ
mrespectively. The specifications ofthe tribometer and accessories are:
Maximum Load 500 N
Stroke 200 mm
Block Dimension 54 X 25 X 25 mm Slide dimensions (body) 410 X 100 X 15 mm
Speed 0.1 mm/min to 2000 mm/min
co-efficient of friction was determined using the relation
N F = µ . The
dynamic friction coefficients of various coolants are given in Fig. 6.
Figure 4. Schematic of tribometer.
Figure 5. Principle of operation of tribometer.
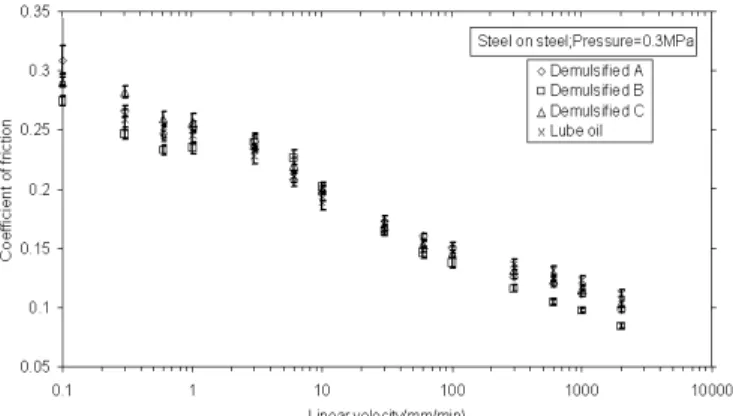
From Fig. 6 it is observed that Coolant C has the lowest friction, i.e., improved lubricity compared to Coolant A and Coolant B. Since the coolants were prepared from the same soluble oil, the higher friction values in Coolant A and Coolant B can be attributed to the salts dissolved in them. With increase in hardness of waters it can be predicted that the coefficient of friction may be still higher proving the fact that quality of water affects the lubricity property of coolants. Thus it can be concluded that coolant C has better lubricity in comparison with either coolant A or coolant B. The friction data presented are the average of freshly prepared, after three weeks and three months. The individual values for the freshly prepared, after three weeks and three months are presented in Fig. 7. Five tests were conducted for each condition and the average of the three conditions is presented in Fig. 6.
Figure 6. Dynamic friction characteristics of coolants.
(a) Coolant A
(b) Coolant B
(c) Coolant C
Demulsification Assessment and Tribological Behavior
The demulsification assessment is carried out as per DIN 51599 specifications. Lubricating oil employed to carry out demulsification assessment was commercially available lube (VG 68) with the following specifications:
Colour: Golden Yellow Flash point (°C): 170 Specific gravity @ 30°C: 0.88
Kinematic viscosity @ 40°C: 64-72 mm2/s
The main aim is to determine how fast the coolant and lubricating oil separate out. Equal amounts of coolant (20ml) and lubricating oil (20ml) are mixed and stirred for about five minutes at 1500 rpm. The mixture is kept in a test tube and observed after different intervals of time and the observations are recorded.
During machining operations the coolant supplied mixes with the lubricating oil present in the slide ways. The lubricating oil present in the slide ways attracts dust and becomes a breeding ground for bacteria. If this lubricating oil mixes with the coolant, undesirable effects may be produced. Further, this mixture will be let into the sump from where it is re-circulated. In the sump, due to evaporation of water, the mineral content increases and, again, the pH value reduces. Reduced pH leads to increased bacterial activity. To avoid this it is always desirable that the lubricating oil mixed with the coolant is removed. Hence it is necessary that coolant and lubricating oil separate out as soon as possible. Conducting the demulsification test can be informative with respect to the above. This test though gives an indication regarding the compatibility of the coolant and lubricating oil, nothing says about the influence of this mixture of coolant and lubricating oil on slideway behavior. Fig. 8 shows the demulsifying behavior of different coolants when mixed with lubricating oil after different intervals of time.
It is seen that there is complete separation of coolant and lubricating oil after nearly a month of mixing, which is a very long time. Hence, this combination of coolant and lubricating oil taken does not give good demulsifying behavior. Even though the demulsifying behavior is bad it is not possible to conclude whether the coolant is good, bad or compatible unless the tribological properties are studied.
1 2 3 1 2 3
1 Coolant A+ Lube Oil 2 Coolant B+ Lube Oil 3 Coolant C+ Lube Oil
a) After 30 minutes b) After 45 days
Figure 8. Observation of demulsified samples.
When the coolants are mixed with lubricating oil, the friction curves for the resulting demulsified samples as in Fig. 9 are higher compared to the friction curves for the stand alone coolants as seen from Fig. 6 indicating that friction in demulsified sample in the boundary layer regime is more than in coolants alone. This happens
because when lubricating oil gets mixed with coolants, the emulsion is destroyed and oil content increases. It is also observed from Fig. 9 that the demulsified samples have almost the same friction values and its values are comparable with the friction curve of lubricating oil.
The data presented in the Fig. 9 are for freshly prepared demulsified samples. The freshly prepared mixture of the coolant and lubricating oil mixed in equal proportion is stirred and drawn by a syringe and immediately used for testing. Samples prepared thus were chosen for testing in order to understand how the mixtures behave as they come into contact with each other, thus simulating a real life situation. Also for all the three coolant samples mixing with the lubricating oil marginal stick-slip behavior was observed at low velocities. Fig. 10 shows the stick-slip behavior indicated by the increase in friction force at low velocities for the demulsified sample B i.e. mixture of coolant B and lubricating oil. From the figure it was observed that the stick slip amplitude is maximum at 0.1mm/min and diminishes with increasing linear velocity.
Figure 9. Dynamic Frictional Characteristics of Demulsified Samples and Lubricating Oil.
Figure 10. Stick-slip behavior for the Demulsified Sample B.
Conclusions
The lubricity and compatibility of coolants and demulsified samples was determined and the following conclusions were drawn:
• The salts present in the water play a major role in making the coolant unfit for use as the hardness causes splitting of emulsion and formation of a gummy deposit.
• The friction characteristics (lubricity) of the coolants further show that the coolants prepared from hard water do not give an optimum performance as they result in a higher friction in comparison with coolants prepared from distilled water. • The effect of hardness on the friction characteristics of
demulsified samples was not found to be significant.
• A linear reciprocating tribometer as discussed can be used as a simple and effective tool to assess the lubricity of cutting fluids for low speed applications.
Acknowledgements
The authors would like to acknowledge M/s Appro Lubes, Bengaluru, Diamant Triumph Pvt Ltd, Bengaluru, Magnum Engineers, Bengaluru, for their support.
References
Ciesko R, 1975, “The Effect of Water Soluble Cutting Fluids on Operating Conditions in Machining”, Improving Production with Coolants and Lubricants, Society of Manufacturing Engineers, 1982, pp. 179-189.
Institute of Advanced Manufacturing Sciences, 1995, “Pollution Prevention Guide to using Metal Removal Fluids in Machining Operations”, Ohio, Section 3, pp. 28-29.
Liang S. Y., Medaska M. K., Nowag L., 1999, “Simultaneous measurement of the thermal and tribological effects of cutting fluid”, Machining Science and Technology, Vol. 3, No.2, pp. 221-237.
Sales W. F., Diniz A. E. and Machada A. R., 2001, “Application of cutting fluids in machining process”, Journal of the Brazilian Society of Mechanical Engineering, Vol. 23, No.2, pp. 227-240.
Silliman.J D, 1992, “Cutting and Grinding Fluids: Selection and Application”, Society of Manufacturing Engineers, Dearborn, Michigan. pp. 119-135.