J. of the Braz. Soc. of Mech. Sci. & Eng. Copyright 2008 by ABCM October-December 2008, Vol. XXX, No. 4 / 335 ! " #$" %
& ' ( ) & * ! &' &+ , -. !/ . " &+" %
' ( ) 0 * ! '10 0
2 #
! 0 *" #$" %
!
"
#
$
%
&
Most of the works accomplished in the optimization area in the cement industry are addressed to solve problems just considering only one variable, forgetting that it includes too many variables and they act at the same time. Among the main variables it can be mentioned the quality of the final product, the environmental ones, the costs along the process and the reduction of the fossil fuels (primary) employed through the use of alternative fuels (secondary), among others. The present work intends to build a mathematical model using optimization tools seeking to improve the cement production process foreseeing what can happen with the clinker and the emissions when the industrial residues co-processing technology is used as alternative or secondary fuel. In the optimization process a new approach called Particle Swarm Optimization (PSO) is employed, which is based on the Cauchy and Gauss distribution considering several process restrictions such as the specific fuel consumption, the cement quality and the environmental impact. The results obtained with PSO were precise and promising and they were compared with the classical Sequential Quadratic Programming (SQP). It was also possible to evaluate the levels of primary fuels substitution through the alternative or secondary ones.
Keywords: portland cement, industrial co-processing residues, particle swarm optimization (PSO), sequential quadratic programming (SQP).
Introduction
Nowadays, the Portland cement is the main cement type used all over the world and its production is the largest in amount if compared to the other products produced by men (Chatterjee, 1993). The Portland cement is composed of clinker and additions. The clinker is the main component and it is present in all types of Portland cement. The additions can vary from each cement type to another and they mainly define the different cement types. The production process of the Portland cement is presented in Fig.1. The clinker, base component of the Portland cement, is obtained from the grinding, homogenization and subsequent burn in high temperatures (1450ºC) inside a rotary cement kiln starting from a powdered mixture called raw, originating from the following raw materials: limestone, clay, sand, iron ore, etc. The main chemical elements that constitute the clinker are the lime (CaO) and the silica (SiO2) that react between themselves forming lime silica, which is
the main active component of the cement. 1
However, other materials can be used on the cement Portland production (Peray and Wadell, 1972). In the search for lower production costs, the cement industries have been trying to modernize their industrial plants, through the construction of new industrial units, which incorporate new production technologies. The introduction of secondary materials either as raw materials or in the co-processing, allows sensitive reduction in the final product cost. This fact contributes as a partial solution for the industrial waste disposal problems to a large number of companies. Also, the introduction of secondary materials provides additional revenue for the cement factories, either due to their low acquisition costs, or due to the payment received for the service of thermal waste destruction. However, the introduction of secondary materials must be subject to the desired final product quality, which is the most important control parameter in the cement Portland production. Moreover, when
Paper accepted September, 2008. Technical Editor: Celso K. Morooka.
industrial residues are used as secondary fuels in the rotary kilns, the generated ashes replace some of the components of the raw materials, and therefore these ashes must be made compatible with the remaining raw materials, in order to be absorbed in high percentage in the clinker matrix (Carvalho, 1997).
This work presents a formulation for the mixture optimization of coal, petroleum coke and used tires. This mixture is intended for use in a rotary kiln of clinker production, dry via, with a four stages pre-heater. However, the problem involving mixture of these components is complex. The optimization procedure takes into account process restrictions such as specific heat consumption, cement quality and environmental impact. In this case, the mixture optimization in cement kilns is a problem with nonlinear cost function with linear constraints.
Nomenclature
A,B = constants that depend on the clinker composition, dimensionless
c1,c2 = positive constants, dimensionless
MS = silica modulus, dimensionless
pi = position of the best objective value on the i-th particle,
dimensionless
pic = raw material and fuel cost , U$/t
pE = electricity cost ,U$/MWh S = specific surface, m2/g
ud, Ud= functions for random numbers generation in range [0,1]
vi = velocity of the i-th particle, dimensionless w = inertia factor, dimensionless
Cauchy= function that generates a random number with Cauchy distribuition for the “social” component
Gauss= a random number generated with Gauss distribution with average zero and unitary variance
Subscripts
Figure 1. Stages of the Portland cement process production
Fuels in the Cement Industry
Due to the high heat consumption in the process, the cement industry always worried about using fuels of low cost, but without losing the quality of the final product. One of the alternatives found to obtain the economy of the energy resources was the co-processing of industrial wastes, also denominated alternative or secondary fuels (Hansen, 2003). The process consists basically in the replacement of a part of the traditional fuel for residues generated by other industries such as useless tires, waste oils and sludge of hazardous and industrial waste treatment, among others (Kleppinger, 1993). In Brazil, the cement industries are using the petcoke as main fuel due to its low cost jointly with the industrial residues (alternative fuels), Fig. 2.
Coal & Petcoke Natural Gas
ALTERNATIVES FUELS IN CEMENT INDUSTRY
Oil
CONVENTIONAL
- Tyres - Tyre Chips - Plastic - Paper - Agricultural
waste - Organic Material - etc.
Solid
- Pasty wastes - Solvent - Greases - Oily wa stes - etc.
Liquid
- Landfill gas - Pyrolysis gas - etc.
Gaseous
Figure 2. Fuels employed in cement industries.
Grinding in the Cement Industry
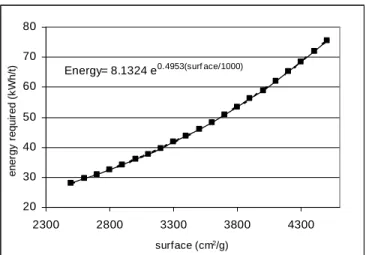
As described previously, the composed cements contain other added constituents that should be mixed in the phase of clinker grinding. In this case, the grinded product should be inside a certain granulometry limit in such a way to create better conditions for the hardening process (Duda, 1977). Approximately 30% of the energy required to produce a ton of cement is consumed in the grinding. This is a significant percentage of the total cement cost. The energy consumed in the mills is in the range of 16,5 - 63,5 kWh/t with an average of 36 kWh/t (Tokyay, 1999). There is a relationship between the required energy in the grinding phase and the specific surface (Tokyay, 1999). The larger the thinness of the cement (granulomety) is, the bigger will be the specific surface, and as a consequence, there will be a larger consumption of energy (Fig. 3) (Zhang and Napier-Munn, 1995).
20 30 40 50 60 70 80
2300 2800 3300 3800 4300
surface (cm2/g)
e
n
e
rg
y
r
e
q
u
ir
e
d
(
k
W
h
/t
) Energy= 8.1324 e0.4953(surf ace/1000)
Figure 3. Energy required rate versus specific surface (Tokyay, 1999).
Model Description and Methodology
Optimization Problem Description
The modeling will use optimization algorithms, of which objective is to assure a better stability of the kiln operation, energy consumption reduction and environmental impact minimization. The following aspects will be modeled:
a) The effects that the use of alternative fuels can cause:
- in the clinker quality, through the material and fuel chemical composition;
- in the environment, through the raw material and fuel emissions of CO2 and SO2;
- in the clinker production cost, considering the raw material and fuels costs; obtaining as result a optimum composition of raw material and fuels for the clinker production.
b) The cost and electric power consumption requested in the grinding process for the Portland cement production (Tokyay, 1998). The grinded product should be inside a certain granulometry limit in such a way to create better conditions for the hardening process (Duda, 1977). The equation that represents the electric power requested in the grinding process should be expressed in function of the specific surface and the mixture control modules.
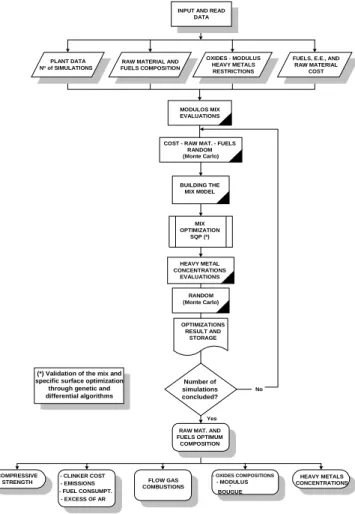
To accomplish the modeling it is necessary to know the input parameters data (raw materials, fuels, raw materials costs, etc), and these should be addressed in function of the proposed objective getting as results the costs optimization, environmental impact minimization, among others. In the work of Carpio et al. (2005) a flowchart is presented, which shows the procedure that will be necessary to accomplish to model the proposed system (Fig. 4).
Building the Model of the Mixture of the Raw Materials and Fuels
J. of the Braz. Soc. of Mech. Sci. & Eng. Copyright 2008 by ABCM October-December 2008, Vol. XXX, No. 4 / 337
INPUT AND READ DATA
PLANT DATA No of SIMULATIONS
RAW MATERIAL AND FUELS COMPOSITION
FUELS, E.E., AND RAW MATERIAL
COST OXIDES - MODULUS
HEAVY METALS RESTRICTIONS
COST - RAW MAT. - FUELS RANDOM (Monte Carlo) BUILDING THE MIX M0DEL COMPRESSIVE STRENGTH
- CLINKER COST - EMISSIONS - FUEL CONSUMPT.
- EXCESS OF AR
RAW MAT. AND FUELS OPTIMUM COMPOSITION
FLOW GAS COMBUSTIONS
- OXIDES COMPOSITIONS
- MODULUS -BOUGUE HEAVY METALS CONCENTRATIONS RANDOM (Monte Carlo) OPTIMIZATIONS RESULT AND STORAGE Yes No Number of simulations concluded? MODULOS MIX EVALUATIONS HEAVY METAL CONCENTRATIONS EVALUATIONS
(*) Validation of the mix and specific surface optimization through genetic and differential algorithms
MIX OPTIMIZATION
SQP (*)
Figure 4. Flowchart when the industrial wastes co-processing is employed (Carpio, 2005).
The mixture optimization should consider the stable operation of the rotative kiln, the quality of the clinker produced, the minimum cost of the used composition and the electric power; all these variables are considered in the nonlinear model proposed through the following objective function, Eq.(1).
∑
= + = n 1 i (B.S) E i ci.X p .A.exp
p
C (1)
The objective function (C) of the model should try to obtain a minimum cost in the clinker production, considering the raw materials costs as well as the consumption of the energy required for grinding.
The first term (linear) represents the raw materials and fuels (primary and alternative) costs used in the clinker production (pi, is
the raw materials and fuels costs i = 1,2... n, that participate in the burn with their respective percentages X1, X2,...Xn).
The second term (nonlinear) represents electricity cost (pE) and
the energy consumption required in kWh/t for the grinding process of a certain specific surface (S is the area of the specific surface in cm2/g, A and B are constants that depend on the clinker composition). Based on Tab.1 and Tab. 2 values and on the Eq. (1), an objective function was set up, which represents costs minimization problem, considering the operational and environmental costs presented as it follows:
Table 1. Meal raw materials chemical composition (% in weight) (Carpio, 2005)
Material Notation CaO SiO2 Al2O3 Fe2O3 MgO SO3 Na2O K2O
Limestone X1 50.66 5.04 1.19 0.67 0.78 0.1 0.1 0.3
Clay X2 1.23 61.62 16.59 9.01 0.3 0.3 5
Sand X3 1.13 93.00 2.87 1.20 0.10 0.5 0.5 1
Iron ore X4 0.71 7.60 1.13 82.97 - - - -
Table 2. Fuels composition employed as primary and secondary (ABCP, 2002)
Component Mineral Coal % weight
Petcoke % weight
Tires uses % weight
Notation X5 X6 X7
C 63.9 80 – 100 72.15
H 3.6 3.5 6.74
S 4.6 0.5 – 7.0 1.23
O 0.9 9.67
N 1.8 1.5 0,36
Cl - 0.149
Zinc 0.04 1 – 85 ppm
Cadmium 0.001 1 ppm 0.0006
Lead 0.027 1 – 10 ppm 0.0065
Thallium 0.0004 1 – 80 ppm 0.00001 Arsenic 0.00017 0.1 – 10 ppm
LHV [kJ/kg] 25.392 32.447 32.100
7 5 4 3 2 1 7 5 4 3 2 1 S * 0,98) (MS) (-0,2 EE 7 7 6 6 5 5 4 4 3 3 2 2 1 1 X 0.92 X 12.29 X 84.1 X 4.07 X 25.6 X 1.86 X 1.93 X 9.32 X 7.6 X 93 X 61.62 X 5.04 MS where } e 5,82) -{(5,76(MS) Cost X Cost -X Cost X Cost X Cost X Cost X Cost X Cost Min + + + + + + + + + + = ⋅ ⋅ + + + + + + + (2) Subject to: 63.76 0.93X 1.03X 0.71X 1.13X 1.23X
50.60X1+ 2+ 3+ 4+ 5+ 7≥ (3)
70.14 0.93X 1.03X 0.71X 1.13X 1.23X
50.60X1+ 2+ 3+ 4+ 5+ 7≤ (4)
19.71 1.93X 9.32X 7.6X 93X 61.62X
5.04X1+ 2+ 3+ 4+ 5+ 7≥ (5)
24.25 1.93X 9.32X 7.6X 93X 61.62X
5.04X1+ 2+ 3+ 4+ 5+ 7≤ (6)
3.76 0.79X 5.08X 1.13X 2.87X 16.59X
1.19X1+ 2+ 3+ 4+ 5+ 7≥ (7)
6.78 0.79X 5.08X 1.13X 2.87X 16.59X
1.19X1+ 2+ 3+ 4+ 5+ 7≤ (8)
1.29 0.13X 7.21X 82.97X 1.2X 9.01X
0.67X1+ 2+ 3+ 4+ 5+ 7≥ (9)
4.64 0.13X 7.21X 82.97X 1.2X 9.01X
0.67X1+ 2+ 3+ 4+ 5+ 7≤ (10)
6.5 0.12X 0,44X 0.10X
0.78X1+ 3+ 5+ 7≤ (11)
0 0.186X 18.96X 185.83X 83.64X 2.74X
0.762X1+ 2+ 3− 4− 5− 7≥ (12)
0 0.554X 23.88X 219.47X 82.011X 7.5X
0.018X1+ 2− 3+ 4+ 5+ 7≥
0 0.621X 4.29X
106.73X 1.31X
4.877X
0.319X1+ 2+ 3− 4− 5+ 7≥ (14)
0 0.439X 14.387X
222.88X 0.37X
7.737X
0.619X1+ 2+ 3+ 4+ 5− 7≥ (15)
0 4.2X 37.86X 164.34X
173.6X 155.67X
38.24X1− 2− 3− 4− 5− 7≥ (16)
0 34 . 5 51 . 46 0 . 201 43 . 212 65 . 190 48 .
35 1+ 2+ 3+ 4+ 5+ 7≥
− X X X X X X (17)
3600 32100X 34436X
25392X1+ 6+ 7= (18)
0.05 0.0123X 0.07X
0.046X5+ 6+ 7≤ (19)
0.20 0.5X 3X
0.1X1+ 2+ 3≥ (20)
2.07 0.5X 3X
0.1X1+ 2+ 3≤ (21)
0.03 0.5X 0.3X
0.1X1+ 2+ 3≥ (22)
0.33 0.5X 0.3X
0.1X1+ 2+ 3≤ (23)
0.31 X 5X
0.3X1+ 2+ 3≥ (24)
1.76 X 5X
0.3X1+ 2+ 3≤ (25)
0.10 X A X A X
A5 5+ 6 6+ 7 7≤ (26)
0.35 X B X B X
B5 5+ 6 6+ 7 7≤ (27)
0.05 X
C6 6≤ (28)
0.10 X D X D X
D5 5+ 6 6+ 7 7≤ (29)
The Equations from 3 to 10 represent the operational restrictions, where the amount of CaO should stay between 62 and 67% Eq.(3) and Eq.(4), SiO2 between 19 and 25% Eq.5 and Eq.(6),
Al2O3 between 2 and 9% Eq.(7) and Eq.(8) and Fe2O3 between 1
and 5% Eq.(9) and Eq.(10). The maximum amount of magnesium should be limited in 6.5% Eq.(11). Equations (12) to (17) are the restrictions of the mixture control modules regarding to the clinker quality (Carpio et al., 2004). The total fuels feeding should assist the heat specific consumption presented in Eq. (18). The restriction regarding to the sulfur is presented in Eq. (19). Equations (20) and (21) represent the limits for the trioxide of sulfur (SO3) contained in
the raw material. The restrictions of the Equations (22) to (25) are referred to the alkalis in the raw material. The more volatile and dangerous heavy metals, such as the cadmium, lead, mercury and thallium, are controlled by the restrictions of the Equations (26) to (29). More details about the restrictions can be found in Carpio (2005).
Particle Swarm Optimization Method (PSO)
PSO is an approach of collective intelligence (swarm intelligence) and it was developed initially by Kennedy and Eberhart (Kennedy and Eberhart, 1995; Eberhart and Kennedy, 1995; Kennedy et al., 2004) based on the studies of the social-biologist Edward Osborne Wilson. The proposal of PSO algorithm was put forward by several scientists who developed computational simulations of the movement of organisms such as birds flocks and fish schools. Such simulations were heavily based on manipulating the distances between the individuals, i.e., the swarm behavior
synchrony is seen as an effort to keep an optimal distance between them.
In theory, at least, individuals of a swarm may benefit from the prior discoveries and experiences of all the members of a swarm when foraging. The fundamental point of developing PSO is a hypothesis in which the exchange of information among creatures of the same species offers some sort of evolutionary advantage.
PSO presents characteristics similar to the evolutionary computation techniques (Goldberg, 1989), which are based on a population of solutions. However, PSO is motivated by the simulation of social behavior and cooperation among agents instead of the most capable individual's survival as in the evolutionary algorithms. In PSO, each candidate solution (denominated particle) has an associated velocity. The velocity is adjusted through an updating equation that considers the experience of the corresponding particle and the experience of the other present particles in the population.
The concept of PSO consists of, to each iterative step, changing the velocity of each particle towards the pbest (personal best) and gbest (global best) locations. The velocity of the search procedure is pondered through a generated term in a random way linked in a separate way of the pbest and of the gbest locations.
The procedure for PSO implementation is governed by the following stages:
(i) begin a population (matrix) of particles, with positions and velocity in a space problem of n dimensional, randomly with uniform distribution.
(ii) for each particle, evaluate the fitness function (objective function);
(iii) compare the evaluation of the particle aptitude function with the pbest of the particle. If the average value is better than the pbest, then the pbest value becomes the value of the aptitude function and the pbest location becomes the same of the current location in the n dimensional space;
(iv) compare the aptitude function evaluation with the best previous value of the population aptitude. If the current value is better than the gbest, update the gbest value for the index and current particle value;
(v) modify the velocity and the position of the particle in agreement with the equations (Shi and Eberhart, 1998; Kennedy et al., 2001):
) x (p Ud c ) x (p ud c v w
vi= ⋅ i+ 1⋅ ⋅ i− i + 2⋅ ⋅ g− i (30)
) v t (x
xi= i+ ⋅ i (31)
where ∆t is 1.
(vi) go to the stage (ii) until a stop criterion is found. It is usually used a pre-defined error or a maximum number of iterations (generations).
The used notations are:
[
]
T in i2 i1 i x , x ,...,xx = which stores the i-th
position of the particle,
[
]
T in i2 i1 i v , v ,...,vv= which stores the i-th velocity of the particle and
[
]
Tin i2 i1 i p ,p ,...,p
p = which represents the
position of the best fitness value of the i-th particle. The index g represents the index of the best value among all of the particles of the group. The variable w is the inertia factor, c1 and c2 are the
cognitive and social components, respectively, which are the acceleration constants responsible for varying the particle speed towards pbest and gbest, respectively; ud and Ud are two functions for random numbers generation with uniform distribution in the interval [0,1], respectively. The particles velocity of each dimension is limited to a maximum value of velocity, Vmax.
J. of the Braz. Soc. of Mech. Sci. & Eng. Copyright 2008 by ABCM October-December 2008, Vol. XXX, No. 4 / 339 independent "knowledge" of the particle. The third part is the
"social" one, which represents the co-operation among the particles. The c1 and c2 represent the weighted of the "cognition" and
"social" parts that influence each particle toward pbest and gbest. These constants are usually adjusted by try and error heuristics attempts. The population size is also selected depending on the dimension of the approached problem.
In classical PSO approaches, a uniform probability distribution is used to generate random numbers to update the velocity equation. However, the use of other probability distributions may improve the ability to fine-tune or even escape from local optima. In the meantime, it has been proposed that the Gaussian and/or Cauchy probability distributions be used to generate random numbers to update the velocity equation (Miranda and Fonseca, 2002; Wei et al., 2002, Secrest et al., 2003; Stacey et al., 2003; Esquivel and Coello, 2003; Higashi and Iba, 2003; Coelho and Krohling, 2005; Ting et al., 2006; Krohling and Coelho, 2006, Coelho and Alotto, 2008; Coelho and Lee, 2008).
The PSO approach proposed in this work, denominated of PSO-CG, seeks to modify the equation (30) of the conventional PSO for:
) x (p Gauss c ) x (p Cauchy c
v w
vi= ⋅ i+ 1⋅ ⋅ i− i + 2⋅ ⋅ g− i (32)
where Cauchy is a function that generates a random number with Cauchy distribution for the "social" component and Gauss generates a random number with Gauss distribution with average zero and unitary variance for the "cognitive" component of PSO.
The use of Cauchy distribution in PSO can be useful to avoid local minima when the search space is small, while the Gauss (normal) distribution (truncated in [0,1] in this paper) can supply a faster convergence in local searches when the search space is big (Chellapilla, 1998).
Results and Analysis
Simulation Results
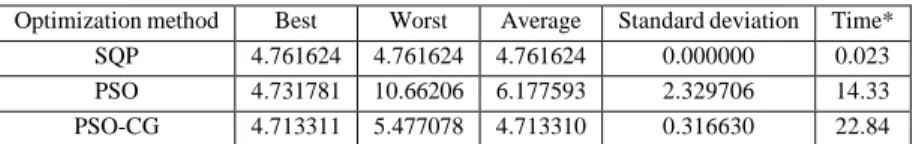
The results for the optimization nonlinear evaluation using conventional PSO, PSO-CG and Sequential Quadratic Programming (SQP) are summarized in Table 3 (run 30 experiments with each optimization technique). In this case, the required chemical composition is sought for a cement type produced in a rotative kiln, dry via, with heat specific consumption of 3600 clinker kJ/kg.
Table 3. Equation 2 (30 experiments) objective function optimization results
Optimization method Best Worst Average Standard deviation Time*
SQP 4.761624 4.761624 4.761624 0.000000 0.023
PSO 4.731781 10.66206 6.177593 2.329706 14.33
PSO-CG 4.713311 5.477078 4.713310 0.316630 22.84
* time (in seconds) to run each experiment in a PC computer (1,09 GHz AMD 4, 124 MB RAM with Matlab 6.5)
Table 4. Optimization model results employing PSO-CG
Objective Function C = US$4.713311/ton
Oxides compositions in Clinker (%) Modulus Specific heat consumption = 3600 (kJ/kg clk*)
Compositions (kg/kg Clk*) Consumption of fuels (kg/tonclq*)
X1 = 1.2175 CaO = 62.07
X2 = 0.2007 SiO2 = 20.13 MS =2.50 Petroleum Coke = 74.1
X3 = 0.0161 Al2O3= 5.22 MA =1.82 Used tires = 28.0
X4 = 0.0000 Fe2O3= 2.86 MH =2.20 * Clk: Clinker
X5 = 0.0000 MgO = 0.95
X6 = 0.0741
X7 = 0.0280
Table 3 presents the medium, minimum, maximum and the standard deviation values results. The parameters of PSO and PSO-CG used a population of 30 particles; c1 = c2 = 2.05; initial weighted
w of 0.729 with linear decline up to 0.400; search space of the variables to be optimized in the interval 0 < Xn < 3, where n=1,..,7; Vmax: 20% of the search space of each variable; and maximum
number of generations (stop criterion): 500 generations. SQP uses a Hessian matrix approach (of the function Lagrange) and it uses a Quasi-Newton's method and line search for minimization of the cost function (Fletcher, 1987; Nash and Sofer, 1996; Boggs and Tolle, 2000).
It is noticed that the obtained results using PSO-CG and SQP is quite close, with a little advantage of PSO-CG in terms of answer quality. However, SQP, in spite of not finding the optimum value, is faster in terms of computational cost and with smaller standard deviation than PSO and PSO-CG.
Conclusion and References
References
ABCP Associação Brasileira de Cimento Portland, 2002, “Guia Básico de Utilização do Cimento Portland”, 7th edition, São Paulo, SP, 28 p. (BT-106), Brazil (in Portuguese).
Boggs, P.T., Tolle, J.W., 2000, “Sequential Quadratic Programming for Large-scale Nonlinear Optimization”, Journal of Computational and Applied
Mathematics, Vol. 124, No. 1-2, pp. 123-137.
Carpio, R.C., 2005, “Otimização no Co-processamento de Resíduos na Indústria do Cimento envolvendo Custos, Qualidade e Impacto Ambiental”, Tese de Doutorado, Universidade Federal de Itajubá, MG, Brazil (in Portuguese).
Carpio, R.C., Coelho, L.S., Silva, R.J., Jorge, A.B., 2005, “Case Study in Cement Kilns Alternative Secondary Fuels Mixing Using Sequential Quadratic Programming, Genetic Algorithms, and Differential Evolution”, Proceedings of 6th World Congress on Structural and Multidisciplinary Optimization, Rio de Janeiro, RJ, Brazil.
Carpio, R.C., Silva, R.J., Jorge, A.B., 2004, “Heavy Metals Influence in the Mixture Optimization of Industrial Waste Fuels in Cement Industry”, XXV Iberian Latin-American Congress on Computational Methods in Engineering, Recife, PE, Brazil.
Chatterjee, A.K., 1993, “Special & New Cement in a Historical Perspective”, Proceedings of 3th Brazilian Congress of Cement, ABCP – Associação Brasileira de Cimento Portland, São Paulo, SP, Brazil, Vol. II, pp. 693-793.
Chelapilla, K., 1998, “Combining Mutation Operators in Evolutionary Programming”, IEEE Transactions on Evolutionary Computation, Vol. 2, No. 3, pp. 91-96.
Coelho, L.S., Alotto, P., 2008, “Global Optimization of Electromagnetic Devices Using an Exponential Quantum-Behaved Particle”, IEEE
Transactions on Magnetics, Vol. 44, No. 6, pp. 1074-1077.
Coelho, L.S., Krohling, R.A., 2005, “Predictive Controller Tuning Using Modified Particle Swarm Optimization based on Cauchy and Gaussian Distribution”, Soft Computing: Methodologies and Applications, Advances in Soft Computing Series, F. Hoffmann, M. Köppen, F. Klawonn, and R. Roy (editors). Springer-Verlag, UK.
Coelho, L.S., Lee, C.S., 2008, “Solving Economic Dispatch in Power Systems Using Chaotic and Gaussian Particle Swarm Optimization Approaches”, International Journal of Electrical Power & Eenrgy Systems, Vol. 30, No. 5, pp. 297-307.
Duda, W.H., 1977, “Manual Tecnológico del Cemento”, Editores Técnicos Associados, Barcelona, Spain (in Spanish).
Eberhart, R.C., Kennedy, J.F., 1995, “A New Optimizer Using Particle Swarm Theory”, Proceedings of International Symposium on Micro Machine and Human Science, Japan, pp. 39-43.
Esquivel, S.C., Coello, C.A.C., 2003, “On the Use of Particle Swarm Optimization with Multimodal Functions”, Proceedings of IEEE Congress on Evolutionary Computation, Canberra, Australia, Vol. 2, pp. 1130-1136.
Fletcher, R., 1987, “Practical Methods of Optimization”, 2nd edition, John Wiley & Sons, New York, NY, USA.
Goldberg, D.E., 1989. “Genetic Algorithms in Search, Optimization, and Machine Learning”, Addison Wesley: Reading, MA, USA.
Hansen, E.R., 2003, “Changing Process Priorities when Firing Alternative Fuels”, Technical Consultant to Cadence Environmental Energy, Inc. Cement Industry Technical Conference, IEEE, pp. 219-230.
Higashi, N., Iba, H., 2003, “Particle swarm optimization with Gaussian mutation,” Proceedings of the IEEE Swarm Intelligence Symposium, Indianapolis, IN, USA, pp. 72-79.
Kennedy, J., Eberhart, R.C., 1995, “Particle Swarm Optimization”, Proceedings of IEEE International Conference on Neural Networks, Perth, Australia, vol. 4, pp. 1942-1948.
Kennedy, J.F., Eberhart, R.C., Shi, Y., 2001, “Swarm Intelligence”, Morgan Kaufmann Pub., San Francisco, CA, USA.
Kleppinger, E.W., 1993, “Cement Clinker: An Environmental Sink for Residues from Hazardous Waste Treatment in Cement Kilns”, Waste
Management, Vol. 13, No. 8, pp. 553-572.
Krohling, R.A., Coelho, L.S., 2006, “Co-evolutionary Particle Swarm Optimization Using Gaussian Distribution for Solving Constrained Optimization Problems”, IEEE Transactions on Systems, Man, and
Cybernetics - Part B: Cybernetics, Vol. 36, No. 6, pp. 1407-1416.
Krolhing, R.A., Hoffmann, F., Coelho, L.S., 2004, “Co-evolutionary Particle Swarm Optimization for Min-max Problems Using Gaussian Distribution”, Proceedings of Congress on Evolutionary Computation, Portland, USA, pp. 959-964.
Miranda, V., Fonseca, N., 2002, “EPSO – Best-of-two Words Meta-heuristic Applied to Power Systems Problems”, Proceedings of IEEE Congress on Evolutionary Computation, Honolulu, HI, USA, Vol. 2, pp. 1080-1085.
Nash, S.G., Sofer, A., 1996, “Linear and Nonlinear Programming”, McGraw-Hill, New York.
Secrest, B.R., Lamont, G.B., 2003, “Visualizing Particle Swarm Optimization - Gaussian Particle Swarm Optimization”, Proceedings of the IEEE Swarm Intelligence Symposium, Indianapolis, IN, USA, pp. 198-204.
Shi, Y., Eberhart, R.C., 1998, “Parameter Selection in PSO Optimization”, Proceedings of the 7th Annual Conference on Evolutionary Programming, San Diego, CA, USA, pp. 25-27.
Stacey, A., Jancic, M., Grundy, I., 2003, “Particle Swarm Optimization with Mutation”, Proceedings of the IEEE Congress on Evolutionary Computation, Canberra, Australia, pp. 1425-1430.
Ting, T.O., Rao, M.V.C., Loo, C.K., 2006, “A Novel Approach for Unit Commitment Problem via an Effective Hybrid Particle Swarm Optimization”, IEEE Transactions on Power Systems, Vol. 21, No. 1, pp. 411-418.
Tokyay, M., 1999, “Effect of Chemical Composition of Clinker on Grinding Energy Requirement”, Cement and Concrete Research, Vol. 29, No. 4, pp. 531-535.
Wei, C., He, Z., Zheng, Y., Pi, W., 2002, “Swarm Directions Embedded in Fast Evolutionary Programming”, Proceedings of the IEEE Congress on Evolutionary Computation, Honolulu, HI, USA, pp. 1278-1283.