0103 - 5053 $6.00+0.00
A
r
ti
c
le
* e-mail: [email protected]
Graphite Electrodes Modified by 8-Hydroxyquinolines and its Application
for the Determination of Copper in Trace Levels
Eliane R. de Sousa,a Edmar P. Marques,a Elizabeth N. Fernandes,a Jiujun Zhangb and Aldaléa L. B. Marques*,a
a
Departamento de Tecnologia Química, Universidade Federal do Maranhão, Av. dos Portugueses, S/N, Campus do Bacanga, 65080-040, São Luis-MA, Brazil
b
Institute for Fuel Cell Innovation, National Research Council Canada, Vancouver, BC, V6T 1W5, Canada
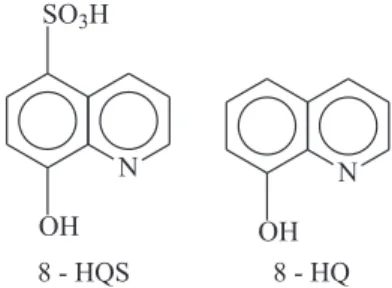
O presente trabalho mostra a modificação da superfície de eletrodos de grafite pelos compostos 8-hidroxiquinoleina (8-HQ) e ácido 8-hidroxiquinoleina 5-sulfônico (8-HQS). Voltametria cíclica foi usada para caracterizar o comportamento da superfície. A superfície modificada exibiu uma afinidade para complexar Cu(II) presente na solução, formando um complexo na superfície o qual foi empregado para análise de Cu(II) em nível de traços. Dos metais Zn, Ni, Pb, Co e Cd, nenhum apresentou interferência até um excesso de concentração de 10 vezes. Significante interferência foi observada para os íons Co(II), Cd(II) e Fe(II), para um excesso de concentração de 100 vezes sobre o analito. Voltametria no modo pulso diferencial, combinada com um processo de pré-concentração-redissolução e o método de adição padrão foram usados para as medidas analíticas. Um limite de detecção de 5,1×10⁻⁹ mol L-1 foi obtido na determinação de cobre em água.
Surface modification by 8-hydroxyquinoline-5-sulfonic acid (8-HQS) or 8-hydroxyquinoline (8-HQ) on a graphite electrode through irreversible adsorption is reported in this paper. Cyclic voltammetry was used to characterize the surface behavior. The modified surface exhibited an affinity to chelating Cu(II) in the solution, forming a Cu(II) complex, which was employed for Cu(II) trace analysis. Of the metals Zn, Ni, Pb, Co, and Cd, none presented interference until excess concentration of 10 times. Significant interference could be observed from Co(II), Cd(II) and Fe(II) for an excess concentration of 100 times on the analyte. A differential pulse voltammetry, combined with a preconcentrating-stripping process and a standard addition method was used for the analysis. A detection limit for trace copper determination in water, such as 5.1×10⁻⁹ mol L-1, was obtained.
Keywords: 8-hydroxyquinoline-5-sulfonic acid, 8-hydroxyquinoline, surface complex, stripping voltammetry, trace copper determination
Introduction
In recent years, applications of chemically modified electrodes (CME) have made great success in various areas of research and development, such as material corrosion and inhibition, electrocatalysis, electronics, biosensors and electroanalysis.1-8 In the analysis of trace metals, CME have shown some advantages over other analytical methods and have been employed as powerful tools for concentration determination and surface structure identification.9,10
One of the strategies for surface modification is to employ organic ligands such as phenanthrolines,11-14 anthraquinone,15 pyrazine,16 alizarin,17,18 and triazine19
which adsorb irreversibly onto the surface of a glassy carbon electrode. Generally, these molecules contain a large conjugated benzene rings that can be easily and irreversibly attached on the carbon or graphite material electrode surface, forming the CME.
water sample analysis has been demonstrated successfully using the CMEs developed in this work.
Experimental
Apparatus and reagents
Electrochemical measurements were carried out by a BAS 50W Electrochemical analyzer. A three-compartment electrochemical cell, containing a modified graphite working electrode, a platinum auxiliary electrode and an Ag/AgCl (3 mol L-1 KCl solution) reference electrode, were employed in this study. All potentials reported in this paper are referred to this reference electrode potential. All reagents were of analytical grade (Merck P.A). High purity de-ionized water was used to prepare the solutions. 8-HQS and 8-HQ were used without further purification. A Britton-Robinson (BR) buffer solution was obtained by adding 0.1 mol L-1 NaOH into a pre-mixed acid solution (0.04 mol L-1 CH
3COOH, 0.04 mol L-1 H
3BO3 and 0.04 mol L -1 H
3PO4). A series of solutions with the desired pH values was prepared by adding controlled amounts of 0.1 mol L-1 NaOH solution. A 0.1 mol L-1 NaClO
4 solution was used to control the ionic strength. A stock aqueous solution of oxine was prepared and kept in the dark to prevent light exposure. A stock solution of Cu(II) (1×10⁻² mol L-1) was prepared by diluting a commercially available standard cupric sulphate solution. Nitrogen was used to expel dissolved oxygen in all solutions. All measurements were performed at a temperature of 25 ± 2 oC.
Electrode preparation and pretreatment
A pyrolytic graphite disk was sealed to a copper shaft with polyolefin heat-shrinkable tubing. The graphite electrode surface was mechanically polished using polishing sandpaper. After polishing, the electrode was rinsed with de-ionized water and left in the atmosphere for drying. The surface of the graphite electrode was renewed for each run. The electrode area (0.12 cm2) was calibrated through cyclic voltammetry in a standard solution of 2×10⁻³ mol L-1 K3[Fe(CN)6]. For the surface modification, the clean
graphite electrode was immersed into a stirred saturated solution of 8-HQS ligand (or 8-HQ) for 40 s. For copper attachment, the electrode now modified by 8-HQS or 8-HQ was then placed in the electrochemical cell containing BR buffer and Cu(II). For the preconcentration process, the electrode modified by 8-HQS or 8-HQ was maintained at - 0.5V for 120 s in the sample solution buffered with the BR buffer. Then a differential pulse mode was employed to record anodic stripping voltammetry.
Procedure
Drinking water samples were collected and stored in polyethylene bottles that had been carefully cleaned with 10% nitric acid and then by water carefully before sample collection. The pH of the sample water during collection was 7.8. A known amount of standard Cu(II) solution was added into the sample for the purpose of calibration (standard addition method).
Results and Discussion
Voltammetric behavior of 8-HQS and 8-HQ adsorbed on the electrode surface
The cyclic voltammograms of a graphite electrode modified by 8-HQS or 8-HQ exhibit two reversible redox couples (I/I’ and II/II’) as can be demonstrated in Figure 2, (b) and (c), respectively. The electrode was first immersed in a 8-HQS or 8-HQ saturated aqueous solution for 40 s, removed, rinsed with water, and then placed in an electrochemical cell containing BR buffer solution (pH 2.0) for cyclic voltammetry. For the purpose of comparison, Figure 2 also shows the cyclic voltam-mograms for a bare graphite electrode (a).
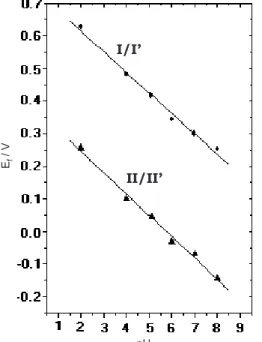
Cyclic voltammograms were also obtained at various potential scan rates. A linear relationship between the peak current and potential scan rate for both waves (I/I’ and II/II’) was observed, suggesting that the surface behavior follows that expected by surface electrochemical theory.21 The pH-dependence of the wave formal potential for both compounds 8-HQS and 8-HQ was investigated in the BR buffer solution with different pH values as showed in Figure 3. A slope of ~59 mV/pH was observed for both waves, indicating that the electrochemical processes represented by both compounds involved one proton for each electron transferred.
Surface affinity of 8-HQS and 8-HQ modified electrodes to Cu(II) ion
The 8-HQS or 8-HQ modified graphite electrode was soaked in a solution containing 1×10⁻² mol L-1 of CuSO4
for about 40 s, removed, then rinsed with pure water. The electrode was then transferred into the electrochemical cell only containing pure supporting electrolyte and BR buffer for cyclic voltammetry. The obtained cyclic voltammograms showed that the wave I/I’ could not be observed anymore after the surface coordination with Cu(II), only the wave II/II’ is still visible in the investigated potential range. This observation suggests that the coordination between Cu(II) and 8-HQ or 8-HQS could change the surface electrochemical process or mechanism
of the ligand. The coordination between Cu(II) and 8-HQS or 8-HQ ligand is fairly strong with two ligands around each Cu(II) ion. The proposed surface complex structures are as in Figure 4.
For electroanalytical purposes, the modified electrodes were also investigated in a Cu(II) containing solution (2×10⁻⁴ mol L-1). Figure 5 (a) shows the cyclic voltam-mogram of an unmodified graphite electrode in the presence and absence (bare electrode) of Cu(II). A small redox wave could be observed, which corresponds to the two-electron reduction of Cu(II) to Cu(0):
Cu2+ + 2 e- Cu (1)
However, this redox wave would be increased in magnitude by almost twelve-folds after the electrode was coated with 8-HQ or 8-HQS, indicating that the modified electrode has a strong affinity for Cu(II) in the bulk solution through surface coordination (Figure 5 (b)). This behavior should be extremely useful for Cu(II) trace analysis through the preconcentrating process. The sharp peak near 0.0 V in Figure 5 (b) is a stripping process of deposited copper from Cu(0) to Cu(II).
A detailed analytical application for the modified electrode in Cu(II) determination was explored using differential pulse anodic stripping voltammetry, and is discussed in the section immediately below.
Effect of the potential (Ep) on the preconcentration-stripping process
The first step for the stripping voltammetric experiment is to preconcentrate Cu(II) from the solution using the
Figure 4. Proposed surface complex structures for (a) [Cu(II)(8-HQS)2]2+, and (b) [Cu(II)(8-HQ)2]2+.
Figure 3. Formal potentials for both waves as a function of solution pH, using a BR buffer solution with various pH values.
modified electrode developed here. The preconcentration potential (Ep) at which the Cu(II) is able to electro-deposit on the electrode surface is critical.22 The effect of preconcentration potential on stripping current was optimized in order to obtain maximum sensitivity. The results shows that the sensitive, stable and repeatable stripping peak height could be reached in the potential range between –0.4 to 0.5 V.
Effect of pH on the preconcentration-stripping process
The effect of pH on the preconcentration-stripping process in a solution containing 2×10⁻⁸ mol L-1 of Cu(II) was investigated in the pH range situated between 2.0 to 6.0. The results show that the measurement sensitivity decreased with increasing solution pH. The best sensitivity is around pH 2.0. The low sensitivity at a higher pH range was probably caused by the precipitation of Cu(II) to form Cu(OH)2 on the electrode surface, which would not be stripped out easily.23
Preconcentration time (t
p) effect on the
preconcentration-stripping process
The preconcentration time is another important measurement parameter, which should be precisely controlled during the experiment. A linear relationship between the stripping current and preconcentration time in the range of 0 - 9 minutes was observed. This behavior
follows those predicted theoretically.22 However, it was observed that when the time was longer than about 9 minutes, the relationship between current and time would deviate from linearity. A possible explanation could be surface saturation, i.e., there are no anymore 8-HQS or 8-HQ molecules available to chelate Cu(II).23 A preconcentration time of 2 minutes was chosen for the following measurements.
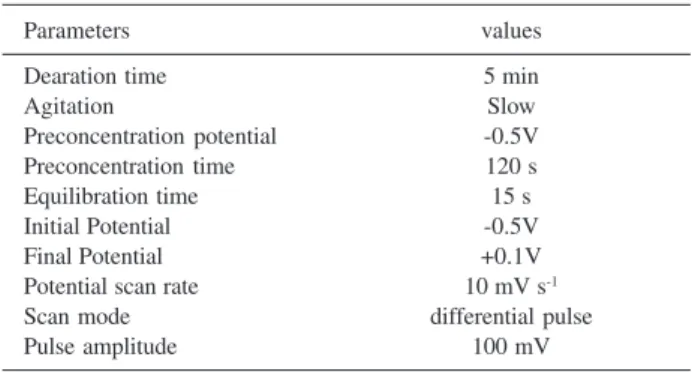
Table 1 summarizes all optimized parameters for differential pulse voltammetry instrumentation. The optimized parameter values were used in all subsequent calibration and practical measurements.
Calibration curve and detection limit
The differential pulse anodic stripping voltammograms at different Cu(II) concentrations are shown in Figure 6 (A). A linear range (1.8 x 10⁻⁸ to 5 x 10⁻⁸ mol L-1 of Cu(II)) between the peak current and Cu(II) concentration was obtained (Figure 6 (B)) for the experimental conditions described in this present work. It was observed that when the concentration was higher than 5 x 10⁻⁸ mol L-1, a deviation from linearity occurred due to the saturation of the electrode surface. The detection limit was found to be around 5.1 x 10⁻⁹ mol L-1 for preconcentration time of 2 minutes.
Interference
Any electroactive species that forms a stable complex with hydroxyquinolines might interfere with copper determination. The metal ions commonly known to form stable hydroxyquinoline complexes are copper (II), lead (II), nickel (II), cadmium (II), and molybdenium (VI).
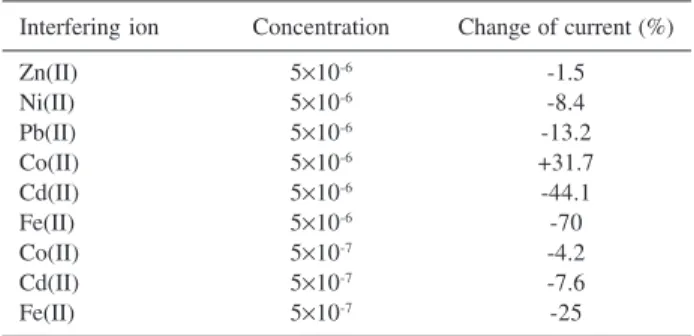
A series of experiments with various kinds of metal ions were carried out in order to determine their interference with Cu(II) measurement. The concentrations of added interfering metals were in 100-fold excess of the Cu(II) ion. The results are shown in Table 2. Significant interference could be observed from Co(II) (32%), Cd(II)
Figure 5. Cyclic voltammograms of the unmodified (a) and 8-HQS modi-fied (b) graphite electrode in the presence of 2×10⁻⁴ mol L-1 Cu(II) in the
solution (pH 2.0). Scan rate: 50 mV s-1.
Table 1. Optimized parameters for Cu(II) determination
Parameters values
Dearation time 5 min
Agitation Slow
Preconcentration potential -0.5V
Preconcentration time 120 s
Equilibration time 15 s
Initial Potential -0.5V
Final Potential +0.1V
Potential scan rate 10 mV s-1
Scan mode differential pulse
(44%) and Fe(II) (70%). It is understandable that these metal ions also have strong tendencies towards coordination with 8-QH or 8-QHS on the electrode surface. The competitive chelation of these metal ions would reduce ligand availability. However, if the concentration of these interfering ions was only 10-fold excess of Cu(II), the interference would be negligible.
In order to avoid the effect of interference on the measurement, a standard addition method was used to minimize the effect of co-resided metal ions. The experimental results showed that the standard addition method was more adequate than a simple calibration curve procedure, in such a way that some interferences were not observed.
Applications
Drinking water was sampled to demonstrate the analytical method discussed in this work. Known concentrations of Cu(II) were added to the sample in succession. Figure 7 shows an example for the process. A linear standard addition curve was obtained (Figure 7 (B)) from which the Cu(II) concentration could be determined. An intercept on the current axis could also be obtained, from which the Cu(II) concentration was calculated.
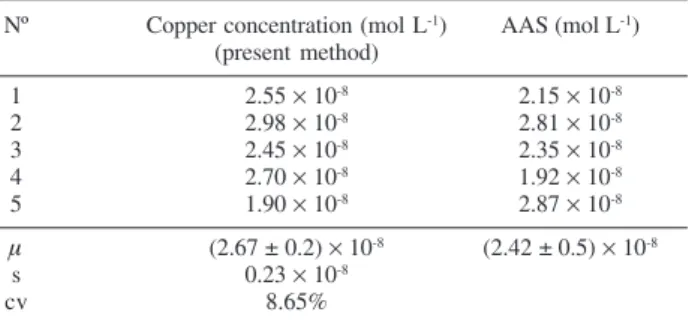
Table 3 lists the obtained results for five drinking water samples. The average Cu(II) concentration in the drinking water is (2.67 ± 0.18) × 10-8 mol L-1 with n = 5, and at a
confidence level of 95%. This result was further confirmed by another work independently24 and by atomic absorption spectrometry (AAS) in our laboratory, as shown in Table 3.
Conclusions
Chemically modified electrodes were developed using 8-HQS or 8-HQ as a surface modifier. Cyclic voltammetry was used to characterize the surface behavior of the modifiers. The modified electrode surface exhibited an affinity to chelate Cu(II) from the solution to form a surface complex, which was used for trace Cu(II) analysis. The results testify that the sensitivity of the modified electrode is more than 10 times larger than the recorded for the unmodified electrode. Differential pulse voltammetry, combined with a preconcentrating-stripping
Table 2. Change in peak current for 5×10⁻⁸ mol L-1 Cu(II) in the presence
of interfering ions (preconcentration time: 2 min)
Interfering ion Concentration Change of current (%)
Zn(II) 5×10⁻⁶ -1.5
Ni(II) 5×10⁻⁶ -8.4
Pb(II) 5×10⁻⁶ -13.2
Co(II) 5×10⁻⁶ +31.7
Cd(II) 5×10⁻⁶ -44.1
Fe(II) 5×10⁻⁶ -70
Co(II) 5×10⁻⁷ -4.2
Cd(II) 5×10⁻⁷ -7.6
Fe(II) 5×10⁻⁷ -25
Figure 6. (A) Differential pulse voltammograms of a graphite electrode modified by 8-HQS ligand, recorded in a BR buffer solution (pH 2.0) containing various Cu(II) concentrations: (a) 1.8×10⁻⁸, (b) 2×10⁻⁸, (c) 2.5×10⁻⁸, (d) 3×10⁻⁸, (e) 3.5×10⁻⁸, (f) 4×10⁻⁸, (g) 4.5×10⁻⁸ and (h) 5×10⁻⁸ mol L-1 Cu(II). The other
process and standard addition method, was used for the analysis. The measurement parameters were optimized for the analysis through several test protocols. A high sensitivity, i.e. 5.1×10⁻⁹ mol L-1 was achieved.
Five local drinking water samples were collected for the purpose of validation of the present procedure. The measured results, confirmed by another independent laboratory and by AAS, demonstrated the feasibility of the method developed in this work.
Acknowledgments
Financial support from CNPq (Conselho Nacional de Desenvolvimento Científico e Tecnológico), schoolarship from CAPES (Coordenação de Aperfeiçoamento de Pessoal
de Nível Superior) and colaboration from IFCI (Institute for Fuel Cell Innovation, National Research Council Canada) are gratefully acknowledged by the authors.
References
1. Mouchreck Filho, V. E. M.; Chierice, G. O.; Marques, A. L. B.;
Quím. Nova 1999,22, 312.
2. Murray, R.W. In Chemically Modified Electrodes in
Electroanalytical Chemistry; Bard, A. J., ed.; Marcel Dekker:
New York, 1984, p. 191.
3. Abruna, H.D.; Coord. Chem. Rev.1988, 86, 135. 4. Murray, R.W.; Acc. Chem. Res.1980, 13, 135.
5. Kutner, W.; Wang, J.; L’her, M.; Buck, R. P.; Pure Appl. Chem.
1998, 70, 1301.
6. Arrigan, D.W.; Analyst1994, 119, 1953. 7. Kalcher, K.; Electroanalysis1990, 2, 419.
8. Kalcher, K.; Kauffmann, J.M.; Wang, J.; Svancara, I.; Vytras, K.; Neuhold, C.; Yang, Z.; Electroanalysis1995 , 7, 1. 9. Cha, S. K.; Abruña, H. D.; Anal. Chem.1990, 62, 274. 10. Labuda, J.; Plaskson, V.; Anal. Chim. Acta 1990, 228, 259. 11. Marques, A. L. B.; Zhang, J.; Lever, A. B. P.; Pietro, W. J.; J.
Electroanal. Chem.1995, 392, 43.
12. Zhang, J.; Anson, F. C.; J. Electroanal. Chem.1992, 341, 323. 13. Brown, A. P.; Koval, C.; F. C. Anson; J. Electroanal. Chem.
1976, 72, 379.
Figure 7. (A) Differential pulse voltammograms of a graphite electrode coated with 8-HQS in drinking water samples (pH 2.0), obtained by standard addition method. (a) drinking water; (b) (a) + 8.5x10⁻⁹ mol L-1; (c) (a) + 2.13x10⁻⁸ mol L-1; (d) (a) + 2.55x10⁻⁸ mol L-1; (e) (a) + 3.4x10⁻⁸ mol L-1; (f) (a) + 3.83x10⁻⁸ mol L-1; (g) (a) + 4.25x10⁻⁸ mol L-1; (h) (a) + 4.68x10⁻⁸ mol L-1 of Cu(II). Other conditions as in Figure 9. (B) Analytical curve (data from (A)).
Table 3. Determination of copper in drinking water samples
Nº Copper concentration (mol L-1) AAS (mol L-1) (present method)
1 2.55 × 10⁻⁸ 2.15 × 10⁻⁸
2 2.98 × 10⁻⁸ 2.81
× 10-8
3 2.45 × 10⁻⁸ 2.35 × 10⁻⁸
4 2.70 × 10⁻⁸ 1.92
× 10-8
5 1.90 × 10⁻⁸ 2.87 × 10⁻⁸
μ (2.67 ± 0.2) × 10-8 (2.42 ± 0.5) × 10-8
s 0.23 × 10⁻⁸
14. Zhang, J.; Anson, F. C.; Electrochim. Acta 1993, 38, 2423. 15. Zhang, J.; Anson, F. C.; J. Electroanal. Chem.1992, 331, 945. 16. Zhang, J.; Anson, F. C.; J. Electroanal. Chem.1993, 348, 81. 17. Zhang, J.; Lever, A. B. P.; Pietro, W. J.; Inorg. Chem.1994, 33,
1392.
18. Marques, A. L. B.; Marques, E. P.; Zhang, J.; LI, W.;
Electrochim. Acta 2004, 49, 879.
19. Marques, A. L. B.; Marques, E. P.; Dias, V. L. N.; Fernandes, E. N.; Zhang, J.; J. Power Sources 2005, 142, 10.
20. Marczenko, Z.; Spectrophotometric Determination of Elements, J & Sons Inc: New York, 1976.
21. Bard, A. J.; Faulkner, L.; Electrochemical Methods,
Fundamentals and Applications, John Wiley & Sons: New York,
1980.
22. Wang, J.; Stripping Analysis. Principles, Instrumentation and
Applications, VCH Publishers: USA, 1985.
23. Alemu, H.; Chandravanshi, B. S.; Anal. Chim. Acta1998, 368, 165.
24. Mouchrek Filho, V. E. F.; Chierice, G. O.; Marques, E. P.; Zhang, J.; Marques, A. L. B.; Electroanalysis1999, 11, 1130.