Brazilian Journal of Physics, vol. 37, no. 2C, June, 2007 705
Source Chaoticity in Relativistic Heavy Ion Collisions at SPS and RHIC
Kenji Morita1∗, Shin Muroya2, and Hiroki Nakamura1
1 Department of Physics, Waseda University, Tokyo 169-8555, Japan 2 Matsumoto University, Matsumoto 390-1295, Japan
Received on 31 October, 2006; Revised version received on 8 January, 2007; Third version on 26 February, 2007
We investigate degree of coherence of pion sources produced in relativistic heavy ion collisions using multi-particle interferometry. In order to obtain “true” chaoticity,λtruefrom two-pion correlation functions measured
in experiments, we make a correction for long-lived resonance decay contributions. Using thisλtrue and the
weight factor which are obtained from parameter fitted to two- and three-pion correlation function, we cal-culate a chaotic fractionεand the number of coherent sourcesα for different colliding energies. The result gives constraints on the source and shows an increase of the minimum number ofαwith multiplicity, although multiplicity independent chaoticity is not excluded.
Keywords: Relativistic heavy ion collisions; Pion interferometry
I. INTRODUCTION
Relativistic heavy ion collisions provide us an unique op-portunity to explore nature of hot and dense nuclear matter on the earth. In the highest energy collisions at the BNL-RHIC, it is expected that the matter created soon after the collision of two heavy nuclei can be the strongly interacting quark-gluon plasma, which gradually cools down and then becomes hadronic matter via phase transitions. To understand the na-ture of the QCD matter, it is important to know what kind of information experimental observables contain. Pion interfer-ometry has been one of the most important observables be-cause it can give us information on sizes of the source which pions come from, through the HBT effect. The HBT effect is a quantum-mechanical effect due to symmetrization of two-boson wave function and occurs if the source is not completely coherent. The strength of the two-boson momentum intensity correlation takes its maximum value in the case of the per-fectly chaotic source. Because the chaoticity can be related to the degree of thermal equilibrium and to composition of the source, analyses of the chaoticity can provide information on a state of hadronic matter which may reflect how hadrons are produced.
Experimentally measured two-pion chaoticity
λ =C2(p,p)−1 does not usually reflect real coherence of the source because of long-lived resonance decay contri-butions. Three-pion correlation function is more useful for this purpose. The three-pion correlator measured in some experiments is
r3(Q3) =
[C3(Q3)−1]−[C2(Q12)−1]−[C2(Q23)−1]−[C2(Q31)−1]
p
[C2(Q12)−1][C2(Q23)−1][C2(Q31)−1]
,
(1)
whereQi j=
p
−(pi−pj)2,Q3=
q
Q2
12+Q223+Q231, andCn denotes then-particle correlation function. The weight factor
∗Present address: Institute of Physics and Applied Physics, Yonsei University,
Seoul 120-749, Korea. Electronic address:[email protected]
ω=r3(0)/2 characterizes the degree to how pions sources are chaotic. For a completely chaotic source,ω=1. If the source chaoticity is really a physical quantity, both two- and three-pion correlation function should give quantitatively consistent value of the chaoticity. However, experimental results do not seem so, because of the apparent reduction of the λdue to long-lived resonances. But it has been shown that we can im-pose stronger constraints by using both of two- and three-pion correlation data [1].
In this work, we find that such decay contributions can be eliminated by making use of a statistical model [2] and applied it to various experimental data measured in SPS and RHIC ex-periments [3]. Then, we obtain the weight factorωfrom two-and three-pion correlation function data in these experiments. Using the resonance-correctedλwhich we call λtrue andω, we calculate a chaotic fractionεand the number of coherent sources based on a partially multicoherent source model [4]. From this result, we discuss how the structure of the sources changes from low energy collisions at SPS and higher ones at RHIC [5].
II. CORRECTION OFλFACTOR FOR LONG-LIVED
RESONANCE DECAY
In the presence of long-lived resonance decay contributions to two-pion correlation function, the two-pion chaoticity for a chaotic source is reduced as
p
λeff=1−N r
π
Nπ (2)
whereNπis the total number of pions andNπr is the number
num-706 Kenji Morita et al.
ber density,i.e.,Ni/Nj=ni/nj, whereniis given by
ni=
gi 2π2
Z ∞
0
d pp2f(E,T,µ) (3) with f(E,T,µ) being the equilibrium distribution functions [7]. Using these formulae, we calculate the λeff for S+Pb and Pb+Pb collisions at the SPS and Au+Au collisions at the RHIC and obtainλtruethrough a relationλtrue=λexp/λeff whereλexpis momentum-averaged experimental data [2, 3]. The temperature and baryonic chemical potential are deter-mined by theχ2fitting to experimental data of particle ratio. See Ref. [3] for details. Here we summarize the result in Ta-ble I.
TABLE I: Summary ofλtrue
System (T,µB)[MeV] λexp λtrue
S+Pb (NA44) (173,196) 0.59(6) 0.94(6) Pb+Pb (NA44) (161,223) 0.55(3) 0.98(3) Pb+Pb (WA98) (161,223) 0.58(4) 1.03(4) Au+Au (STAR) (158,36) 0.57(6) 0.93(8)
III. EXTRACTION OF THE WEIGHT FACTOR
In order to obtain the weight factorω, we have to extrapo-late experimentally measuredr3(Q3)[Eq. (1)] toQ3=0. Us-ing a simple source function in which instantaneous emission and spherically symmetric source are assumed, we construct the two- and the three-pion correlation functions with the for-mulae
C2(p1,p2) =1+λinv
f122 f11f22
, (4)
C3(p1,p2,p3) =1+ν
Ã
∑
(i,j)fi j2 fiifj j
+2f12f23f31 f11f22f33
!
, (5)
where fi j=1/
q
cosh(R|qi j|) is the source function andR,
λinv andνare parameters which should be determined by a simultaneousχ2fit to the two- and the three-pion correlation functions[10]. From a set of these parameters, we can calcu-lateωusing Eqs. (4),(5) and (1). The results forωare shown in Table II.
TABLE II: Results forω
S+Pb(NA44) Pb+Pb(NA44) Pb+Pb(WA98) Au+Au(STAR) ω 0.40±0.44 1.15±0.67 0.78±0.44 0.872±0.097
IV. ANALYSIS WITH THE PARTIALLY
MULTICOHERENT MODEL
From considerations in previous sections, we have obtained the two quantities,λtrueandωas experimental results. Next,
we investigate the coherence of the sources using the partially multicoherent model [4]. In this model, there are two charac-teristic parameters which are related to theλtrueandωas
λtrue= α
α+ (1−ε)2, (6)
ω=2α
2+2α(1−ε)2+3(1−ε)3(1−2ε) 2[α2+3α(1−ε)2+ (1−ε)3]
r
α+ (1−ε)2
α .
(7)
By solving the above equations with respect toεandα(this can be analytically), we can obtain allowed regions forεand
αcorresponding to the available range ofλtrueandω.
α
0.001 0.01 0.1 1 10 100
(a)
λtrue
=0.88
λtrue
=0.998
A
B
C ω=0.837
ω=-0.03
■ Best fit (a)
λtrue
=0.88
λtrue
=0.998
A
B
C ω=0.837
ω=-0.03
■ Best fit
α
0.001 0.01 0.1 1 10
(b) λtrue=0.95
ω=1.82
ω=0.48
A B
C ■ Best fit
(b) λtrue=0.95
ω=1.82
ω=0.48
A B
C ■ Best fit
α
0.001 0.01 0.1 1 10
(c)
λtrue=0.99
ω=0.64
ω=0.92
A
B
C ■ Best fit (c)
λtrue=0.99
ω=0.64
ω=0.92
A
B
C ■ Best fit
ε
α
0 0.2 0.4 0.6 0.8 1
0.001 0.01 0.1 1 10
(d)
λtrue=0.85
ω=0.775
ω=0.969
A
B C
■ Best fit
FIG. 1: Allowed region forεandα. From top to bottom, each figure (a)-(d) shows S+Pb, Pb+Pb by NA44, Pb+Pb by WA98 and Au+Au case, respectively.
The result is shown in Fig. 1. In each of figures, the light-est shade area labelled “A” and the second one labelled “B” denote the allowed regions coming fromλtrue andω, respec-tively. The darkest areas labelled “C” are overlap of area “A” and “B”, then correspond to the allowed parameter region for
Brazilian Journal of Physics, vol. 37, no. 2C, June, 2007 707
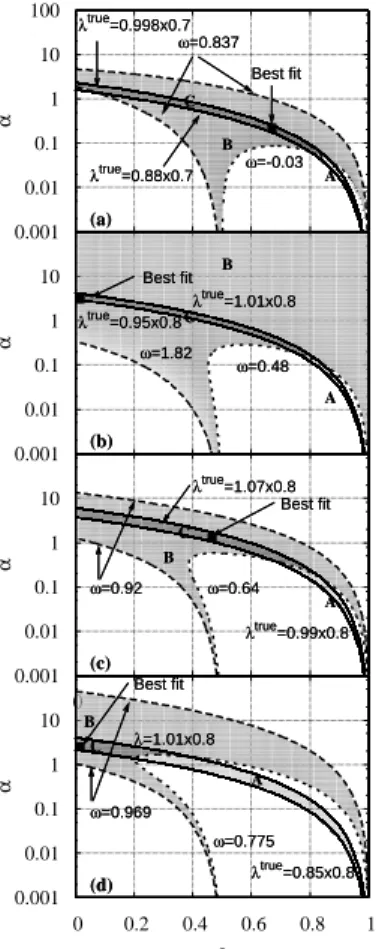
the two-pion correlation functions is over-corrected one; the values ofλexp can decrease if we take account of the partial Coulomb correction [8, 9]. Hence, if appropriate corrections were made, obtainedλtruebecomes smaller. In order to obtain a rough sketch of a tendency, we also draw the allowed regions forλtrue
pc which is 0.8 times smaller thanλtrue. For S+Pb data, we multiply the originalλtrue by factor 0.7 because Gamow (point-like source) correction is made for this data.
α
0.001 0.01 0.1 1 10 100
(a)
ω=0.837
ω=-0.03
A B
C
λtrue
=0.998x0.7
λtrue
=0.88x0.7
■
Best fit
(a)
ω=0.837
ω=-0.03
A B
C
λtrue
=0.998x0.7
λtrue
=0.88x0.7
■
Best fit
α
0.001 0.01 0.1 1 10
(b)
ω=1.82 ω=0.48 λtrue
=0.95x0.8 λtrue
=1.01x0.8
A B
C
■
Best fit
(b)
ω=1.82 ω=0.48 λtrue
=0.95x0.8 λtrue
=1.01x0.8
A B
C
■
Best fit
α
0 0.001
0.01 0.1 1 10
(c)
ω=0.64 ω=0.92
λtrue
=0.99x0.8 λtrue
=1.07x0.8
■
Best fit
A B
C
(c)
ω=0.64 ω=0.92
λtrue
=0.99x0.8 λtrue
=1.07x0.8
■
Best fit
A B
C
ε
α
0 0.2 0.4 0.6 0.8 1 0.001
0.01 0.1 1 10
(d)
ω=0.775 ω=0.969
A B
C
λtrue
=0.85x0.8 λ=1.01x0.8
■
Best fit
(d)
ω=0.775 ω=0.969
A B
C
λtrue
=0.85x0.8 λ=1.01x0.8
■
Best fit
FIG. 2: Allowed region forεandα, in the case of usingλtrue pc . From
top to bottom, each figure (a)-(d) shows S+Pb, Pb+Pb by NA44, Pb+Pb by WA98 and Au+Au case, respectively.
From Fig. 2, we can see that all allowed regions (the darkest shaded areas) are narrow but there seem to exist systematics. The best fit point seems to move upper left (small chaotic
frac-tion and large number of coherent sources) side, except for the NA44 Pb+Pb result. Most important feature of this result is that the upper limit ofεand lower limit ofαare determined by the lower limit ofω. We plot the maximum and the min-imum values ofαin Fig. 3. The clear increase of minimum number of the coherent sources can be seen as a function of multiplicity while maximum number of those shows no such clear tendency.
In summary, we have given an analysis of the degree how chaotic the pion sources are in relativistic heavy ion collisions at the SPS and the RHIC. The analysis can be done by using both two-pion correlations and three-pion correlations. We find that the correction for long-lived resonance decay contri-butions to the two-pion correlation function can be subtracted
0.01 0.1 1 10 100
0 100 200 300 400 500 600
α
Multiplicity dNch/dη S+Pb Pb+Pb
NA44 WA98
Au+Au αmin
αmax
FIG. 3: Maximum and minimum values ofαas a function of multi-plicity. For Pb+Pb data, both plots are slightly shifted along horizon-tal axis for a clear comparison of the results.
with the help of the statistical model. From a point of view in which multicoherent sources and a background chaotic source are produced, we show that the model gives constraints on the structure of the source. Although the maximum number of the coherent sources does not show a clear multiplicity de-pendence, the minimum number of coherent source increases as the multiplicity increases.
Acknowledgements
The authors would like to thank Prof. I. Ohba and Prof. H. Nakazato for their encourgement. K. M’s work is supported by a Grant for the 21st Century COE Program at Waseda University from Ministry of Education, Culture, Sports, Science and Technology of Japan and BK21 (Brain Korea 21) program of the Korean Ministry of Education.
[1] H. Nakamura and R. Seki, Phys. Rev. C66, 027901 (2002). [2] K. Morita, S. Muroya, and H. Nakamura, Prog. Theor.
Phys.114, 583 (2005).
[3] K. Morita, S. Muroya, and H. Nakamura, Prog. Theor. Phys.116, 329 (2006). See also references therein.
[4] H. Nakamura and R. Seki, Phys. Rev. C61, 054905 (2000). [5] Because of space limitation, here we only show result for the
partially multicoherent source model though we also analyzed the data with partial coherent model and multicoherent model in Refs.[2] and [3].
[6] T. Cs¨org˝o, B. L¨orstad, and J. Zim´anyi, Z. Phys. C 71, 491 (1996).
[7] J. Cleymans and K. Redlich, Phys. Rev. C60, 054908 (1999). [8] D. Adamov´a et al. (CERES Collaboration), Nucl. Phys. A714,
124 (2003).
[9] S. S. Adler et al. (PHENIX Collaboration), Phys. Rev. Lett.93, 152302 (2004).
![TABLE I: Summary of λ true System (T ,µ B )[MeV] λ exp λ true S+Pb (NA44) (173,196) 0.59(6) 0.94(6) Pb+Pb (NA44) (161,223) 0.55(3) 0.98(3) Pb+Pb (WA98) (161,223) 0.58(4) 1.03(4) Au+Au (STAR) (158,36) 0.57(6) 0.93(8)](https://thumb-eu.123doks.com/thumbv2/123dok_br/18982474.457551/2.892.559.749.320.809/table-summary-true-system-mev-exp-true-star.webp)