Standardized catch rate of cockish,
Callorhinchus callorynchus
, in a bottom
trawl ishery of Patagonia: Is it possible its use as a predictor of abundance trend?
The catch per unit of effort (CPUE) data of cockish,
Callorhinchus callorynchus
, during 1986-2011
was evaluated for the bottom trawl ishery of
the San Matías gulf (Patagonia, Argentina). The
objective of this work was to detect what are the
factors related to ishery dynamic that affect catch
rate of cockish and to assess standardized CPUE
by General linear models (GLMs) and General
linear mixed models (GLMMs) as a relative
abundance index. The annual trend of the catch rate
indicated an increase during the evaluated period.
The nominal CPUE and the indices standardized
by the Delta-GLM and Delta-GLMM showed the
same annual trend, with increases of 57%, 61.1%
and 60.7%, respectively. The LogNormal models
have the best-it model and explained 23.5% of
the total variability. The factors year, month,
depth and hake CPUE explained the highest
variability. The analysis of the models indicated
that the catch rate of cockish is subject to the
lack of an homogeneous distribution of the ishing
effort during different years, months and vessels.
This was related to the leet dynamic searching the
targets species. The increasing trend of CPUE and
landings would be indicating an increase in effort
directionality to the cockish in the last decade.
A
bstrAct
Juan F. Bernasconi, María Raquel Perier, Edgardo E. Di Giácomo
Grupo de Estudio de Peces Cartilaginosos (CONDROS), Instituto de Biología Marina y Pesquera "Alte. Storni". (Güemes 1030, zip: 8520, San Antonio Oeste, Rio Negro, Argentina, Tel: (54) 02934-430764)
*Corresponding author: [email protected]
Descriptors:
Standardized CPUE, Holocephali,
Chon-drichtyans bycatch, GLM, GLMM, Chimaeroids.
Dados de captura por unidade de esforço (CPUE)
do peixe-galo
Callorhinchus callorynchus
foram
avaliados para a pesca de arrasto de fundo no Golfo
de San Matías (Patagonia, Argentina), durante o
período 1986-2011. Os objetivos do trabalho foram
identiicar quais os fatores relacionados à dinâmica
pesqueira que afetam a taxa de captura do peixe-galo
e veriicar a viabilidade em utilizar dados de CPUEs
padronizadas pelos Modelos Lineares Gerais (GLM)
e Modelos Lineares Gerais Mistos (GLMMs) como
índices de abundância relativa. A tendência anual
da taxa de captura indicou um aumento durante o
período avaliado. A CPUE nominal e os índices
padronizados pelo Delta-GLM e Delta-GLMM
apresentaram a mesma tendência anual, com
aumentos de 57%, 61.1% e 60.7%, respectivamente.
Os modelos LogNormal foram os de melhor ajuste e
explicaram 23,5% da variabilidade total dos dados.
Ano, mês, profundidade e “
hake
” CPUE foram os
fatores mais explicativos. A análise dos modelos
indicou que a taxa de captura do peixe-galo está
ligada à falta de distribuição homogênea do esforço
de pesca durante os diferentes anos, meses e navios.
Este fato esteve relacionado à dinâmica das frotas
na busca das espécies alvo. A tendência crescente
no aumento das CPUE e descargas em terra
estaria indicando a mudança do esforço de pesca
direcionado ao peixe-galo na última década.
r
esumo
Descritores:
CPUE padronizadas, Holocephali,
Captura acessória de condrictes, GLM, GLMM,
Chimeroides.
INTRODUCTION
The classiication of chondrichthyans (sharks, batoids and chimaeras) as vulnerable species to ishing exploitation has generated worldwide concern about their populations status (HOLDEN, 1973; HOENING Y GRUBER, 1990; STEVENS et al., 2000). A declining abundance trend of chon-drichthyan populations has been documented in several ishe-ries (MIRANDA and VOOREN, 2003; BAUM and MYERS, 2004; CAMHI et al., 2008; BAUM and BLANCHARD, 2010; FERRETTI et al., 2013), and particular cases of local
extinctions have been recorded (BRANDER, 1981; CASEY and MYERS, 1998; DULVY et al., 2000; VOOREN and KLIPPEL, 2005). Their life-history characteristics (slow gro-wth, late sexual maturity, low fecundity and high longevity) associated with increased catches in the recent years are the principal causes of their vulnerability. However, chondri-chthyan species and their populations have different degre-es of vulnerability due to their different spatial distribution during different ontogenetic stages, the current commercial interest and the particular characteristics of each ishery. In this sense, stability of chondrichthyan populations that are commercially harvested has been documented in some oc-casions (WALKER, 1998; MINISTRY FOR PRIMARY INDUSTRIES OF NEW ZEALAND, 2011; BARNETT et al., 2012; CARLSON et al., 2012).
Quantiication of the impacts of ishery exploitation and abundance estimation of ish stocks are two of the prin-cipal goals of ishery assessment, that allow to implement conservation and management measures. In the majority of isheries, the most common source of information to in-fer the population abundance trend is the catch per unit of effort (CPUE) from commercial isheries (HILBORN and WALTERS, 1992; MAUNDER and PUNT, 2004). However, the nominal CPUE is seldom proportional to stock abundan-ce over their whole history of exploitation and their entire geographic range, particularly for non-target species, because several factors affect catch rates (MAUNDER et al., 2006). Therefore, standardization of CPUE considering the effect of these factors and the particular dynamic of each ishery and each species (PUNT et al, 2000; MAUNDER et al., 2006; BRACCINI et al, 2011) is necessary to construct re-liable abundance indices (HILBORN and WALTERS, 1992, MAUNDER and PUNT, 2004). The studies about the abun-dance trends of chondrichthyans that are caught as bycatch and the factors that inluence their catch rate have been in-creased worldwide both in multispecies and monospecies i-sheries (PUNT et al. 2000; SIMPFENDORFER et al., 2002; BAUM et al., 2003; AIRES da SILVA et al., 2008; BAUM
and BLANCHARD, 2010; CARVALHO et al., 2010; BRACCINI et al., 2011; BARNETT et al., 2012; CARLSON et al., 2012; BROMHEAD et al., 2012, TRAVASSSOS TOLLOTTI et al., 2013).
Chimaeroids (subclass Holocephali), are a group of chondrichthyan that include species caught as bycatch in several worldwide isheries whose target species are bony ishes (DI GIÁCOMO and PERIER, 1991; MOURA et al., 2004; MINISTRY FOR PRIMARY INDUSTRIES OF NEW ZEALAND, 2011; BARNETT et al., 2012). Particularly, the species of the genus Callorhinchus are
captured and commercially exploited in all their distri-bution range in the south hemisphere: the elephant ish
C. milii in New Zealand (FRANCIS, 1998) and Australia
(BRACCINI et al., 2011), the St Joseph C. capensis in
South Africa (FREER and GRIFFITHS, 1993) and the co-ckish C. callorynchus in Argentina (DI GIÁCOMO and
PERIER, 1991) and Chile (ALARCÓN et al., 2011).
The abundace trend of C. milii has been evaluated in
Australia and New Zealand. In 1986, the C. milii stocks of
New Zealand were declared overexploited, but then they showed recovery signs up to reach historic landing volu-mes, reaching the maximum landings of 1,300-1,400 tons approximately between 2007-2010 (FRANCIS, 1998; MINISTRY FOR PRIMARY INDUSTRIES OF NEW ZEALAND, 2011). In Australia, BRACCINI et al. (2011) evaluated the use of the standardized CPUE as an index of relative abundance for C. milii, and unlike the New
Zealand case, they detected a decreasing tendency during the study period from 1976 to 2006.
C. callorynchus is distributed from Sao Paulo state,
Brazil (FIGUEIREDO, 1977), to Beagle Channel (LÓPEZ et al., 2000) along the Atlantic Ocean. In Argentina, the cockish landings represent the 97% of the total Southwestern Atlantic catches, out of which 32% are lan-ded in the port of San Antonio Oeste (40º 48’S - 64º 52’W) (SANCHEZ et al., 2012). There has been an increase in Argentinean landings from 1992 to 2011. The lowest lan-ding was 490 tons recorded in 1992, the highest one was 2,780 tons in 2009 and the annual average for the whole period was 1,600 tons (SÁNCHEZ et al, 2012).
Figure 1. Geographical localization of the study area: San Matías Gulf, Argentina.
Figure 2. Commercials landings of cockish, common hake and silver warehou in the San Matías Gulf, 1986-2011.
the SMG waters since 1971 (DI GIÁCOMO and PERIER, 1992), which operates in the port of San Antonio Oeste. The target species of this ishery is the common hake,
Merluccius hubbsi, and 18 chondrichthyan species are
fre-quently caught as bycatch, being the cockish, C. calloryn-chus, the most caught and landed cartilaginous ish
(PERIER et al., 2011). During most of the ishery history, the cockish was the second species that contributes the most to the caught volumes (DI GIÁCOMO and PERIER, 1991). The ishery management is considered as monos-peciic because it is only performed based on the target species. The cockish’s biological characteristics and its distribution have been studied extensively in the SMG (DI GIÁCOMO, 1992; DI GIÁCOMO and PERIER, 1994; DI GIÁCOMO et al., 1994; DI GIÁCOMO and PERIER, 1996). The cockish’s biomass and commercial exploita-tion have also been evaluated from the beginning of the ishery until 1986, and the species was considered unde-rexploited due to its low incidence in the total catches of the leet (DI GIÁCOMO and PERIER, 1991). However, this pattern might have changed due to the current trend of increase of chondrichthyan catches in Argentina. In this context, even though the last SMG ishery period (1999-2011) has been characterized by the addition of the silver warehou (Seriolella porosa) as a seasonal target
spe-cies (PERIER and DI GIÁCOMO, 2002; ROMERO et al., 2013), the catch levels of C. callorynchus have reached
the highest historic values in terms of landing volumes (MILLAN, 2011; SÁNCHEZ et al., 2012) (Figure 2).
There is not information about time series of abun-dance from ishery-independent data for C. callorynchus,
except for an isolated abundance estimation in 1986 (DI GIÁCOMO and PERIER, 1991). Therefore, assess-ments of population trend must be solely based on CPUE ishery-dependent data. With this aim, studies that conirm the validity of using the standardized CPUE as an index of relative abundance trend are needed. The objective of this work is to detect what are the factors related to ishery dynamic that affect catch rates of cockish and assess the use of standardized CPUE as a relative abundance index for this species during 1986-2011.
MATERIAL AND METHODS
D
atasOurcestrips with erroneous data and vessels with less than ive trips were removed. The nominal CPUE was calculated as declared cockish kilograms per effective ishing hours for each vessel on each ishing trip.
P
rOPOseDstatisticalmODelsVarious methods have been developed to standardize CPUE in different isheries. However, the most common method is the use of Generalized Linear Models (GLM) (MAUNDER and PUNT, 2004) and recent applications for sharks have included extensions of Generalized Linear Mixed Models (GLMM) (BAUM and BLANCHARD, 2010; BRACCINI et al., 2011). These models allow to estimate the catch rate (response variable) with a linear combination of a set of explanatory variables.
Non-target CPUE data are often characterized by a high proportion of zero catches and left-skewed distribu-tions (ORTIZ and AROCHA, 2004). In this study, there was a left-skewed distribution and the proportion with ze-ro catches of cockish was of 16% (1480 trips). Therefore, a two part Delta-model was used (VIGNAUX, 1994). This method is convenient because it calculates separately the probability of a non-zero observations, the CPUE for the non-zero data and them combines the two to estima-te the annual CPUE trend. The delta-approach has been described extensively in other papers (LO et al., 1992; MAUNDER and PUNT, 2004; ORTIZ and AROCHA, 2004). Indices of annual abundance were estimated by modelling the probability of the nonzero catch assuming a model with a binomial error distribution and a logit link. The distribution of the positive cockish catches was eva-luated by examining the appropriateness of the distribu-tion assumed for errors. Generally, in isheries research, if the catch rate data are characterized by highly skewed positive observations, the most frequently assumed distri-butions are LogNormal and Gamma (PUNT et al., 2000; BRYNJARSDÓTTIR and STEFÁNSSON, 2004; ORTIZ and AROCHA, 2004; DICK, 2004). Thus, GLMs using these two error structures were examined for the positive data set: (1) a LogNormal model in which the logarithm of the positive catch rate (logCPUE) is assumed to be normally distributed and an identity link function is used (GAVARIS, 1980); and (2) a Gamma model in which the dependent variable (CPUE) is gamma distributed and a log link function is used.
GLMMs are an extension of the GLMs used to model ishery catch rates, which allow the analysis of correlated response data (VENABLES and DICHMONT, 2004). First,
the standardized catch rate was evaluated with the error structure and the ixed effects selected for the GLM. Then, the same error structure and ixed effects were used in a GLMM using the method of residual maximum likelihood (REML). In this model, individual vessels were treated as a random effect because the ishing trips made by the same vessel can be thought of as repeated measures in a longitu-dinal analysis (BAUM and BLANCHARD, 2010).
e
valuateDfactOrsFactors that most likely inluence catch rate were eva-luated in a forward stepwise fashion following ORTIZ and AROCHA (2004). First, a null model with no factors en-tered into the model was run. Models were then it in a stepwise forward manner adding one independent variable each time. Each factor was ranked from greatest to least reduction in deviance per degree freedom when compared to the null model. The factor with the greatest reduction in deviance was then incorporated into the model provided that the effect was signiicant at p < 0.05 based on a χ2 test,
and the deviance per d.f. was reduced by at least 1% from the less complex model (ORTIZ and AROCHA, 2004).
The linear predictor was constructed by examining all the explanatory variables available in the data sources (logbooks and vessels register) (Table 1). Data related to vessel characteristics (engine power, length, GRT) were evaluated as independent ixed factors. Collinearity of explanatory variables was evaluated using the statistical software R with the function vif of the package car(FOX
and WEISBERG, 2011) to avoid its inclusion in the mo-del (MAUNDER and PUNT, 2004). As all the technical vessel characteristics had a clear pattern of correlation among each other (vif value > 5), they were excluded
from the analysis. Only the vessel length factor was in-cluded in the models since it explained the highest per-centage of deviance.
Table 1. Evaluated explicatory variables hypothesized to affect catch rates of Cockish in the SMG bottom trawl ishery of the northern Patagonia.
Explanatory variable Type Levels Description Year Categorical 26 1986-2011
Month Categorical 12 From January to December
Depth Categorical 4 Maximal depth categories of trawl during the ishing trips(50-90 m; 91-130 m; 131-165 m; > a 165 m).
Vessel name Categorical(random effect) 84 Bottom trawl vessel with more than ive ishing trips.
Vessel length Categorical 6 Vessel length ranges (< a 16 m; 16-20 m; 21-25 m; 26-30 m;31-35 m; > a 36 m).
Vessel HP Categorical 6 Vessel engine power range in HP (< a 300 HP; 300-360 HP; 361-399 HP; 400-460 HP; 461-600 HP; > a 600 HP).
Vessel GRT Categorical 11 Gross register tonnage range GRT (< a 25; 25-40; 41-50; 51-60; 61-70; 71-80; 81-90; 91-100; 101-110; 111-120; > a 120).
% of Operability Categorical 6 Operability percentage ranges during 1986-2011(< a 1%; 1-4%; 4.1-10%; 10.1-20%; 20.1-50%; > al 50%).
Permanence Categorical 4 Numbers of consecutive or alternated ishing trimesters for each vessel during 1986-2011 (1 a 3, 4 a 12; 12 a 24; > de 24 trimesters).
Catch rate of common hake
(target species) Categorical 6 Catch rate ranges of common hake (0-250 kg/hs; 251-500 kg/hs;251-500 kg/hs; 501-750 kg/hs; 751-1000 kg/hs; > 1000 kg/hs) Catch rate of silver warehou
(seasonal target species during 2000-2011) Categorical 7 Catch rate ranges of silver warehou (0 kg/hs; 1-250 kg/hs; 251-500 kg/hs; 251-500 kg/hs; 501-750 kg/hs; 751-1000 kg/hs; > 1000 kg/hs).
m
ODelselectiOnanDfitThe total deviance explained cannot be compared among models with different error distributions because the formulation of the deviance is a function of the er-ror distribution. Therefore, the total deviance explained should be interpreted only as an indicator of the good-ness of a it between the observed data and the assumed model, and not as the basis for selecting a particular er-ror distribution (MCCULLAGH and NELDER, 1989). Appropriate it and diagnostics residuals plots were eva-luated to check the underlying assumptions on the error distribution and select the inal GLM (MCCULLAGH and NELDER, 1989; MAUNDER and PUNT, 2004; ORTIZ and AROCHA, 2004). Also, the AKAIKE information cri-teria (AIC) (AKAIKE, 1973) was used to select the inal model following DICK (2004). Finally, a likelihood ratio test was made to evaluate signiicant differences between the GLM and the GLMM with the vessel factor as random effect (CRAWLEY, 2007; ZUUR et al., 2009). All statisti-cal analyses were conducted using the software R, version 2.15.2 (IHAKA and GENTLEMAN, 1996) and the package nlmefor the GLMM modelling (PINHEIRO et al., 2012).
RESULTS
From a total of 9,313 ishing trips conducted between 1986 and 2011, 7,833 contained cockish catches and were
selected for further analysis of the different ishery factors on the cockish CPUE trends.
A total of 105 bottom trawl vessels operated during the study period, out of which 21 were excluded from the analysis because they conducted ive or less trips. The 84 vessels that were evaluated were characterized by: 115 to 800 HP of engine power; 12 to 39 m of length and 11 to 240 GRT. The mean number of ishing vessels over the year was 13 with a maximum of 20 vessels in 2001 and a minimum of 7 in 1990.
The leet activity indicators (vessel permanence and vessel operability factors), show that the leet behavior was unstable during 1986-2011 (Figure 3a and Figure 3b). The 94% of vessels show less of 50% of operatibility and only in 6 vessels the operatibility percentage was greater than 50% (Figure 3b). The vessel with the greatest operatibility was
B/PSiempre San Salvador due to the total effective ishing
hours (29,473 hs in 653 trips). It also had the greatest lan-dings of cockish (1,632 tons), common hake (15,788 tons) and total catches (24,752 tons). Regarding the permanence of vessels, only 12 vessels ished during more than 24 tri-mesters, out of which the vessel with the greatest operabili-ty ished during 52 continuous trimesters (Figure 3a).
Figure 3. Histograms of 105 vessels with (a) the number of ishing trimester permanence and (b) the levels of factor operability.
explained 23.5% of the total variability while the Gamma model explained 20.7% of the total variability.
The it and diagnostics residuals plots indicated that the LogNormal model is the one that best its the positive set of CPUE nominal data and thus it’s the most appropia-te to evaluaappropia-te the factors that inluence the cockish catch rate. Furthermore, the LogNormal model had a lower AIC value than the Gamma model (Table 2). In summary, all the diagnostic plots and the Akaike information criterion supported the selection of the LogNormal as the best-it model for the CPUE standardization.
All factors related with vessel characteristics were eli-minated from the analysis, except for the Length factor and % of Operability factor, which represented a 2.7% and 2.8% of the total deviance explained by the LogNormal model, respectively. These were the lowest percentages of explained deviance in comparison with the other factors included in the model. The most important factor was Year which explained 43% of the total variability, followed by the Month factor and Depth factor which explained 19%
and 18%, respectively. The factors related with the catch rate of the target species common hake and silver warehou represented 9% and 5% of the total variability explained by the model, respectively (Table 2).
The likelihood ratio test indicated signiicant differences between the models GLMM and GLM (L. Ratio = 117.74,
df = 1, p < 0.0001), being the mixed model the most
parsimonious (AIC = 10430.32). Therefore, the random factor Vessel contributed to the variability of the cockish CPUE, being different between vessels. The variance component for this random factor was 0.2758, equivalent to a coeficient of variation of 14.1% (= 0.01981/2), while the residual variance was 0.2157. All the factors evaluated in the GLMM were signiicant (p < 0.05). The residual and q-q plots for the
GLMM supported the use of the normal residual distribution on the log scale.
The standardized CPUE values and trends were similar for the Delta-GLM and Delta-GLMM with a LogNormal distribution and both models underestimated the nominal CPUE values (Figure 4). In all cases, the annual trend of the catch rate indicated an increase during the evaluated period. The nominal CPUE showed an increase of 57% from 1986 to 2011, while the indices standardized by the GLM and GLMM did not differ signiicantly from that value, with in-creases of 61.1% and 60.7%, respectively. The standardized annual catch rate showed luctuating values between the 9 and 34 kg/hs during the period 1986-1999. From the year 1999, the standardized CPUE trend showed an increase wi-th a highest value of 59 kg/hs in wi-the year 2009. The ishing effort (effective ishing hours) showed an increase of 23% from the year 1986 to 2011. The effort increased from 1988 until the late 1990’s, was highest in the 1998-2001 period, and then decreased somewhat towards the end of the study period (Figure 4).
Figure 5 shows the catch rate trend of cockish estima-ted with the Lognormal GLM and GLMM, for the main factors that explained the variability of the data set. For the Month factor, the lowest values of catch rate were estima-ted in October and November with an average of 18 kg/hs, while the highest values of catch rate were obtained during autumn and winter months and they luctuated between 34 and 42 kg/hs (Figure 5a).
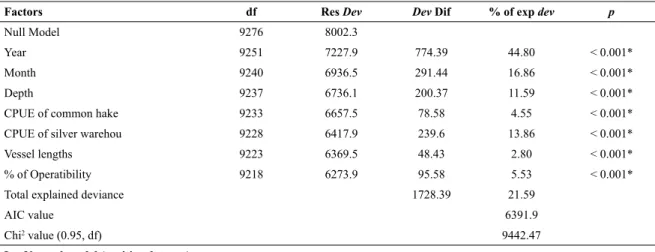
Table 2. Deviance tables of the Binomial, LogNormal (logCPUE) and Gamma (CPUE) GLMs, Signiicant factors with a % of explained deviance equal or greater than 1%; df: residual degrees of freedom; Res Dev: residual deviance; Dev Dif: deviance difference; % exp dev: percentage of deviance explained by each factor; P: p value refereed to an F probability;
* highly signiicant.
Binomial model:
Dependent variable: probability of a non-zero cockish catch; Distribution: binomial; Link function: Logit
Factors df Res Dev Dev Dif % of exp dev p
Null Model 9276 8002.3
Year 9251 7227.9 774.39 44.80 < 0.001*
Month 9240 6936.5 291.44 16.86 < 0.001*
Depth 9237 6736.1 200.37 11.59 < 0.001*
CPUE of common hake 9233 6657.5 78.58 4.55 < 0.001*
CPUE of silver warehou 9228 6417.9 239.6 13.86 < 0.001*
Vessel lengths 9223 6369.5 48.43 2.80 < 0.001*
% of Operatibility 9218 6273.9 95.58 5.53 < 0.001*
Total explained deviance 1728.39 21.59
AIC value 6391.9
Chi2 value (0.95, df) 9442.47
LogNormal model (positive data set):
Dependent variable: log(CPUE) of cockish; Distribution: normal; Link function: Identity
Factors df Res Dev Dev Dif % of exp dev p
Null Model 7838 2268.1
Year 7813 2039.6 228.54 42.90 < 0.001*
Month 7802 1936.5 103.07 19.35 < 0.001*
Depth 7799 1839.5 97.02 18.21 < 0.001*
CPUE of common hake 7795 1792.2 47.3 8.88 < 0.001*
CPUE of silver warehou 7790 1764.9 27.28 5.12 < 0.001*
Vessel lengths 7785 1750.5 14.36 2.70 < 0.001*
% of Operatibility 7780 1735.4 15.1 2.83 < 0.001*
Total explained deviance 532.67 23.49
AIC value 10546
Chi2 value (0.95, df) 7986.31
Gamma model (positive data set):
Dependent variable: CPUE of cockish; Distribution: Gamma; Link function: Log
Factors df Res Dev Dev Dif % of exp dev p
Null Model 7838 10251.4
Year 7813 9089.1 1162.32 54.78 < 0.001*
Month 7802 8770.1 319.03 15.04 < 0.001*
Depth 7799 8439.1 330.95 15.60 < 0.001*
CPUE of common hake 7795 8315.8 123.28 5.81 < 0.001*
CPUE of silver warehou 7790 8269.5 46.3 2.18 < 0.001*
Vessel lengths 7785 8185.6 83.89 3.95 < 0.001*
% of Operatibility 7780 8129.7 55.95 2.64 < 0.001*
Total explained deviance 2121.72 20.70
AIC value 74293
Figure 4. Nominal and standardized annual CPUE estimated with the Delta-GLM and Delta-GLMM, 1986-2011. The vertical bars indicated + standard deviation for GLMM (gray) and for GLM (black). The dotted line is the ishing effort in effective trawl hours.
(Figure 5c and Figure 5d). Concerning vessel characteris-tics, the catch rate did not show a clear pattern with re-gard to the Length factor, with stables values between 20 and 30 kg/h and a maximum of 70 kg/h just for the vessel length group of 31-35 m (Figure 5e). Finally, regarding vessel operability in the ishery, vessels with less than 4% of operability had the lowest catch rates, while the highest catch rate estimates correspond to vessels with the hi-ghest operatibility. However, there were a high variability, therefore, a clear pattern for the Operability factor was not observed (Figure 5f).
DISCUSSION
m
ODels
electiOnThe LogNormal distribution model was the best to evaluate the catch rate variability of cockish and the asso-ciated factors. This model registered the lowest AIC value, presented a good it of the observed data and explained a 23.5% of the total variability (Table 2). This model selec-tion agrees with other studies of chondrichthyans that are captured as bycatch which used the same error distribution for the positive data set (AIRES et al., 2008; MINISTRY FOR PRIMARY INDUSTRIES OF NEW ZEALAND, 2011; BRACCINI et al., 2011; BARNETT et al. 2012; CARLSON et al., 2012). Generally, the models used to
standardize the CPUE explained a low percentage of the total variability of the data set. A possible explanation for that is the lack of information on environmental variables or the dificulty to identify and include all of the key va-riables that affect the catch rate (PUNT et al., 2000). In this study environmental variables and information about
skipper experience, changes in the crew´s vessels or chan-ges in commercial interests were not readily available and so they were not included in the analysis.
The GLMM had the lowest AIC value and the like-lihood ratio test indicated that the random effect Vessel was signiicant, thus the observations made within the same vessel were correlated. This is because the catch and effort data of each vessel are longitudinal data, which means that several measurements are made on the same experimental units over time. In isheries science, in these cases the use of GLMMs is recommended (VENABLES and DICHMONT, 2004). Moreover, the random terms do not contribute to the ixed part of the mean, but the variance components asso-ciated with them inlate the variability of predictions in an appropriate way (VENABLES and DICHMONT, 2004; CRAWLEY, 2007). The analysis of abundance indices by GLM may underestimate the level of variability since it ig-nores the grouped nature of tows within vessels (HELSER et al., 2004; BAUM and BLANCHARD, 2010). In this stu-dy, the estimations of annual abundance indices from GLM and GLMM were similar as well as the associated variances (Figure 4). Therefore, although there is an effect of vessels in the variability of the estimates of the cockish catch rate, this would be relatively low.
Y
earfactOrRegarding to the ixed effects variability, the temporal factors Year and Month, were the main factors that explai-ned the variability of the data set. Generally, the Year factor is associated to annual luctuations of the biomass of the stocks due to annual changes in the recruitment, growth, na-tural or ishing mortality or in the distribution pattern of the resource (HILBORN and WALTERS, 1992; MAUNDER and PUNT, 2004; HERNANDEZ and PERROTTA, 2006). Annual variations of catch rate occur with any of these changes and should be relected in a high percentage of total deviance explained by the Year factor. In this study, although the Year factor had the most important contribu-tion to the explained deviance, the annual luctuacontribu-tions of the cockish CPUE estimated by the models (Figure 4) cannot be only associated to natural changes of biomass. This is because the cockish was not the target species and therefore catch rates may be inluenced by several factors related with leet behavior, market demands and abundance luctuations of target species (M. hubbsi) that conduce to
Figure 5. Nominal and standardized CPUE average for each level of the principal factors that explained the data set variability: (a) month, (b) depth, (c) CPUE common hake, (d) CPUE silver warehou, (e) vessels lenght and (f) vessels operability. The vertical bars indicated + standard deviation for GLMM (gray) and for GLM (black).
the models can be explained by the latest factors. During that year the landings of cockish had an abruptly increase of 106% with respect to the annual mean for the 2000-2011 period (Figure 1). The 60% of the total catches of cockish
an increase in the variability of the estimates since 1999. This would be relecting the variability in catch rates of co-ckish for the different ishing trips during those years. This high variability would be associated to the changes in the effort directionality of some vessels to areas where the co-ckish is more abundant and thus higher yields than the rest of leet are obtained.
D
ePthanDm
OnthfactOrsIn this study, the low percentage of the total variability explained by the models could be related to the lack of a spatial factor (ishing grounds). Although the main areas of distribution of the cockish in the SMG have been des-cribed (DI GIÁCOMO, 1992), accurate information of the ishing areas of each ishing trip was not available for this study. Such information would have allowed us to evalu-ate the overlap between the leet and the cockish distri-bution. However, other factors (Depth and Month) might be including indirectly the variability of catch rates due to the spatial scale. One of the most important factors was Depth (Table 2). In SMG the highest densities of cockish are present in the most coastal strata (between 20 and 90 m of depth), with a discontinuous distribution following the contours of the 100 m isobath (DI GIÁCOMO and PERIER, 1991; DI GIÁCOMO, 1992). In these depth stra-ta there are two imporstra-tant concentrations of this species, one in the northern part and another one in the southern part of SMG, which are associated to the availability of benthic resources (main prey of cockish) (DI GIÁCOMO 1992; Di GIÁCOMO and PERIER, 1996). This descrip-tion agrees with the estimates obtained from the models that show that the highest catch rates of cockish are in the lowest trawls depths, between 50 and 90 m (Figure 5b).
The Month factor is usually related to changes of the stocks’ abundance throughout the year (spawning aggre-gations, migrations, changes in prey availability). In this work, Month was other of the most inluential factors on catch rates (Table 2), but in this case the monthly trend of the estimated CPUE (Figure 5a) would be mostly related to the spatial dynamics of the leet according to season and the closed season implemented in the SMG, rather than to variations of the cockish abundance. Since 1997, a clo-sed season area was determined to the north of latitude 41º 30’S during October and November, with the goal of protecting the reproductive aggregations of common hake. Precisely, the lowest estimates of cockish CPUE were obtained during those months (Figure 5a) because the leet has restricted access to those areas. Therefore, this
demonstrates how a management measure for the target species would protect indirectly the cockish population, at least in the northern zone where there are the main areas of breeding, reproduction and foraging (DI GIÁCOMO, 1992, DI GIÁCOMO and PERIER, 1994).
In turn, the estimates of the monthly cockish CPUE de-monstrate that their catches are subject to the leet dynamics searching the target species. A seasonal pattern for common hake yields has been described in SMG where the highest values are present during the spring-summer months while a reduction of catch rates occur during the winter months (FLOWERS and ROA, 1975; WILLIAMS et al., 2010).
Assessments of the leet dynamics using satellital telemetry have shown that the leet spread over relatively shallow are-as in SMG during autumn and winter (WILLIAMS et al., 2010, ROMERO et al., 2013). This dispersion is due to the reduction of common hake yields which would motivate skippers to seek better catches in more coastal and shallow waters. This is in accordance with the results of this study that showed that the highest values of cockish CPUE are obtained during autumn and winter (from March to July) (Figure 5a) as a result of the overlap between the leet and the cockish distribution areas. Therefore, the high percen-tage of deviance explained by the Month factor would be related to this dynamics rather than seasonal variations of the species abundance.
c
OmmOnhakeanDsilverwarehOucPue
factOrsFigure 5c shows that the highest values of cockish CPUE are estimated for the lower levels of common hake CPUE. The relationship between this factor and the catch rate of cockish is closely related to the aforementioned explanation for the Month factor and the leet dynamics to seek the common hake. The leet has incorporated the sil-ver warehou, Seriolella porosa, as seasonal resource
do not overlap with the distribution areas of cockish. This hypothesis is supported because the leet leads its effort to the silver warehou mainly during August and September at depths greater than 100 m (PERIER and DI GIÁCOMO, 2002; ROMERO et al., 2013) where the lowest catch rate of cockish were estimated. Therefore, we may conclude that the commercial exploitation of silver warehou is not a relatively important factor for the cockish bycatch.
v
esselsl
engthsfactOrVessel Length was the factor with the highest explai-ned deviance out of all the factors related with vessel characteristics, therefore it was included in the models. However, the percentage of total deviance explained by this factor was lower than the contribution of other fac-tors (Table 2). The estimates of the cockish CPUE were similar for all levels, except for the vessel lengths between 31 and 35 m which presented an increase in the CPUE estimate with values around 70 kg/h (Figure 5e). This le-vel includes some vessels that led the effort to the con-centration areas of the cockish, thus this factor would be representing the variability in catchability of vessels due to changes in the ishing strategy.
v
esselsO
PerabilitYfactOrDI GIACOMO and PERIER (1992) analyzed the decli-ning catches of common hake in SMG ishery from 1971 to 1989 and attributed them to a decline of the leet eficiency due to instability of skippers and crews, leet deterioration and low levels of operability and permanence of vessels in the ishery. The present study evaluated the effect of so-me of those factors on the cockish catch rates, under the assumption that by affecting catch rates of common hake, they would be indirectly inluencing catch rates of cockish. Even though the histograms of operability and permanence (Figure 3) conirmed that the leet was unstable during the studied period, only the % of Operability was included in the models and it had a low contribution to the total ex-plained variability without showing a clear pattern with the cockish CPUE (Figure 5f). Therefore, we cannot assume that the variability in catch rates of cockish was due to the-se factors. Experience of the skipper and crews to handle the ishing gear and the technological equipment of vessels could be relevant factors that explain the variability in ca-tch rates (MAUNDER and PUNT, 2004; MAUNDER et al. 2006) but they could not be evaluated by the models due to the lack of information in the data set.
CONCLUSIONS
The ishery has gone through different periods sin-ce its beginning in 1971. Although common hake has been always the main commercially exploited species, the leet has diversiied its catches by incorporating other complementary resources such as hoki (Macroronus ma-gellanicus), the lounders (Paralichthys spp.), Argentine
seabass (Acanthistius patachonicus), Argentine sandperch (Pseudopercis semifasciata), Pink cusk-eel (Genypterus blacodes), smooth hound shark (Mustelus schmitti), silver warehou (Seriolella porosa) and several skate species
(fa-mily Rajidae) (PERIER and DI GIÁCOMO, 2002a, 2002b; ESTALLES et al., 2011; PERIER et al., 2011; ROMERO
et al., 2013). These variations in landings along different periods are the result of changes in the behaviour of the leet during different years and ishing seasons; thus indicating that the intensity and directionality of effort to the target species M. hubbsi and complementary species were
chan-ging throughout the ishery history.
The standardized CPUE has been extensively used as an index of relative abundance for several chondri-chthyan species caught as bycatch (PUNT et al., 2000; BAUM and BLANCHARD, 2010; CARVALHO et al., 2010; BRACCINI et al., 2011; CARLSON et al., 2012; TRAVASSOS TOLOTTI et al., 2013). However, its use must be evaluated considering the particular characteris-tics of each regional ishery. This study shows that the catch rate of cockish is subject to the leet dynamic se-arching the target species and how changes in leet beha-viour affect the cockish catches. The results allowed us to evaluate which are the factors of the ishery that affect the catch rate of cockish; however the standardized CPUE as an index of relative abundance must be used with caution. The standardization of cockish CPUE was subject to the lack of a homogeneous distribution of the ishing effort during different years, months and vessels. The increasing trend of CPUE and landings would be indicating an incre-ase in ishing power or effort directionality to the cock-ish in the last decade instead of an increase in population abundance.
Similar CPUE and landings trends have been docu-mented for a species of the same genus, C. milli of New
peaks during 2007-2010 (FRANCIS, 1998; MINISTRY FOR PRIMARY INDUSTRIES OF NEW ZEALAND, 2011). In turn, the standardized CPUE trend and biomass estimates for C. milli showed an increase in New Zealand
(MINISTRY FOR PRIMARY INDUSTRIES OF NEW ZEALAND, 2011). For C. callorynchus, it is
recommen-ded to continue monitoring the evolution of landings after the increase in recent years. Besides, it is recommended to estimate the biomass from isheries-independent surveys to evaluate if there has been a real increase in the biomass since 1986 as might be indicating the standardized CPUE calculated in this study.
Finally, it is important to improve the available informa-tion about the spatial dynamics of the leet to assess its over-lap with the distributions areas of the species. This will im-prove the estimates of the standardized CPUE in order to use it as an index of relative abundance because it would be pos-sible to establish objective criteria to select the ishing trips with directional effort to cockish from the data set (PUNT et al., 2000; BRACCINI et al., 2011).
ACKNOWLEDGEMENTS
This work was developed in the context of the Proyect UNCo SI 04/M020 “Pez gallo, tiburones y rayas del Golfo San Matías: Hacía una explotación sustentable” and the Project Agencia PICT-2011-2597 “¿Es sustentable la explo-tación pesquera de los tiburones, las rayas y el pez gallo?. El golfo San Matías como caso de estudio”. The authors would also like to acknowledge the Consejo Nacional de Investigaciones Cientíicas y Tecnológicas (CONICET) for providing a fellowship to J.F. Bernasconi and to Daniel Millan of the Dirección de Pesca de la Provincia de Rio Negro for providing ishery statistics. We also thank to Lic. Vanesa Reyes for helping us with translation of the manuscript.
REFERENCES
AKAIKE, H. Information theory as an extension of the maximum likelihood principle. In: PETROV, B.; CSAKI, F. (Eds.). Pro-ceedings of the Second International Symposium on Informa-tion Theory. Budapest: Akademiai Kiado, 1973. p. 267-281. AIRES-da SILVA, A. M.; HOEY, J. J.; GALLUCCI, V. F. A
histo-rical index of abundance for the blue shark (Prionace glauca) in the western North Atlantic. Fish. Res., v. 92, n. 1 p. 41-52, 2008.
ALARCON, C.; CUBILLOS, L. A.; ACUÑA, E. Length-ba-sed growth, maturity and natural mortality of the cockish
Callorhinchus callorhynchus (Linnaeus, 1758) off
Coquim-bo, Chile. Environ. Biol. Fish., v. 92, n. 1, p. 65-78, 2011.
BARNETT, L. A. K.; EBERT, D. A.; CAILLIET, G. M. Evidence of stability in a chondrichthyan population: case study of the spotted ratish Hydrolagus colliei (Chondrichthyes: Chimae-ridae). J. Fish Biol., v. 80, n. 5, p. 1765-1788, 2012. BAUM, J.K.; MYERS, R.A.; KEHLER, D.G.; WORM, B.;
HARLEY, S.J.; DOHERTY, P.A. Collapse and conservation of shark populations in the Northwest Atlantic. Science 299, 389-392, 2003.
BAUM, J. K.; MYERS, R. A. Shifting baselines and the decline of pelagic sharks in the Gulf of Mexico. Ecol. Lett., v. 7, n. 2, p. 135-145, 2004.
BAUM, J. K.; BLANCHARD, W. Inferring shark population trends from generalized linear mixed models of pelagic lon-gline catch and effort data. Fish. Res., v. 102, n. 3, p. 229-239, 2010.
BRACCINI, J. M.; ETIENNE, M. P.; MARTELL, S. J. D. Sub-jective judgement in data subsetting: implications for CPUE standardization and stock assessment of non-target chondri-chthyans. Mar. Fresh. Res., v. 62, n.6, p. 734-743, 2011. BRANDER, K. Disappearance of common skate Raia batis from
Irish Sea. Nature, v. 290, p. 48-49, 1981.
BROMHEAD, D.; CLARKE, S.; HOYLE, S.; MULLER, B.; SHARPLES, P.; HARLEY, S. Identiication of factors inluen-cing shark catch and mortality in the Marshall Islands tuna lon-gline ishery and management implications. J. Fish Biol., v. 80, n. 5, p. 1870-1894, 2012.
BRYNJARSDOTTIR, J.; STEFANSSON, G. Analysis of cod match data form Icelandic groundish surveys using generali-zed linear models. Fish. Res., v. 70, p. 195-208, 2004. CAMHI, M. D.; PIKITCH, E. K.; BABCOCK, E. A global
overview of commercial isheries for open ocean sharks. In: Camhi, M. D., Pikitch, E. K.; Babcock, E. A. (Eds.). Sharks of the Open Ocean: Biology, Fisheries and Conservation. Oxford: Blackwell Publishing, 2008.
CASEY, J. M.; MYERS, R. A. Near extinction of a large, widely distributed ish. Science, v. 281, n. 5377, p. 690-692, 1998. CARLSON, J. K.; HALE, L. F.; MORGAN, A.; BURGESS, G.
Relative abundance and size of coastal sharks derived from commercial shark longline catch and effort data. J. Fish Biol., v. 80, n. 5, p. 1749-1764, 2012.
CARVALHO, F. C.; MURIE D. J.; HAZIN, F. H.; HAZIN, H. G., LEITE-MOURATO, B.; TRAVASSOS, P.; BURGESS, G. H. Catch rates and size composition of blue sharks (Prionace glauca) caught by the Brazilian pelagic longline leet in the southwestern Atlantic Ocean. Aquat. Living Resour., v. 23, p. 373-385, 2010.
CRAWLEY, M. J. The R book. (Ed.). Chichester: John Wiley and Sons, 2007. 942 p.
DICK, E. J. Beyond ‘lognormal versus gamma’: discrimination among error distributions for generalized linear models. Fish. Res., v. 70, n. 2, p. 351-366, 2004.
DI GIÁCOMO, E. E.; PERIER, M. R. Evaluación de la bio-masa y explotación comercial del pez gallo (Callorhynchus callorhynchus) en el Golfo de San Matías, Argentina. Frente
Marítimo, v. 9, n. A, p. 7-13, 1991.
DI GIÁCOMO, E. E. Distribución de la población del pez gallo (Callorhynchus callorhynchus) en el Golfo de San Matías,
DI GIÁCOMO, E. E.; PERIER, M. R. Retracción de la pesquería demersal del golfo San Matías: escasez de recursos o dismi-nución de la eiciencia? Frente Marítimo, v. 11, p. 7-13, 1992. DI GIÁCOMO, E. E., CALVO, J.; PERIER, M. R.; MORRICO-NI, E. R. Spawning aggregations of Merluccius hubbsi, in
patagonian waters: evidence for a single stock. Fish. Res., v. 16, n. 1, p. 9-16, 1993.
DI GIÁCOMO, E. E.; PERIER, M. R. Reproductive biology of the cockish, Callorhynchus callorhynchus (Holocephali:
Callorhynchidae), in Patagonian waters (Argentina). Fish. Bull., v. 92, p. 531-539, 1994.
DI GIÁCOMO, E. E.; PARMA, A. M., ORENSANZ, J. M. Food consumption by the cock ish, Callorhinchus callorynchus
(Holocephali: Callorhynchidae), from Patagonia (Argentina). Environ. Biol. Fishes., v. 40, p. 199-211, 1994.
DI GIACOMO, E. E.; PERIER, M. R. Feeding habits of cockish,
Callorhinchus callorhynchus in patagonian Waters,
Argenti-na. Mar. Fresh. Res., v. 47, p. 801-8, 1996.
DULVY, N. K.; METCALFE, J. D.; GLANVILLE, J.; PAWSON, M. K., REYNOLDS, J. D. Fishery stability, local extinctions, and shifts in community structure in skates. Conserv. Biol., v. 14, n. 1, p. 283-293, 2000.
Estalles, M.; Coller N. M.,; Perier, M. R.; Di Giácomo, E. E. Ska-tes in the demersal trawl ishery of San Matías Gulf, Pata-gonia: species composition, relative abundance and maturity stages. Aquat. Living Resour., v 24, p. 193-199, 2011. FERRETTI, F.; OSIO, G. C.; JENKINS, C. J.; ROSENBERG,
A. A.; LOTZE, H. K. Long-term change in a meso-predator community in response to prolonged and heterogeneous hu-man impact. Sci. Rep., v. 3, p. 1057, 2013.
FIGUEIREDO, J. L. Manual de peixes marinhos do Sudeste do Brasil. Introdução. Cações, raias e quimeras. São Paulo: Mu-seu de Zoologia, University of São Paulo, 1977. 104 p. FLOWERS, J.; ROA, H. Report on investigation in the Gulf of
San Matías and the Gulf of San Jorge. FAO Report FI:DP: Arg.65, 510/3, 1975. 64 p.
FRANCIS, M. P. Spatial and temporal variation in the growth rate of elephantish (Callorhinchus milii). N.Z. J. Mar. Freshw.
Res., v. 31, n. 1, p. 9-23, 1997.
FRANCIS, M. P. New Zealand shark isheries: development, size and management. Mar. Freshw. Res., v. 49, n. 7, p. 579-591, 1998. FREER, D. W. L.; GRIFFITHS, C. L. Estimation of age and
growth in the St. Joseph Callorhinchus capensis (Dumeril).
So. Afr. J. Mar. Sci., v. 13, n. 1, p. 75-82, 1993.
FOX, J.; WEISBERG, S. An R Companion to Applied Regres-sion. 2. ed. Thousand Oaks: Sage, 2011. 472 p.
GAVARIS, S. Use of a multiplicative model to estimate catch rate and effort from commercial data. Can. J. Fish. Aquat. Sci., v. 37, p. 2272-2275, 1980.
GAGLIARDINI, D. A., RIVAS, A. L. Environmental characte-ristics of San Matías Gulf obtained from LANDSAT-TM and ETM+ DATA. Gayana, v. 68, n. 2, p. 186-193, 2004. HELSER, T. E.; PUNT, A. E.; METHOT, R. D. A generalized
linear mixed model analysis of a multi-vessel ishery resource survey. Fish. Res., v. 70, n. 2, p. 251-264, 2004.
HERNANDEZ, D. R.; PERROTTA, R. G. Inluencia de las Inte-racciones con el factor año en los índices anuales de abundan-cia obtenidos por modelos lineales generales utilizando datos de captura por unidad de esfuerzo. Rev. Invest. Pesq., v. 18, p. 57-73, 2006.
HILBORN, R.; WALTERS, C. J. (Eds.). Quantitative Fisheries Stock Assessment: Choice, Dynamics and Uncertainty. New York: Chapman and Hall, 1992. p. 570.
HOENING, J. M.; GRUBER, S. H. Life-history patterns in the elasmobranchs: implications for isheries management. In: PRATT, H. L.; GRUBER, S. H.; TANIUCHI, T. (Eds.), Elas-mobranchs as living resources: advances in the biology, eco-logy, systematics and the status of the isheries. U. S. Dep. Commer., NOAA Tech. Rep. NMFS 90, 1990. p. 1-16. HOLDEN, M. J. Are long-term sustainable isheries for
elasmo-branches possible? J. Reun. Cont. Int. Explor. Mer., v. 164, p. 360-370, 1973.
IHAKA, R.; GENTLEMAN, R. R: a language for data analysis and graphics. J. Comput. Graph. Stat., v. 5, p. 299-314, 1996. MAUNDER, M.; PUNT, A. Standardizing catch and effort data: a
review of recent approaches. Fish. Res., v. 70, p. 141-159, 2004. MAUNDER, M. N.; SIBERT, J. R.; FONTENEAU, A.; HAMP-TON, J.; KLEIBER, P.; HARLEY, S. J. Interpreting catch per unit effort data to assess the status of individual stocks and communities. ICES J. Mar. Sci., v. 63, n. 8, p. 1373-1385, 2006. MC CULLAGH, P.; NELDER, J. A. Generalized Linear Models.
2. ed. New York: Chapman & Hall, 1989. 511 p.
MILLAN, D. Anuario de Estadísticas Pesqueras de la Provincia de Río Negro. Departamento Policía de Pesca, Dirección de Pesca, San Antonio Oeste, 2011.
MINAMI, M.; LENNERT-CODY, C. E.; GAO, W.; ROMAN--VERDESOTO, M. Modeling shark bycatch: the zero-inla-ted negative binomial regression model with smoothing. Fish. Res., v. 84, n. 2, p. 210-221, 2007.
MINISTRY FOR PRIMARY INDUSTRIES OF NEW ZEA-LAND. Report from the Fisheries Assessment Plenary, May 2011: stock assessments and yield estimates. Wellington, 2011. p. 196-215.
MIRANDA, L. V.; VOOREN, C. M. Captura e esforço da pesca de elasmobrânquios demersais no sul do Brasil nos anos de 1975 a 1997. Frente Marítimo, v. 19, n. B, p. 217-231, 2003. MOURA, T.; FIGUEIREDO, I.; MACHADO, P. B.; SERRANO
GORDO, L. Growth pattern and reproductive strategy of the holocephalan Chimaera monstrosa along the Portuguese
con-tinental slope. J. Mar. Biol. Ass. U.K., v. 84, n. 4, p. 801-804, 2004.
LO, N. C.; JACOBSON, L. D.; SQUIRE, J. L. Indices of relati-ve abundace from ish spotter data based on delta lognormal models. Can. J. Fish. Aquat. Sci., v. 49, p. 2515-2516, 1992. LÓPEZ, H. L.; SAN ROMÁN, N. A.; DI GIÁCOMO, E. E. On
the South Atlantic distribution of Callorhinchus callrhynchus
(Holocephali: Callorhynchidae). J. Appl. Ichthyol., v. 16, p. 39, 2000.
ORTIZ, M.; AROCHA, F. Alternative error distribution models for standardization of catch rates of non-target species from a pe-lagic longline ishery: billish species in the Venezuelan tuna longline ishery. Fish. Res., v. 70, n. 2/3, p. 275-294, 2004. PERIER, M. R.; DI GIACOMO, E. E. El Savorín Seriolella porosa
como un recurso estacional en el Golfo San Matías, República Argentina. Rev. Inves. Desar. Pesq., v. 15, p. 15- 26, 2002a. PERIER, M. R.; DI GIACOMO, E. E. Distribución, abundancia
y reproducción de Paralichthys isosceles, P. patagonicus y Xistrerus rasile (Pleuronectiformes: Bothidae) en aguas
PERIER, M. R.; ESTALLES, M.; COLLER, N. M.; SUAREZ, M. N.; MORA, G. J.; DI GIACOMO, E. E. Chondrichthyans of the San Matías Gulf, Patagonia, Argentina. Rev. Mus. Ar-gentino Cienc. Nat., v. 13, n. 2, p. 213-220, 2011.
PINHEIRO, J.; BATES, D.; DEBROY, S.; SARKAR, D. The R Development Core Team. nlme: Linear and Nonlinear Mixed Effects Models. R package version 3. p. 1-105, 2012. PUNT, A. E.; WALKER, T. I.; TAYLOR, B. L., PRIBAC, F.
Stan-dardization of catch and effort data in a spatially-structured shark ishery. Fish. Res., v. 45, n. 2, p. 129-145, 2000. RIVAS, A. L.; BEIER, E. J. Temperature and salinity ields in the
Northpatagonic Gulfs. Oceanol. Acta, v. 13, n. 1, p. 15-20, 1990. ROMERO, M. E.; OCAMPO, R. M., WILLIAMS, G.; NARVAR-TE, M.; GAGLIARDINI, D. A.; GONZALEZ, R. Understan-ding the dynamics of an enclosed trawl demersal ishery in Patagonia (Argentina): A holistic approach combining multi-ple data sources. Fish. Res., v. 140, p. 73-82, 2013.
SANCHEZ, R. P.; NAVARRO, G.; ROZYCKI, V. Estadísticas de la Pesca Marina en la Argentina. Evolución de los desem-barques 1898-2010. Ministerio de Agricultura, Ganadería y Pesca de la Nación. Buenos Aires, 2012. 528 p.
SIMPFENDORFER, C. A.; HUETER, R. E.; BERGMAN, U.; CONNETT, S. M. H. Results of a ishery-independent survey for pelagic charks in the western North Atlantic, 1977-1994. Fish. Res., v. 55, p. 175-192, 2002.
STEVENS, J. D.; BONFIL, R.; DULVY, N. K.; WALKER, P. A. The effects of ishing on sharks, rays and chimaeras (chondri-chthyans), and the implications for marine ecosystems. ICES J. Mar. Sci., v. 57, n. 3, p. 476-494, 2000.
TRAVASSOS TOLOTTI, M.; TRAVASSOS, P.; FREDOU, F. L.; WOR, C.; ANDRADE, H. A., HAZIN, F. Size, distribu-tion and catch rates of the oceanic whitetip shark caught by the Brazilian tuna longline leet. Fish. Res., v. 143, 136-142, 2013.
VENABLES, W. N.; DICHMONT, C. M. GLMs, GAMs and GLMMs: an overview of theory for applications in isheries research. Fish. Res., v. 70, n. 2/3, p. 319-337, 2004. VIGNAUX, M. Catch per unit effort (CPUE) analysis of west coast
South Island Cook Strait spawing hoki isheries, 1987-93. We-llington: New Zealand Fisheries Association Research Docu-ment No.94/11, 1994.
VOOREN, C. M.; KLIPPEL, S. Ações para a conservação de tubarões e raias no sul do Brasil. Porto Alegre: Igaré, 2005. 262 p.
WALKER, T. Can shark resources be harvested sustainably? A question revisited with a review of shark isheries. Mar. Freshw. Res., v. 49, n. 7, p. 553-572, 1998.
WILLIAMS, M.; SAPOZNIK, M.; OCAMPO, R. M.; SOLIS, M.; NARVARTE, M., GONZALEZ, R.; ESTEVES, J. L.; GABLIARDINI, D. Comparison of AVHRR and SeaWiFS imagery with ishing activity and in situ data in San Matías Gulf, Argentina. Int. J. Remote Sens., v. 31, n. 17-18, p. 4531-4542, 2010.