Brazilian Journal of Physics, vol. 34, no. 4B, December, 2004 1527
Spectroscopic Measurements in a Titanium Vacuum Arc
with Different Ambient Gases
D. Grondona
∗, H. Kelly
∗, M. Pelloni, and F. O. Minotti
∗Instituto de F´ısica del Plasma (CONICET), Departamento de F´ısica,
Facultad de Ciencias Exactas y Naturales (UBA) Ciudad Universitaria Pab. I, (1428) Buenos Aires, Argentina
Received on 30 December, 2003; revised version received on 28 April, 2004
Spectral emission lines from a low pressure d-c arc discharge with a Ti cathode were studied in various ambient gases; N2, O2, and Ar. Light from the plasma was detected by an optical spectrometer multichannel analyzer
(OSMA). The spectral intensities of Ti, Ti+
, Ar and N2 were measured as a function of the gas pressure in
the range5×10−3−
0.5mbar. The measurements were performed in the inter-electrode region at different
distances from the cathode. For N2and O2as the filling gases, the intensities of Ti and Ti+increase with the
gas pressure up to pressure values of the order of0.2−0.4mbar, while they decrease for higher pressure values.
With Ar gas, a different behavior of the Ti+intensity was found; it presents an increasing general trend. The behavior of the lines was qualitatively analyzed in terms of the most relevant atomic processes that take place in the metallic plasma - gas structure (charge-exchange, electron impact excitation and ionization, etc.). It is found that the behavior of the observed spectral lines can be satisfactorily explained in terms of the relevance of these processes as functions of the neutral gas density and electron temperature.
1
Introduction
In a vacuum or low-pressure arc a plasma jet with energe-tic metallic ions (20−100eV) is ejected from the cathode surface. Under vacuum operation, these ions can be depo-sited onto any substrate located in the inter-electrode space, forming a metallic coating[1]. In many situations, the dis-charge chamber is filled with a gas, either with the purpose of forming complex coatings (using reactive gases)[2] or to produce a pretreatment of the substrate surface that impro-ves film adhesion. In particular, inert gases like argon have been used for this last purpose[3].
Several interactions of the metallic plasma jet with the gas particles take place in the discharge chamber such as elastic scattering, leading to ion slowing down and diffu-sion, and charge exchange reactions. Ionization of gas parti-cles by electron impact and several recombination processes (dissociative or three body recombination) also contribute to generate a complex plasma-neutral gas structure[4].
In a previous work[5], optical emission spectroscopy was used to obtain information on this structure. A Cu cathode was employed with O2and N2as background gases in the pressure range of10−4−0.4mbar.
In this work, a new spectroscopy study of a vacuum arc with Ti cathode is presented, but using also a monoatomic gas (Ar) besides O2 and N2 as filling gases, in a pressure range of5×10−3−0.5mbar.
The behavior of the observed spectral lines can be ex-plained in terms of the relevance of the different atomic pro-cesses that take place in the plasma inter-electrodic region as functions of the neutral gas pressure and electron tempe-rature.
2
Experimental setup
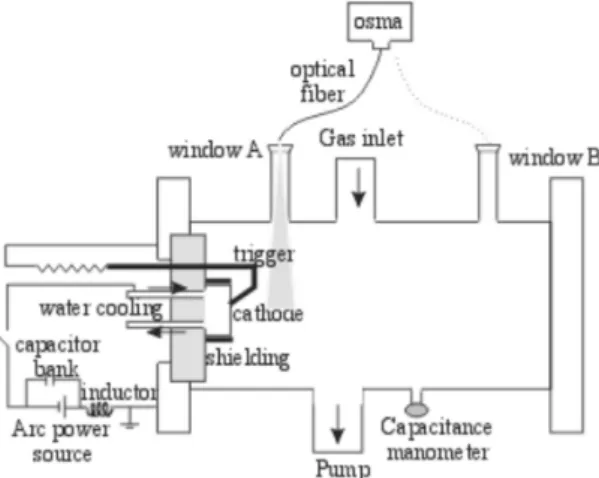
The experimental setup is shown schematically in Fig. 1. The vacuum chamber is a stainless steel cylinder with a length of 40 cm and a diameter of 25 cm, acting as the groun-ded anode. The cathode is a Ti cylinder with a diameter of 5.6 cm, surrounded by a floating shielding, connected to the negative terminal of the arc power supply. For optical di-agnosis two circular optical windows with a diameter of 4.0 cm were mounted on tubes with lengths of 10 cm protruding from the lateral wall of the chamber. The two windows (A and B, respectively) are located at axial distances of 9 and 25 cm from the cathode surface.
Figure 1. Scheme of the experimental setup including the spectros-copic diagnostic system.
1528 D. Grondonaet al.
Using an oil diffusion pump the vacuum chamber is eva-cuated to a base pressure below 10−4mbar and, during the discharge, a gas flux is introduced and its pressure monito-red with a capacitance manometer. Ar, N2and O2are used as filling gases in the pressure range5×10−3−0.5mbar.
The discharge circuit consists in a current supply of 150 A and 18 kW, in parallel with a capacitor bank of 165 mF connected to the electrodes through a series inductor of 2.8 mH to provide arc stability. The discharge is ignited with a Tungsten striker put into contact (and later removed) with the cathode, and the arc is operated in a continuous mode at 100 A.
The light emitted by the plasma is transported from the optical windows to the entrance slit of the spectrograph by optical fibers with a diameter of 1.5 mm. This spectrograph has a crossed Czerny-Turner design with an optical grating of 1200 lines/mm, and the emission spectrum was monito-red in the spectral region from 320 to 850 nm. The light from the spectrograph is intensified by a multi-channel plate and detected by a photodiode array (OSMA). The sensibility of the OSMA was determined by employing a He-Ne laser of known output power as the light source. It was found that 130±20photons passing through the entrance slit of the spectrograph produce one count in the detector[5].
3
Results
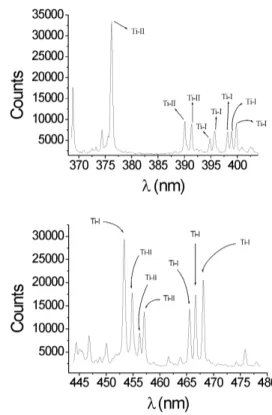
In Fig. 2 are presented typical spectral diagrams obtained from window A for a high vacuum (pressure below10−4 mbar) discharge. Both figures correspond to the same dis-charge but with different spectral ranges. The exposure time of the detector was∼1 s, and the reproducibility was good, with statistical dispersion below 15%, evaluated after 15 re-gisters obtained under identical conditions of the discharge. As can be seen, several lines of Ti-I and Ti-II are registered, but none of Ti-III (within the whole studied spectral range) in spite of being this species the most abundant in Ti cathode arcs (Ti ions are emitted from the cathode spot with charge state ofz = +1,+2,+3and percentages of 27%, 67% and
6%, respectively[6]).
Figure 3 shows a typical spectral diagram from window A for Ar at(5.0±0.5)×10−2mbar. Only lines from neutral Ar (Ar-I) were found.
In Fig. 4, a typical spectral diagram from window A is shown for N2 at(2.7±0.5)×10−2mbar. The diagram shows the characteristic band emission of neutral N2. Again, no ionized gas species were detected. Besides, no lines (or bands) corresponding to oxygen were found.
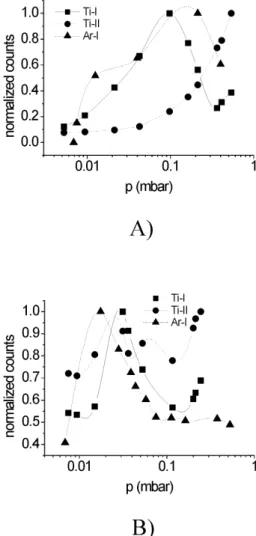
Figure 5 shows the behavior with pressure of characte-ristic lines of Ti-I (468.19 nm), Ti-II (454.96 nm), and Ar-I (811.53 nm) when Ar is used as filling gas. The intensity of each species (that is given in detector counts) is normali-zed to its maximum. Fig. 5a) shows the results from win-dow A and Fig. 5b) those from winwin-dow B. The maximum of Ti-I for window A, corresponds to approximately 0.1 mbar, while for window B this maximum appears at about3×10−2 mbar. The behavior of the Ti-II line from window A shows a continuous increase, while for window B it shows some oscillations but with an increasing general trend. The Ar-I
lines follows approximately the Ti-I line behavior with pres-sure, but with maxima positions somewhat shifted.
Figure 2. Spectral diagrams from window A for a dischrage in vacuum (pressure below 10−4
mbar).
Figure 3. Spectral diagram from window A for Ar at(5.0±0.5)× 10−2
Brazilian Journal of Physics, vol. 34, no. 4B, December, 2004 1529
Figure 4. Spectral diagram from window A for N2at(2.7±0.5)×
10−2
mbar.
Figure 5. Behavior with pressure of characteristic lines of I, Ti-II, and Ar-I when Ar is used as filling gas: a) results from window A; b) results from window B.
Figure 6 shows the behavior with pressure of the same characteristic lines of Ti-I and Ti-II used before, for win-dow A only and for the other two gases. Fig. 6a) corres-ponds to N2 and Fig. 6b) to O2. From Fig. 6a) it can be seen that both Ti lines present the same behavior with the
pressure with a maximum at∼0.2mbar for N2, while that maximum appears at∼ 0.3mbar for O2(see Fig. 6b)). A characteristic emission line of N2(775.3 nm) is also plotted in Fig. 6a), and presents an increasing behavior at low pres-sure, reaching a maximum at∼0.08mbar and following the
behavior of both Ti lines.
Figure 6. Behavior with pressure of characteristic lines of Ti-I and Ti-II for window A :a) filling gas N2; b) filling gas O2.
4
Discussion and final remarks
A systematic study of Ti emission lines in the presence of various ambient gases at different pressure values has been carried out.
In order to interpret the obtained results some points are worth remarking.
1530 D. Grondonaet al.
∼105
−106
cm−3is enough to give an intense register (close to saturation) in the detector.
Since the ejection velocities of the ions at the spot are
∼ 106
cm/s[6], and taking into account the above quoted emission probability, the resulting mean free path for spon-taneous radiative decay is ∼ 10−2 cm. Hence, it can be concluded that the generation of a given excited state popu-lation is a local phenomenon which has no memory of the original ion state at the spot.
The absence of Ti-III lines, in spite of the fact that
z= +2is the most abundant species for a Ti cathode, can be
explained considering that charge-exchange cross sections are very high, so practically no Ti-III species can be found at window A even for very low gas pressures[4]. Besides, the absence of this line is also consistent with the lack of excited particle levels by electron impact, since visible transitions of Ti-III correspond to highly excited levels (with bound ener-gies of about 20 eV) while the electron temperature in the inter-electrode space is∼1.8eV (or less, depending on the
gas pressure value)[8], too low for that ion excitation energy level.
When Ar is used as filling gas, the Ti-I line increases at low pressure values, while decreases at higher values. The increase can be explained in terms of the neutral Ti species being populated by exchange from higher charge-state species with Ar gas (in fact the maximum of Ti-I line coincides approximately with the pressure which makes the mean free path for charge-exchange of the order of the win-dow position; note that winwin-dow B, that is located at a dis-tance three times larger than window A presents the maxi-mum of Ti-I line at a pressure value three times lower). The decrease at high pressure can be explained because charge-exchange has been exhausted and neutral Ti is excited by electron collisions, but with electrons progressively colder. The Ti-II line shows a continuous increase with pressure, which can be explained by charge-exchange from Ti-III (at low pressure) and by charge-exchange of Ar+
ions with neu-tral Ti. The behavior of the Ar line with pressure follows approximately the behavior of the electron temperature.
In the presence of molecular gases, there are practically no gaseous ions (because of the presence of dissociative re-combination, which gives a strong remotion channel for ga-seous ions), and hence the lines follow the behavior of the electron temperature.
To summarize, the registered behavior of the spectral li-nes can be explained in terms of the relevance of the dif-ferent atomic processes that take place in the plasma inter-electrodic region as function of the neutral gas pressure and the electron temperature.
Acknowledgments
This work was supported by a grant from the Buenos Ai-res University (PID X214) and from the Agencia Nacional de Promoci´on Cient´ıfica y Tecnol´ogica (PICT 03-09491).
References
[1] R. L. Boxman, D. M. Sanders, and P. J. Martin,Handbook of Vacuum Arc Science and Technology, Fundamental and Ap-plications, Park Ridge, NJ: Noyes, 1995.
[2] H. Randhawa, Thin Solid Films167, 175, 1988.
[3] C.A. Davis, M. K. Puchert, D. R. McKenzie, and D. W. Ja-mes,Proc. XVth Int. Symp. on Discharges and Electrical In-sulation in Vacuum, Darmstadt, 1992, 690.
[4] A. Lepone and H. Kelly, J. Phys. D: Appl. Phys.34, 3043, 2002.
[5] D. Grondona, H. Kelly, A. M´arquez, and A. Lepone, IEEE Trans. Plasma Sci.30, 391, 2002.
[6] J. Kutzner and H. C. Miller, IEEE Trans. Plasma Sci.17, 688, 1989.
[7] W. Lochte-Holtgreven,Plasma Diagnostics, New York:AIP, 1995.