Article
J. Braz. Chem. Soc., Vol. 22, No. 2, 344-351, 2011. Printed in Brazil - ©2011 Sociedade Brasileira de Química 0103 - 5053 $6.00+0.00
A
*e-mail: [email protected], [email protected]
A Sensitive Determination of Acetaminophen in Pharmaceutical Preparations and
Biological Samples using Multi-Walled Carbon Nanotube Modiied Glassy Carbon
Electrode
Ali Babaei,*,a,b Mohammad Afrasiabi,a Somaieh Mirzakhania and Ali Reza Taheria
aDepartment of Chemistry and bResearch Center for Nanotechnology,University of Arak,
Arak, P.O. Box 38156-879, Iran
Um eletrodo quimicamente modiicado foi construído, baseado em eletrodo de carbono vítreo modiicado por nanotubos de carbono de paredes múltiplas (ECV-NTCPM). O uso deste sensor na determinação de acetaminofeno (ACT), em meio aquoso tamponado, foi demonstrado. As medidas foram realizadas com utilização dos métodos de voltametria de pulso diferencial (VPD), voltametria cíclica (VC) e cronoamperometria (CA). A aplicação de VPD mostrou dois intervalos dinâmicos lineares. O primeiro intervalo dinâmico linear foi de 0,1 a 22 μmol L−1, com equação de calibração Ip(μA) = 1,2782c (µmol L−1) + 0,2431
(R2 = 0,9984) e o segundo intervalo dinâmico linear foi entre 26 e 340 μmol L−1 com equação
de calibração Ip(μA) = 0,7793c (µmol L−1) + 11,615 (R2 = 0,9986). O limite de detecção de
0,029 μmol L−1 (S/N = 3) foi obtido. O eletrodo modiicado mostrou respostas eletroquímicas com
alta sensitividade, excelente seletividade e estabilidade para determinação de ACT em condições ótimas, o que o torna um sensor adequado para detecção submicromolar de ACT em soluções. O desempenho analítico deste sensor foi avaliado para detecção de ACT em soro humano, urina humana e em preparações farmacêuticas com resultados satisfatórios.
A chemically modiied electrode is constructed based on multi-walled carbon nanotube modiied glassy carbon electrode (MWCNTs/GCE). It was demonstrated that this sensor could be easily used for determination of acetaminophen (ACT) in aqueous buffered media. The measurements were carried out by application of differential pulse voltammetry (DPV), cyclic voltammetry (CV) and chronoamperometry (CA) methods. Application of DPV method showed two linear dynamic
ranges. The irst linear dynamic range was from 0.1 to 22 μmol L−1, with a calibration equation
of Ip(μA) = 1.2782c (µmol L−1) + 0.2431 (R2 = 0.9984) and the second linear dynamic range was
between 26 to 340 μmol L−1 with a calibration equation of Ip(μA) = 0.7793c (µmol L−1) + 11.615
(R2 = 0.9986). A detection limit of 0.029 μmol L−1 (S/N = 3) was obtained. The modiied electrode
showed electrochemical responses with high sensitivity, excellent selectivity and stability for ACT determination at optimal conditions, which makes it a suitable sensor for submicromolar detection of ACT in solutions. The analytical performance of this sensor has been evaluated for detection of ACT in human serum, human urine and a pharmaceutical preparation with satisfactory results.
Keywords: acetaminophen, carbon nanotube, modiied glassy carbon, electrochemical sensor
Introduction
Acetaminophen (N-acetyl-p-aminophenol) (ACT), also known as paracetamol, is a drug with antipyretic and analgesic action, frequently used in therapy and which has low toxicity when used at the recommended doses.1 Nevertheless, the ease with which ordinary people can access this drug makes it frequently associated with overdoses, in
pharmaceutical formulation is vital in the quality control of the pharmaceutical industry, and can have a signiicant impact in healthcare quality. Various methods such as capillary electrophoresis,8,9 amperometric batch injection analysis,10 colorimetry11 titrimetry,12 FTIR and Raman spectrometry,13 low injection analysis (FIA) using different methods of detection,12,14,15 liquid chromatography,16-18 spectrophotometry19-22 and chemiluminescence23 have been employed in the determination of ACT in pharmaceutical preparations and biological luids. However, the majority of these methods suffer from some disadvantages such as high costs, long analysis times and requirement for sample pretreatment, and in some cases low sensitivity and selectivity that makes them unsuitable for routine analysis. Therefore, development of a simple, inexpensive, sensitive and accurate analytical method for determination of ACT is of great importance. ACT is an electroactive compound which can be oxidized electrochemically. The development and application of electrochemical sensors for ACT analysis, with respect to its sensitivity, accuracy, and simplicity, has been of greater interest in recent years.24-46 Careful studies of the reported articles revealed that apart from the variation of the electrochemical methods, there is a need to improve the electrochemical techniques with respect to their sensitivity, linear dynamic range or limit of detection.
Carbon nanotubes (CNT) represent an increasingly important group of nanomaterials with unique geometrical, mechanical, electronic and chemical properties.47,48 Such properties of CNT make them also extremely attractive for the task of electrochemical detection.
In this work we present the application of the multi-walled carbon nanotube modiied glassy carbon electrode (MWCNTs/GCE) as a sensor for determination of ACT in buffer solutions at the biological pH. This study has led to the development of a voltammetric method with good characteristics, such as simplicity of electrode preparation, high selectivity, wide linear dynamic range, and low detection limit. Finally the analytical performance of this sensor for determination of ACT in human serum, human urine and a pharmaceutical preparation samples is evaluated.
Experimental
Reagents and solutions
All chemicals were analytical grade and used without further puriication. ACT and multi-walled carbon nanotubes (MWCNTs ) (> 95 wt.%, 5-20 nm) were obtained from Merck and PlasmaChem GmbH companies, respectively. Stock standard solutions of 10 mmol L-1 ACT were freshly
prepared in 0.1 mol L-1 phosphate buffers of pH 7. All subsequent ACT solutions were prepared by diluting the stock standard solutions using 0.1 mol L-1 phosphate buffer (pH 7). 0.1 mol L-1 phosphate buffer solution (PBS) was prepared by dissolving appropriate amounts of sodium hydrogen phosphate and sodium dihyrogen phosphate in 250 mL volumetric lask. Electrochemical experiments on the ACT were carried out in 0.1 mol L-1 PBS at pH 7.
Fresh human serum samples were obtained from the Razi Institute of Vaccine and Serum Company (Tehran, Iran). The serum and urine sample were iltered and diluted 100 times with 0.1 mol L-1 PBS of pH 7 and checked for the determination of the recovery by spiking the ACT. Ten tablets of Tylenol (McNeil-PPC Inc.,USA); (each labeled as containing 500 mg of ACT ) were accurately weighed and powdered in a mortar. An amount equivalent to one tablet was dissolved in 70 mL of 0.1 mol L-1 PBS (pH 7). After sonication for 10 min, the solution was iltered, the residue was washed three times with 10 mL of the buffer solvent, and the iltered volume was adjusted to 100 mL with the same solvent. This solution was diluted 1000 times for ACT determination with 0.1 mol L-1 PBS of pH 7. The solution was used for the determination of the recovery eficiency.
Instrumentation
A l l t h e vo l t a m m e t r i c m e a s u r e m e n t s w e r e carried out using a nanotube modified glassy carbon electrode (MWCNTs/GCE) as a working electrode, an Ag/AgCl/(3 mol L-1) KCl as a reference electrode and platinum wire as an auxiliary electrode. DPV, CV and CA experiments were carried out using an Autolab PGSTAT 30 Potentiostat Galvanostat (EcoChemie, The Netherlands) coupled with a 663 VA stand (Metrohm Switzerland). All potentials given are with respect to the potential of the reference electrode. The pH measurements were made with a Metrohm 744 pH meter using a combination glass electrode.
Modiication of the electrodes
A glassy carbon electrode (GCE, 3 mm diameter, Metrohm) was polished with 0.3 and 0.05 μm aluminum slurry and rinsed thoroughly with triply distilled water. The GC electrode was individually cleaned by ultrasonic agitation for 5 min in ethanol and then distilled water. The electrode was then dried under nitrogen gas low.
The fabricated MWCNTs/GCE was placed in the electrochemical cell containing 0.1 mol L−1 PBS (pH 7) and several cycles in the potential range of 0.1 to 0.7 V were applied using CV method to obtain stable responses. The electrochemical surface area of the modified MWCNTs/GCE and bare GCE were determined by cyclic voltammogram measured between −0.1 to 0.6 V in ferricyanide solution (0.1 mol L−1 phosphate buffer, pH 7.0) at different scan rates (not shown). The modiied MWCNTs/GCE showed surface area of 9.8 times of GCE.
General procedure
Solutions (10 mL) containing the appropriate amounts of ACT in 0.1 mol L-1 PBS at pH 7 were transferred into the voltammetric cell. The voltammograms were recorded by applying positive-going potential from 0.2 to 0.6 V. The voltammogram showed an anodic peak around 0.32 V corresponding to the oxidation of ACT compound with height proportional to its concentration in solution. The calibration curves were obtained by plotting anodic peak currents of ACT versus the corresponding concentrations. All experiments were carried out under open circuit conditions. After each measurement, the MWCNTs/GCE was regenerated by thoroughly washing the electrode successively with triply distilled water and then 5% sodium hydroxide solution. Finally the electrode was rinsed carefully with distilled water to remove any adsorbate from electrode surface and to provide a fresh one for subsequent experiments.
Results and Discussion
Cyclic voltammetric investigation of ACT on MWCNTs / GCE
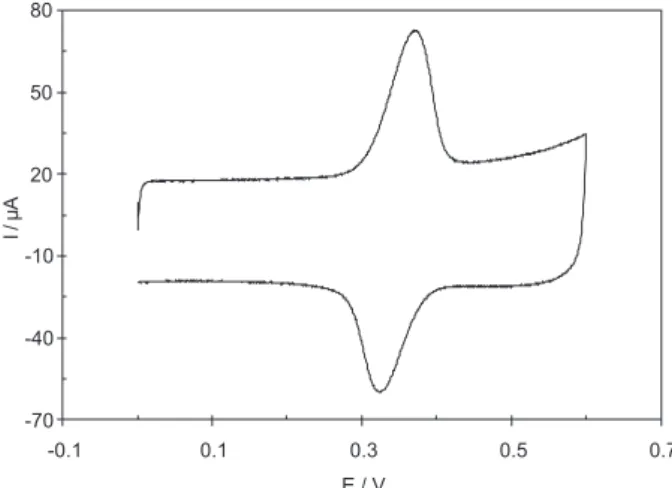
The recorded cyclic voltammogram for 50 μmol L−1 ACT using the MWCNTs/GCE is shown in Figure 1. The ACT showed a reversible redox peak with ∆Ep equal to 0.028 V, which is similar to a two electron redox reversible system. This phenomenon is in accordance with electrocatalytic behavior of MWCNTs.
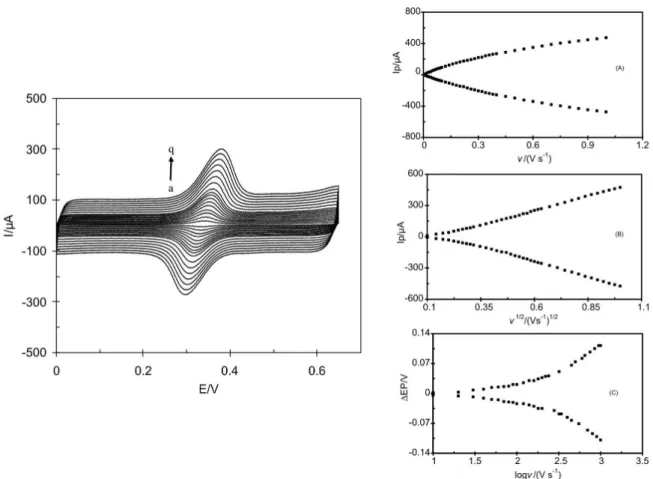
The effect of potential scan rate on redox response of ACT was investigated in phosphate buffer (pH 7.0) solution containing 50 μmol L−1 ACT. Figure 2 shows the cyclic voltammograms of the modiied electrode at different scan rates in potential range 0 to 0.65 V. The anodic and cathodic peak currents of ACT were proportional to the scan rate over the range 10-280 mV s-1 (Figure 2A) indicating adsorptive properties of the electrochemical process. Moreover, the anodic peak currents were almost the same as the corresponding cathodic peak currents.
At sweep rates between 280 mV s−1 and 1000 mV s−1, the plot of peak currents vs. scan rate plot deviates from linearity and the peak current becomes proportional to the square root of the scan rate (Figure 2B), indicating a diffusion controlled process. At sweep rates higher than 100 mV s−1 peak separations (∆E
p) begin to increase (Figure 2C), indicating the limitation due to charge transfer kinetics. Based on Laviron theory49 the electron transfer rate constant (ks) and charge transfer coeficient (α) can be determined by measuring the variation of ∆Ep vs. log scan rate. The slope of the ∆Ep vs. log(ν), was about, 131.1 mV. Using the equation of:
Ep = K − 2.3030 (RT/αnF) log(ν)
By considering two electrons transferred for ACT, charge transfer coeficient (α) of 0.562 was obtained. Introducing α value in the following equation, an apparent surface electron transfer rate constant, ks = 2.558 s−1, was estimated.
The large value of electron transfer rate constant indicates high ability of MWCNTs for promoting electron transfer between ACT and the electrode surface. The surfaces of MWCNTs contain a large number of defects as well as special nanostructure of MWCNTs may act as molecular wires, enhance the direct electron transfer of ACT at MWCNTs.
Electroxidation of ACT on MWCNTs /GCE
The differential pulse voltammograms (DPV) recorded for ACT at bare GCE, and MWCNTs/GCE are shown in
Figure 1. Cyclic voltammograms of 50 μmol L−1 ACT at MWCNTs/GCE
Figure 3. Differential pulse voltammograms of 40 µmol L−1 of ACT at (a)
GC and (b) MWCNTs/GCE in 0.1 mol L−1 phosphate buffer solution (pH
7). Other conditions: Open circuit, tacc= 60 s, pulse amplitude = 50 mV and scan rate = 10 mV s−1, interval time 0.5 s, modulation time = 0.2 s
and step potential = 5 mV.
Figure 2. Effect of scan rate on the cyclic voltammograms peak currents of 50 μmol L−1 ACT in phosphate buffer (pH 7) solution for different scan rate as
(a) 10, (b) 20, (c) 30, (d) 40, (e) 50, (f) 60, (g) 70, (h) 80, (i) 90, (j) 100, (k) 120, (l) 140, (m) 160, (n) 180, (o) 200, (p) 220 and (q) 240 mVs-1. Insets: (A)
Plot of peak currents as a function of scan rate of potential. (B) Plot of peak currents as a function of square root of the scan rate of potential. (C) Plot of peak separations currents as a function of logarithm of the scan rate of potential.
Figure 3. Curve a shows the voltammogram of 40 µmol L−1 ACT in PBS (pH 7) at GC. Curve b is a voltammogram of ACT obtained under the same conditions as curve a, at a MWCNTs /GCE. As can be seen, for the GC the oxidation peak for ACT is very small. However, the DPVs of
ACT at MWCNTs/GCE (curve b) showed considerable increases in its oxidation peak current. The presence of MWNTs could increase the surface area of the electrode and facilitate electron transfer between electrode and the analyte. Therefore the enhancements in the corresponding electrochemical oxidation peak currents were observed. Our electrochemical data showed that surface area of modiied MWCNTs/GCE is 9.8 times of GCE. However, the oxidation peak current of ACT was increased upto 50 times, therefore the catalytic effect of MWCNTs is also responsible for increasing current.
Effects of solution pH
60 s. However after 60 s the rate of increase falls away and it eventually reaches plateau. As a consequence, the accumulation time of 60 s was chosen as an optimum time for further experiments.
Linear dynamic range and limit of detection of the method
The electrochemical responses for consecutive addition of ACT to a 0.1 mol L-1 PBS pH 7 using MWCNTs/GCE are depicted in Figures 6 and 7. Figure 6 show differential pulse voltammograms and corresponding calibration curves obtained at MWCNTs/GCE in various concentrations of ACT. By application of DPV method two linear ranges were obtained. The irst linear dynamic range was from 0.1 to 22 μmol L−1, with a calibration equation of Ip(μA) = 1.2782c (µmol L−1) + 0.2431 (R2 = 0.9984) and the second linear dynamic range was between 26 to 340 μmol L−1 with a calibration equation of Ip(μA) = 0.7793c (µmol L−1) + 11.615 (R2 = 0.9986). A limit of detection of 0.029 µmol L−1 (S/N = 3) was obtained.
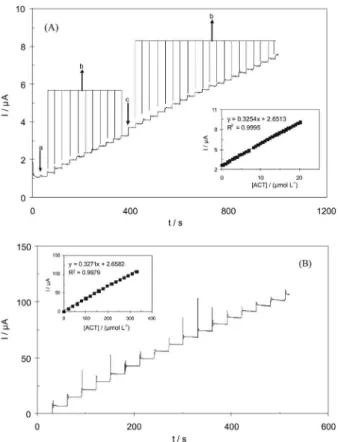
Figure 7 displays hydrodynamic chronoamperograms response of the rotated modiied electrode (2500 rpm) with successive injection of ACT at an applied potential of 0.4 V in PBS (pH 7). Application of chronoamperometry method showed that the linear dynamic range was from 0.3 to 340 μmol L−1, with a calibration equation of Ip(μA) = 0.3254c (µmol L−1) + 2.6513 (R2 = 0.9995). A detection limit of 0.045 µmol L-1 (S/N = 3) was obtained.
Repeatability and long-term stability of the electrode
The repeatability of the analytical method for determination of ACT has been studied using DPV method.
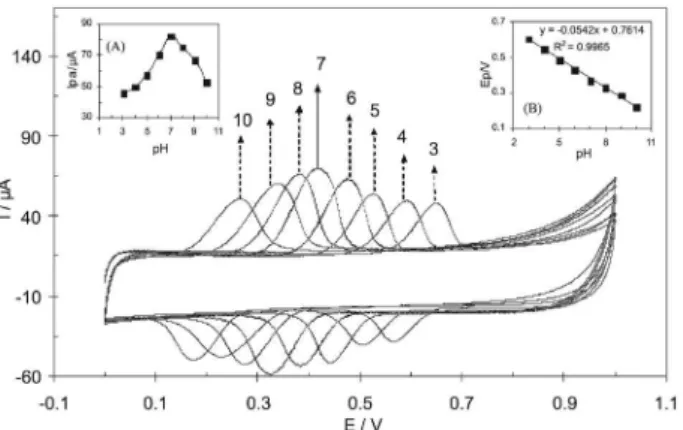
Figure 4. Effects of pH on the cyclic voltammogram oxidation peak current of 50 μmol L−1 ACT at MWCNTs/GCE in phosphate buffer
solutions at scan rate of 50 mVs-1. Insets: (A) Plot of anodic peak currents
(Ipa) as a function of pH of buffer solutions. (B) Plot of peak potentials (Ep) as a function of pH of buffer solutions.
Figure 6. Differential pulse voltammograms for different concentrations of ACT as (a) 0.1, (b) 1.25, (c) 3.75, (d) 8.5, (e) 16, (f) 30, (g) 50, (h) 75, (i) 100, (j) 130 , (k) 145, (l) 200, (m) 240, (n) 280 and (o) 340 μmol L−1.
Insets (A) and (B) show plots of corresponding ACT oxidation peak currents as a function of ACT concentrations.
However at higher pH the ACT oxidation peak current starts to diminish. Therefore the pH value of 7, which is close to biological pH value, was chosen as an optimum solution pH for further experiments. Variation of ACT oxidation peak potential with pH is in accordance with equation of Ep = −0.0542 pH + 0.704 (Figure 4, inset B). For a Nernstian process which numbers of transferred electrons are equal to number of transferred proton, the slope would be expected to be −59 mV pH−1 unit. The −54 mV pH−1 unit slope is in good agreement with other previously reported results.50-52 This suggests that the number of electrons and protons transferred in the redox reaction of ACT is equal.
Effects of accumulation time
Figure 5 shows plots of the anodic peak currents, obtained from CV experiments, versus accumulation time for 15 µmol L-1 ACT. Initially, peak currents for this compound increase with accumulation time up to
Figure 5. Effect of accumulation time on the cyclic voltammogram anodic peak currents of 15 μmol L−1 ACT in phosphate buffer (pH 7) solution at
Indeed, the relative standard deviations (RSD) of 2.06% and 1.82% for 10.0 and 50.0 μmol L-1 ACT over ten consecutive determinations have been obtained, respectively.
Another advantage of the proposed modiied electrode is that the resulting modiied electrode has a good long-term stability. Stability of the proposed electrode was tested by measuring the decrease in voltammetric current during repetitive DPV measurements of ACT solutions with MWCNTs/GCE stored in solution or air for certain period of time. For example, in the determination of 50 μmol L−1 ACT in 0.1 mol L-1 PBS (pH 7), subjecting the modiied electrode to an experiment every 30 min, led to a less than 7% decrease in the voltammetric currents after 24 h. When the electrode was stored in the atmosphere for 5 days, the corresponding current responses fell less than 11% when the electrode subjected to a solution containing 50 μmol L−1 ACT.
Interference studies
The effects of common interfering species solution of 100 µmol L−1 ACT under the optimum conditions were
Table 1. Determination of ACT in real samples with MWCNT
Sample Added / (μmol L-1)
Founda /
(μmol L-1)
R.S.D. / (%)
Recovery / (%)
Serum 0.0 0.0 -
-2.0 1.96 2.8 98.0
5.0 4.87 2.3 97.4
Urine 0.0 0 -
-5.0 4.93 1.9 98.6
10.0 9.76 2.2 97.6
Tylenol Tablet 0.0 32.57b 1.6 98.7
10.0 42.71 2.2 101.4
20.0 52.62 1.8 99.1
aAverage of ive determinations at optimum conditions. bThis amount is
equal to 493.7 mg per tablet. Figure 7. Hydrodynamic amperometric response at rotating MWCNTs/
GCE (rotating speed 2500 rpm) held at 0.4 V in PBS (pH 7) for determination of ACT as (A) from 0.3 to 20 μmol L−1 by successive
additions of (a) 0.3, (b) 0.6 and (c) 1.2 μmol L−1 ACT (inset: corresponding
calibration curve), and (B) from 20 to 340 μmol L−1 by successive additions
of 20 μmol L−1 ACT (inset: corresponding calibration curve).
investigated. The results showed that concentrations of
L-dopa(500), dopamine(500), L-alanin(1000), L-glutamic acid(1400), uric acid(200), ascorbic acid(700) and aspartic acid(3500) did not signiicantly inluence the height of the oxidation peak current for ACT. The tolerance limit was deined as the concentrations which give an error of ≤ 10% in the determination of ACT compound. The data in the brackets are concentration of the interfering species in μmol L-1. The results conirm that the proposed method is free from interferences from the most common interferants.
Analytical applications
Table 2. Comparison of merits of voltammetry methods for determination of ACT
Ref. Electrode LDR/
(μmol L−1)
Sensitivity/ (μA/μmol L−1)
LOD/ (μmol L−1)
RSD/ (%)
Analysis in Serum Urine Tablets
24 GC/tetraruthenated porphyrin ilm 1-100 NR 0.11 NR No No No
25 Boron-doped diamond thin ilm 0.5-50 0.022 0.01 2.2 No No No
26 5H pencile lead 100-5000 0.004 NR 1.3 Yes No No
27 CP/crude extract of zucchini 120-2500 NR 69 1.1 Yes No No
28 GC/Cu(II)-Conducting Polymer Complex 20-5000 0.016 5 2.5 Yes No No
29 Nanogold/indium tin oxide 0.2-1500 0.01 0.18 2.4 Yes No No
30 CF/electrocopolymerized-moleculary imprinted ilm
6.5-2000 0.18 1.5 5.6 No No No
31 GC/L-Cysteine 0.2-100 0.25 0.05 1.5 Yes No Yes
32 GC/C60 50-1500 0.013 50 NR Yes No Yes
33 GC 0.35-100 NR 0.3 4.1 Yes No No
34 Naion coated GC tubular 50-500 NR 17 3 Yes Yes No
35 Imprinted TiO2 thin ilm 0.8-5
0.308 0.2 3.3 No No No
5-80
36 GC/SWCNTs-dicetyl phosphate ilm 0.1-20 NR 0.04 5.5 Yes No No
37 Au/4-amino-2-mercaptopyrimidine 2-4000 0.165 0.4 2.8 Yes No No
38 GC/carbon-coated nickel magnetic nanoparticles
7.8-110 0.132 0.6 1.1 No No No
39 PG/electrocopolymerized-moleculary imprinted polypyrrole
5-500
NR 0.79 NR Yes No No
1250-4500
40 Carbon ilm resistor 0.8-500 NR 0.14 1.3 Yes No No
41 GC/zirconium alcoxide porous gel 19.6-255 NR 0.12 NR Yes No No
42 GC/nano-TiO2 /polymer 12-120 0.05 2 2.3 Yes No No
43 Carbon ionic liquid 1-2000 0.068 0.3 2.1 Yes No Yes
44 PPG/MWCNTs 0.01-0.2
1.04 0.01 NR Yes No No
0.2-20
45 Boron-doped diamond 0.5-83 0.57 0.49 NR Yes No No
46 Screen-printed 2.5-1000 NR 0.1 2.2 Yes No No
This work GC/MWCNTs 0.1-22
1.278 0.029 1.8 Yes Yes Yes
26-340
LOD: Limit of Detection; LDR: Linear dynamic range; NR: Not Reported; GC: Glassy Carbon; CP: Carbon Paste; CF: Carbon Fiber; PG: Pencil Graphite; PPG: Plane Pyrolytic Graphite.
Conclusions
In this paper we introduced a simple method to make a sensor based on multi-walled carbon nanotube modiied glassy carbon electrode. We have shown that the application of MWCNTs can increase anodic peak currents by enhancement of electron transfers of ACT compound on the electrode surface. The results indicated that modiication of GCE with MWCNT allows the determination of ACT with good sensitivity and selectivity. The electrode showed high stability in repetitive experiments due to high water stability and high mechanical strength of MWCNTs. The effects of potential interferant were studied, and it was found that the proposed procedure is free from interferences of most common interfering compounds. When the procedure was used for the determination of ACT in some real samples like human serum, urine and some drugs, satisfactory results were obtained The simple fabrication procedure, high speed, reproducibility,
high stability, wide linear dynamic range, low detection limit and high sensitivity, all suggest that the proposed sensor is an attractive candidate for practical applications.
Acknowledgments
The authors gratefully acknowledge the support of this work by the Research Council of Arak University. Thanks to Dr. Alan Happer from Canterbury University in New Zealand for his valuable comments.
References
1. Sweetman, S. C.; The Complete Drug Reference, 33rd ed.,
Pharmaceutical Press: London, 2002.
2. Anker, A. In Clinical Toxicology; Marx, J., ed.; W.B. Saunders Company: Philadelphia, 2001.
4. Mugford, C. A.; Tarloff, J. B.; Toxicol. Lett.1997, 93, 15. 5. Nagasawa, H. T.; Shoeman, D. W.; Cohen, J. F.; Rathbun, W.
B.; J. Biochem. Toxicol.1996, 11, 289.
6. Prabakar, S. J. R.; Narayanan, S. S.; Talanta2007, 72, 1818. 7. Yesilada, A.; Erdogan, H.; Ertan, M.; Anal. Lett. 1991, 24, 129. 8. Zhao, S.; Bai, W.; Yuan, H.; Xiao, D.; Anal. Chim. Acta2006,
559, 195.
9. Capella-Peiro, M. E.; Bose, D.; Rubert, M. F.; Esteve-Romero, J.; J. Chromatogr., B2006, 839, 95.
10. Quintino, M. S. M.; Araki, K.; Toma, H. E.; Angnes, L.; Electroanalysis2002, 14, 1629.
11. Usifoh, C. O.; Adelusi, S. A.; Adebambo, R. F.; Pak. J. Sci. Ind. Res.2002, 45, 7.
12. Knochen, M.; Giglio, J.; Reis, B. F.; J. Pharm. Biomed. Anal. 2003, 33, 191.
13. Al-Zoubi, N.; Koundourellis, J. E.; Malamataris, S.; J. Pharm. Biomed. Anal.2002, 29, 459.
14. Xiong, X. Y.; Tang, Y. H.; Wang, N. N.; Wu, S. J.; Fenxi Shiyanshi2007, 26, 80.
15. Silva, M. L. S.; Garcia, M. B. Q.; Lima, J. L. F. C.; Barrado, E.; Portugaliae Electrochim. Acta2006, 24, 261.
16. Ravisankar, S.; Vasudevan, M.; Gandhimathi, M.; Suresh, B.; Talanta1998, 46, 1577.
17. Goyal, A.; Jain, S.; Acta Pharm. Sci.2007, 49, 147.
18. Selvan, P. S.; Gopinath, R.; Saravanan, V. S.; Gopal, N.; Kumar, S. A.; Periyasamy, K.; Asian J. Chem.2007, 19, 1004. 19. Bouhsain, Z.; Garrigues, S.; de la Guardia, M.; Fresenius J.
Anal.Chem.1997, 357, 973.
20. Hanaee, J.; Pharm. Acta Helv. 1997, 72, 239.
21. Mohamed, F. A.; Abdallah, M. A.; Shammat, S. M.; Talanta 1997, 44, 61.
22. Khaskheli, A. R.; Shah, A.; Bhange, M. I.; Niazr, A.; Mahesar, S.; Spectrochim. Acta, Part A 2007, 68, 747.
23. Easwaramoorthy, D.; Yu, Y. C.; Huang, H. J.; Anal. Chim. Acta 2001, 439, 95.
24. Quintino, M. S. M.; Araki, K.; Toma, H. E.; Angnes, L.; Electroanalysis 2002, 14, 1629.
25. Wangfuengkanagul, N.; Chailapakul, O.; J. Pharm. Biomed. Anal. 2002, 28, 841.
26. Masawat, P.; Liawruangrath, S.; Vaneesorn, Y.; Liawruangrath, B.; Talanta2002, 58, 1221.
27. Vieira, I. C.; Lupetti, K. O.; Fatibello-Filho, O.; Quim. Nova 2003, 26, 39.
28. Boopathi, M.; Won, M. S.; Shim, Y. B.; Anal. Chim. Acta2004, 512, 191.
29. Goyal, R. N.; Gupta, V. K.; Oyama, M.; Bachheti, N.; Electrochem. Commun. 2005, 7, 803.
30. Gomez-Caballero, A.; Goicolea, M. A.; Barrio, R. J.; Analyst 2005, 130, 1012.
31. Wang, C.; Li, C.; Wang, F.; Wang, C.; Microchim. Acta2006, 155, 365.
32. Goyal Rajendra, N.; Singh Sudhanshu, P.; Electrochim. Acta 2006, 51, 3008.
33. Messina, G. A.; De Vito, I. E.; Raba, J.; Anal. Chim. Acta2006, 559, 152.
34. Silva, M. L. S.; Garcia, M. B. Q.; Lima, J. L. F. C.; Barrado, E.; Anal. Chim. Acta2006, 573, 383.
35. Wang, C.; Li, C.; Wei, L.; Wang, C.; Microchim. Acta2007, 158, 307.
36. Sun, D.; Zhang, H.; Microchim. Acta2007, 158, 131. 37. Jia, L.; Zhang, X. H.; Li, Q.; Wang, S. F.; Anal. Chem. 2007,
62, 266.
38. Wang, S. F.; Xie, F.; Hu, R. F.; Sens. Actuators, B2007, 123, 495.
39. Ozcan, L.; Sahin, Y.; Sens. Actuators, B2007, 127, 362. 40. Felix, F. S.; Brett, C. M. A.; Angnes, L.; J. Pharm. Biomed.
Anal.2007, 43, 1622.
41. Sima, V.; Cristea, C.; Lapadus, F.; Marian, I. O.; Marian, A.; Sandulescu, R.; J. Pharm. Biomed. Anal.2008, 48, 1195. 42. Ashok kumar, S.; Chun-Fang Tang; Shen-Ming Chen; Talanta
2008, 76, 997.
43. ShangGuan, X.; Zhang, H.; Zheng, J.; Anal. Bioanal. Chem. 2008, 391, 1049.
44. Kachoosangi, R. T.; Wildgoose, G. G.; Compton, R. G.; Anal. Chim. Acta2008, 618, 54.
45. Lourencao, B. C.; Medeiros, R. A.; Rocha-Filho, R. C.; Mazo, L. H.; Fatibello-Filho, O.; Talanta2009, 78, 748.
46. Fanjul-Bolado, P.; Lamas-Ardisana, P. J.; Hernandez-Santos, D.; Costa-Garcia, A.; Anal. Chim. Acta2009, 638, 133. 47. Rao, C. N. R.; Satishkumar, B. C.; Govindaraj, A.; Nath, M.;
Chem. Phys. Chem.2001, 2, 78.
48. Baughman, R. H.; Zakhidov, A. A.; de Heer, W. A.; Science 2002, 297, 787.
49. Laviron, E.; J. Electroanal. Chem. 1979, 101, 19.
50. Miner, D. J.; Rice, J. R.; Riggin, R. M.; Kissinger, P. T.; Anal. Chem.1981, 53, 2258.
51. Gilmartin, M. A. T.; Hart, J. P.; Analyst1994, 119, 2431. 52. Felix, F. S.; Brett, C. M. A.; Angnes, L.; J. Pharm. Biomed.
Anal.2007, 43, 1622.
Submitted: April 5, 2010