Article
Printed in Brazil - ©2013 Sociedade Brasileira de Química0103 - 5053 $6.00+0.00
A
*e-mail: [email protected]
A Comparison of Amperometric and Spectrophotometric Methods for the Iodide
Concentration Measurement: a Tracer in Produced Water from Offshore Oil Reservoirs
Flávia C. Souza,a,b Davi Augusto I. da Silva,a Márcia S. Ribeiro,a Roberto B. Faria,a
Maria A. Melo,c Roberta M. M. Toledoc and Eliane D’Elia*,a
aInstituto de Química, Universidade Federal do Rio de Janeiro, Av. Athos da Silveira Ramos, 149,
Centro de Tecnologia, Bloco A, Cidade Universitária, 21941-909 Rio de Janeiro-RJ, Brazil
bInstituto Federal de Educação, Ciência e Tecnologia do Rio de Janeiro, Campus São Gonçalo,
Rua Dr. José Augusto Pereira dos Santos, s/n, CIEP 436, Neves, 24425-004 São Gonçalo-RJ, Brazil
cCentro de Pesquisas Leopoldo Américo Miguez de Mello (CENPES), Petrobras,
Av. Horácio Macedo, 950, Cidade Universitária, 21941-915 Rio de Janeiro-RJ, Brazil
Métodos amperométrico e espectrofotométrico foram desenvolvidos para determinar a concentração do traçador iodeto em água produzida de reservatórios de petróleo marítimos. O método amperométrico exibiu uma resposta linear na faixa de 1 a 10 mg L-1 com limites de
detecção e de quantificação de 0,2 e 0,6 mg L-1, respectivamente. O método espectrofotométrico
também apresentou uma resposta linear na faixa de 1 a 10 mg L-1 com limites de detecção e
de quantificação de 1 e 3 mg L-1, respectivamente. Ambos os métodos mostraram-se precisos,
lineares, homocedásticos e suas recuperações foram de 101 ± 2 e 100 ± 3%, respectivamente, enquanto que as recuperações para amostras de água produzida de reservatórios (acrescidas de iodeto) foram de 97 ± 7 e 100 ± 3%, respectivamente. Altos teores de sulfato interferem no método espectrofotométrico. Ambos os métodos são alternativas promissoras, simples e baratas à cromatografia iônica para detecção do traçador iodeto em amostras de água produzida de reservatórios de petróleo.
Amperometric and spectrophotometric methods were developed for measuring iodide tracer concentration in water produced from offshore oil reservoirs. The amperometric method exhibited a linear response from 1 to 10 mg L-1 with limits of detection and of quantification of 0.2 and
0.6 mg L-1, respectively. The spectrophotometric method also exhibited a linear response from 1 to
10 mg L-1 with limits of detection and of quantification of 1 and 3 mg L-1, respectively. Both methods
showed to be accurate, linear, homoscedastic and their recoveries were 101 ± 2 and 100 ± 3%, respectively, while the recoveries for produced reservoir water samples (fortified with iodide) were 97 ± 7 and 100 ± 3%, respectively. High amounts of sulfate interfere in the spectrophotometric method. Both methods are promising, simple and inexpensive alternatives to ion chromatography for the detection of iodide tracer in produced water reservoir samples.
Keywords: iodide, reservoir tracer, amperometry, ultramicroelectrode, spectrophotometry, produced water
Introduction
Petroleum reservoir tracers are substances that can be detected in a fluid at very low concentrations and allow for tracing the flow of water when added to the injection fluid (normally water). They can be used to monitor fluid distribution and trajectory, two parameters that are crucial for
reservoir management and evaluation of the economic and environmental impact of the petroleum production.1,2
of chemical tracers allows for larger injection volumes, permitting the use of low sensitive analytical method.3 The
iodide is an example of chemical tracer.
The development of a highly sensitive and selective method for iodide detection is a challenge because iodate and iodide are present in the ocean at ultra-trace levels together with high concentration of chloride in the matrices.4,5 The detection of iodide in seawater matrix is
further complicated by high concentrations of carbonate and sulfate and the high ionic strength of seawater. Therefore, detection methods traditionally require a preliminary separation step for iodide enrichment.
In the past two decades, ion chromatography has been increasingly used for the determination of iodide in seawater.6-9 These chromatographic methods are useful in
determining ultra-trace amounts of iodide. However, these methods often require a pre-concentration or separation step. In addition, the instruments are very expensive and costly to maintain.
Electrochemical methods are commonly used to detect and measure analytes at low concentrations without prior separation because electrochemistry is inherently sensitive and selective. By taking advantage of the electroactivity of iodide, electrochemical methods have been often used to detect iodide.10-18
The halide ions, Cl−, Br− and I−, absorb at two distinct
wavelengths at the edge of the ultraviolet (UV) spectrum, thus, UV spectrophotometry can be used to detect these ions in solution.19-21
Considering that iodide is highly soluble at low temperatures, interacts minimally with porous rock and is detectable by electrochemical methods and UV spectrophotometry, we consider that this ion is very promising to be used as a water tracer in oil reservoirs. In the present study, we use two methods, amperometric and spectrophotometric, to measure iodide at the low concentrations expected to be present in produced water considering that the injected water has been enriched with this ion.
Experimental
Electrochemical techniques
All measurements were performed using an Autolab potentiostat (model PGSTAT 100, EcoChemie) with a current amplifier module controlled by GPES 4.8 software. All experiments were carried out at 25 ºC in a Faraday cage to eliminate electrical noise.
Different electroanalytical techniques (linear, differential pulse and square wave voltammetry and
chronoamperometry) were used to study the direct oxidation of iodide on the surface of a platinum ultramicroelectrode. For all electrochemical experiments, Ag/AgCl/KCl (3 mol L-1) was used for reference and counter electrodes, and
the working electrode consisted of a homemade platinum ultramicroelectrode with a diameter of 25 µm.
Platinum ultramicroelectrodes (Pt-UME) were constructed by embedding a 25 µm diameter Pt wire (Goodfellow) in a Pyrex® glass tube with a 0.50 mm
internal diameter. The tip of the Pt ultramicroelectrodes was mechanically polished with 1500 and 2000 emery paper, and prior to each experiment, the electrode surface was electrochemically activated by cycling the potential 50 times from −0.4 to 1.75 V vs. Ag/AgCl at a scan rate of 0.5 V s-1 in a 0.5 mol L-1 sulfuric acid solution.
Characterization of the working electrode was performed in a 0.5 mol L-1 sulfuric acid solution by cycling the potential
at a scan rate of 0.5 V s-1 from −0.25 to 1.45 V vs. Ag/AgCl.
The final check of the electrode was the presence of the characteristic peaks for the adsorption and desorption of hydrogen and oxygen which occur in this potential region, as well as the peaks for the reduction and oxidation of platinum on the surface of the electrode.
Linear voltammetry were performed at a scan rate of 0.1 V s-1 from 0 to 1 V vs. Ag/AgCl. Differential pulse
voltammograms were obtained in increments of 10 mV with a 25 mV pulse amplitude and a scan rate of 20 mV s-1.
Square wave voltammograms were obtained with potential step of 5 mV, amplitude of 15 mV, frequency of 10 Hz and scan rate of 50 mV s-1. Chronoamperometry was performed
by polarizing the potential at 0.65 V vs. Ag/AgCl in 60 s time intervals.
The analytical curves were obtained from electrochemical measurements by adding known iodide standards in a 29 g L-1 chloride solution to the electrochemical cell, the
concentrations of iodide tested ranged from 1 to 10 mg L-1.
Spectrophotometric method
For the spectrophotometric measurements, a PerkinElmer LAMBDA XLS+ UV/Vis spectrophotometer was used. Scans were taken from 200 to 300 nm, and a 1 cm optical path length quartz cuvette was used. The analytic curve was obtained by plotting the maximum absorbance at 227 nm for different iodide concentrations (ranging from 1 to 10 mg L-1) in a 29 g L-1 chloride solution.
Statistical analysis
experimentally and also according to three statistical criteria: the 3σb/b, 3σb + Xb and 2σb (signal noise) values, where b is the slope of the linear calibration curve, σb is an estimate of the standard deviation of the blank samples and Xb is the average value for a blank sample. The experimental
limit of detection was obtained from the lowest current of iodide oxidation that was still significantly different from the blank. Ten blank samples were analyzed to determine the limits of detection. Grubb’s test was used to check for possible outliers, and all measurements lay within a 95% confidence interval.22,23
Analytical curves were obtained using a linear regression model to fit the data of current (amperometric method) or absorbance (spectrophotometric method) vs. known iodide standard concentrations.
Curves data were submitted to the Cochran test to determine whether the bilateral deviation of the variances was significant (5% or less). Plots of the residuals were obtained from the differences between the concentration values calculated from the linear regression line and those values obtained experimentally. The precision of both methods was statistically evaluated observing the standard deviation of several analyses (repetitivity) and comparing the analytical curves taken on different days and with different operators (intermediary precision).
The matrix effect was measured for both methods (amperometric and spectrophotometric) by comparing statistically the analytical curves obtained in synthetic chloride solution (29 g L-1) and in produced water.
The recovery study for these two methods was performed using a standard curve with the iodide content ranging from 1 to 10 mg L-1 in a chloride solution (29 g L-1), and
the sample recovery study was performed after fortifying the produced water samples with 2, 4, 6 and 8 mg L-1 of
iodide. The produced water sample used in this work was previously analyzed in duplicate by ion chromatographic technique at Petrobras to obtain reference value. This sample was also analyzed in triplicate by amperometric and spectrophotometric methods and compared with the value obtained by ion chromatography.
Interference was evaluated for both methods adding 1000 mg L-1 of different anions (sulfate, chloride, bromide,
fluoride and iodide).
Results and Discussion
Electrochemical analysis
Iodide content was electrochemically determined in water samples via oxidation on the platinum ultramicroelectrode surface. The iodide oxidation on the
electrode surface generates an anodic current that can be related to the iodide concentration in the medium.
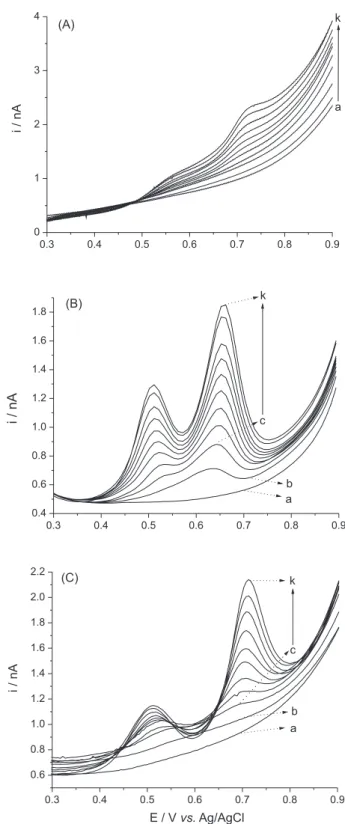
Figure 1 shows the linear voltammograms, differential pulse voltammograms and square wave voltammograms obtained for iodide oxidation on the platinum UME.
F i g u re 1 . Linear voltammograms (A), differential pulse
voltammograms (B) and square wave voltammograms (C) recorded using different concentrations of iodide in a 24 g L-1 chloride solution: (a) blank,
As observed in the voltammograms in Figure 1A, the anodic current shows a more markedly increase at a potential of approximately 0.5 V vs. Ag/AgCl. For iodide concentrations higher than 5 mg L-1, it can be seen another
evident increase in the anodic current at approximately 0.7 V vs. Ag/AgCl. Hanson and Tobias24 investigated the
oxidation of iodide by cyclic voltammetry using platinum as the working electrode. The authors suggested that the oxidation sequence of iodide can be represented by the following equations:
3I−→ I
3− + 2e− (1)
2I3−→ 3I2+ 2e− (2)
This mechanism was confirmedusing UV-Vis
spectroscopy in conjunction with cyclic voltammetry experiments. These two oxidation steps are easer seen in Figures 1B and 1C in which the results from differential pulse voltammetry and square wave voltammetry were shown, respectively.
Figure 2 shows the results of the chronoamperometry experiments in which the determination of the iodide content was electrochemically investigated. As iodide is oxidized upon applying a potential of 0.65 V vs. Ag/AgCl, the anodic current increased as more iodide was added to the electrochemical cell. The increase in the current permitted the construction of an analytical curve of current vs. iodide concentration with linear correlation coefficient of 0.9944.
The relationship between the anodic current and iodide concentration was examined for each electroanalytical technique. Table 1 shows the slopes and linear correlation coefficients (r) obtained for each technique. These results
demonstrate that the platinum ultramicroelectrode is appropriate for the quantification of iodide. Although excellent linearity was exhibited for all techniques, it was revealed chronoamperometry as the better technique for this type of analysis because it is more sensitive (i.e., the analytical curve exhibits a higher slope) compared to the other techniques.
The recovery for the detection of iodide in solution (in the range of 1 to 10 mg L-1) via the amperometric method
was approximately 101 ± 2%, as observed in Table 2.
The recovery obtained for the detection of iodide in produced water samples fortified with 2, 4, 6 and 8 mg L-1
of iodide via amperometry was 97 ± 7%, as shown in Table 3. These results indicate that there is no matrix effect in the iodide recovery in this kind of sample.
Statistical studies were used to determine the limits of detection and of quantification for the amperometric method. Calculated values for iodide concentrations were compared with values obtained experimentally, as shown in Table 4. The experimental limit of detection equal to 0.2 mg L-1 (1.6 µmol L-1) of our method is five times greater
than the obtained using a gold nanoelectrode (0.3 µmol L-1),
Table 1. Slopes and linear correlation coefficients obtained from
linear voltammetry, differential pulse voltammetry, square wave voltammetry and amperometry
Technique (A L mgSlope / -1) Linear correlation coefficient (r)
Linear voltammetry 1.22 × 10⁻¹⁰ 0.9989
Square wave voltammetry 1.18 × 10⁻¹⁰ 0.9970
Differential pulse voltammetry 1.27 × 10⁻¹⁰ 0.9968
Chronoamperometry 2.22 × 10⁻¹⁰ 0.9944
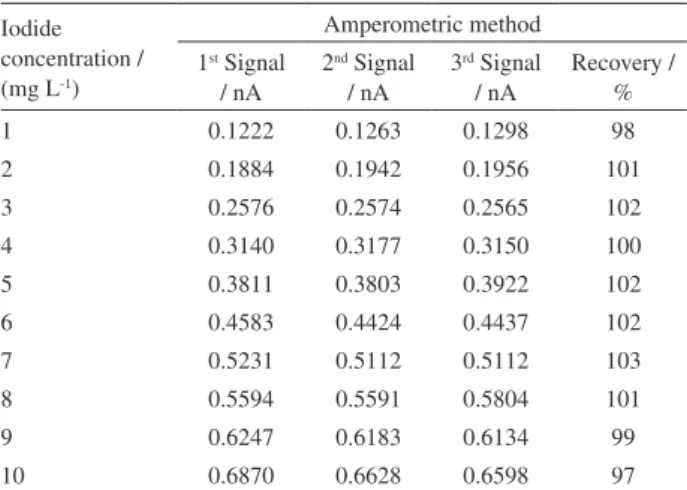
Table 2. Recovery results obtained for the amperometric quantification
of iodide
Iodide concentration / (mg L-1)
Amperometric method 1st Signal
/ nA
2nd Signal
/ nA
3rd Signal
/ nA
Recovery / %
1 0.1222 0.1263 0.1298 98
2 0.1884 0.1942 0.1956 101
3 0.2576 0.2574 0.2565 102
4 0.3140 0.3177 0.3150 100
5 0.3811 0.3803 0.3922 102
6 0.4583 0.4424 0.4437 102
7 0.5231 0.5112 0.5112 103
8 0.5594 0.5591 0.5804 101
9 0.6247 0.6183 0.6134 99
10 0.6870 0.6628 0.6598 97
Figure 2. Chronoamperograms recorded with different concentrations of iodide in a 29 g L-1 chloride solution at 0.65 V vs. Ag/AgCl: (a) blank, (b) 1,
which is one of the best electrochemical method in the literature.18
The analytical curve obtained from the results shown in Figure 2 was submitted to the Cochran test to determine whether the bilateral deviation of the variances was significant (less than or equal to 5%) and the Cochran value (0.2041) was calculated to be lower than the tabulated value (0.4027). This result indicates a homogeneous variance in the response (in the current) with respect to analyte concentration, indicating homoscedastic behavior. The plot of the residuals via the amperometric method showed that there is a linear correlation between the measured signals and iodide concentration as the residues do not exceed 0.03 nA, a value well below the value obtained with blank samples.
The precision (repetitivity) of the amperometric method (Table 2) is acceptable and indicates good reproducibility.
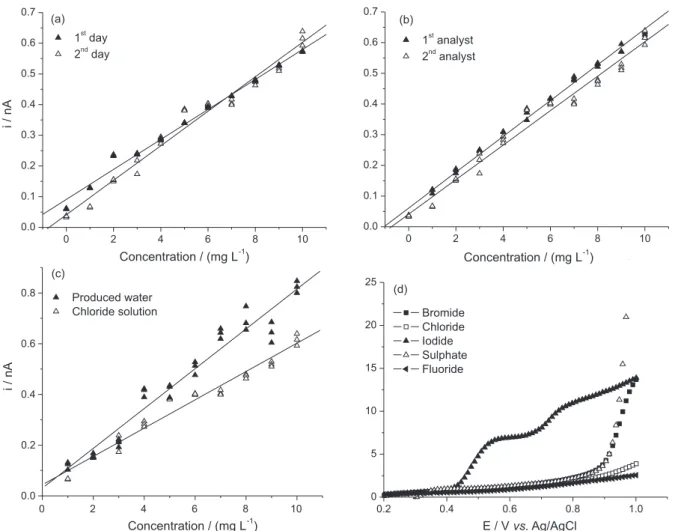
The variances obtained from the amperometric analytical curves for different days (Figure 3a) give a calculated F-value (3.71) lower than the critical F-value (6.54 bilateral) for a 99% confidence level, indicating equal variances. The analytical curve slopes were also compared, the calculated t-value (1.02) is lower than the critical t-value (2.92 bilateral) for a 99% confidence level, indicating equal slopes for these two curves. In
comparing the variances of analytical curves obtained by different operators via amperometry (Figure 3b), it was observed that the calculated F-value (5.89) is lower than the critical F-value (6.54 bilateral) for a 99% confidence interval, indicating that the hypothesis was accepted and that the variances are equal. The analytical curve slopes prepared by different operators were also compared; the calculated t-value (0.11) is lower than the critical t-value (2.92 bilateral) for a 99% confidence level, meaning that the slopes for these two curves are equal. Because the analytical curves obtained on different days and by different operators are statistically equal, we concluded that the amperometric method is precise.
The matrix effect, by amperometry, in the method sensitivity was evaluated by comparing the analytical curves obtained in a real produced water sample and in a 29 g L-1 chloride solution (Figure 3c). Comparing the
variances obtained by amperometry, we can see that the calculated F-value (3.03) is lower than the critical F-value (6.54 bilateral) for a 99% confidence level, indicating that the hypothesis was accepted and the variances are equal. The analytical curve slopes were also compared, and it was observed that the calculated t-value (1.78) is lower than the critical t-value (2.92 bilateral) for a 99% confidence level, indicating that the slopes for these two curves are equal and there is no matrix effect in the amperometric method sensitivity.
The interference on the linear voltammetry electrochemical signal from anions such as chloride, bromide, fluoride and sulfate was studied based on the sea water composition (Figure 3d). At a potential of 0.65 V vs. Ag/AgCl, there is no electroactivity from these anions, indicating that the amperometric detection of iodide is selective for iodide alone.
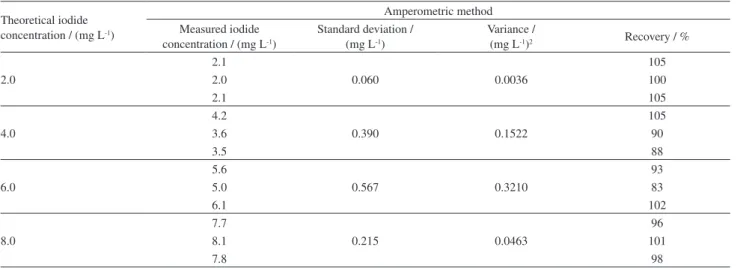
Table 3. Recovery results obtained for the amperometric quantification of iodide in produced water samples
Theoretical iodide concentration / (mg L-1)
Amperometric method Measured iodide
concentration / (mg L-1)
Standard deviation / (mg L-1)
Variance /
(mg L-1)2 Recovery / %
2.0
2.1
0.060 0.0036
105
2.0 100
2.1 105
4.0
4.2
0.390 0.1522
105
3.6 90
3.5 88
6.0
5.6
0.567 0.3210
93
5.0 83
6.1 102
8.0
7.7
0.215 0.0463
96
8.1 101
7.8 98
Table 4. Limits of detection (LOD) and of quantification (LOQ) for the
amperometric detection of iodide in solution
Criterion LOD / (mg L-1) LOQ / (mg L-1)
3σ and 10σ 0.2 1.4
Slope 0.5 1.5
Signal/Noise (2:1) 0.5 1.6
Spectrophotometric analysis
The concentration of iodide solutions was also evaluated spectrophotometrically as observed in Figure 4. Wavelength scans were performed in a spectrophotometer, and the maximum absorbance was observed at a wavelength of 227 nm. The optical density values at 227 nm obtained for different iodide concentrations were used to construct the analytical curve with linear correlation coefficient of 0.9983. The iodide molar absorption coefficient at the λmax = 227 nm was evaluated from the slope of the analytical curve shown in Figure 5b. The obtained experimental value (1.22 × 10⁴ L mol-1 cm-1) is very close to the literature
values of 1.438 × 10⁴ L mol-1 cm-1 at λ
max = 225 nm20 and
1.34 × 10⁴ L mol-1 cm-1 at λ
max = 226 nm.21
The recovery for the detection of iodide in solution (in the range of 1 to 10 mg L-1) via the spectrophotometric
method was approximately 100 ± 3%, as observed in Table 5.
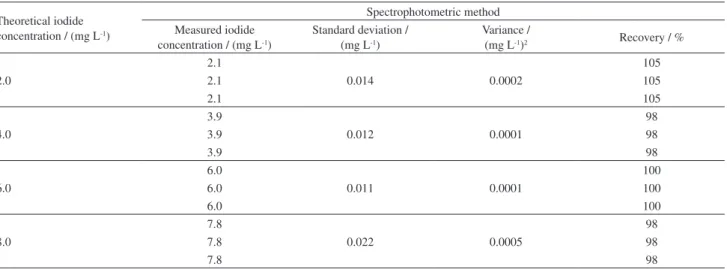
The recovery obtained for the detection of iodide in produced water samples fortified with 2, 4, 6 and 8 mg L-1
of iodide via spectrophotometry was 100 ± 3%, as shown in Table 6. These results indicate that there is no matrix effect in the iodide recovery in this kind of sample.
Figure 3. Intermediate precision study for the amperometric method: (a) analytical curves obtained on different days, (b) analytical curves obtained by different operators, (c) analytical curves constructed in different matrices and the (d) anion interference study.
Figure 4. UV-Vis spectra of iodide aqueous solutions containing 29 g L-1
Statistical studies were used to determine the limits of detection and of quantification for the spectrophotometric method. Calculated values for iodide concentrations were compared with the values experimentally obtained, as shown in Table 7. The amperometric method exhibited a
lower limits of detection based on all criteria and proved to be the most sensitive technique.
The analytical curve obtained from the results shown in Figure 4 was submitted to the Cochran test to determine whether the bilateral deviation of the variances was significant (less than or equal to 5%). For the spectrophotometric method, the Cochran value (0.1208) was lower than the tabulated value (0.4450). This result indicates a homogeneous variance in the response (in absorbance) with respect to analyte concentration, indicating a homoscedastic behavior. The plot of the residuals via the spectrophotometric method showed that there is a linear correlation between the measured signals and iodide concentration as the residues do not exceed 0.05 for the spectrophotometric method, value which is well below the values obtained with blank samples.
The precision (repetitivity) of the spectrophotometric method (see in Table 5) is acceptable and indicates good reproducibility.
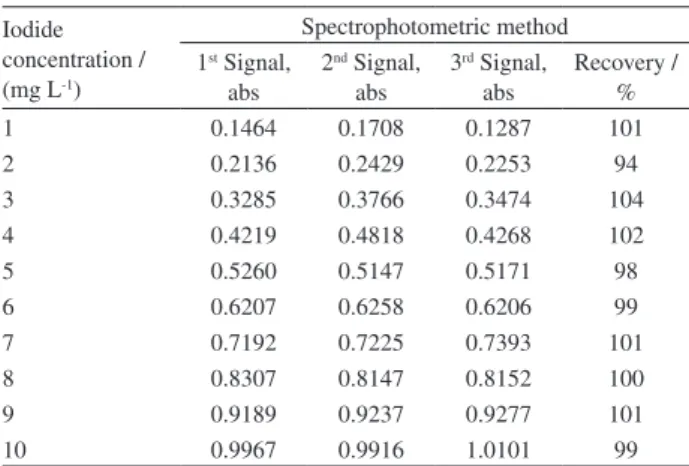
Intermediary precision was also evaluated for the spectrophotometric detection of iodide. In comparison with Table 5. Recovery results obtained for the spectrophotometric
quantification of iodide
Iodide concentration / (mg L-1)
Spectrophotometric method 1st Signal,
abs
2nd Signal,
abs
3rd Signal,
abs
Recovery / %
1 0.1464 0.1708 0.1287 101
2 0.2136 0.2429 0.2253 94
3 0.3285 0.3766 0.3474 104
4 0.4219 0.4818 0.4268 102
5 0.5260 0.5147 0.5171 98
6 0.6207 0.6258 0.6206 99
7 0.7192 0.7225 0.7393 101
8 0.8307 0.8147 0.8152 100
9 0.9189 0.9237 0.9277 101
10 0.9967 0.9916 1.0101 99
Table 7. Limits of detection (LOD) and of quantification (LOQ) for the
spectrophotometric detection of iodide in solution
Criterion LOD / (mg L-1) LOQ / (mg L-1)
3σ and 10σ 1.3 3.9
Slope 1.1 3.4
Signal/Noise (2:1) 0.8 3.4
Experimental 1.0 3.0
variances for analytical curves obtained on different days (Figure 5a), it was observed that the calculated F-value (1.64) is lower than the critical F-value (6.54 bilateral) for a 99% confidence level, indicating that the hypothesis was accepted and the variances are equal. The analytical curves were also compared; the calculated t-value (1.50) is lower than the critical t-value (2.92) for a 99% confidence level, indicating that the slopes for these two curves are equal. In comparison with the spectrophotometric analytical curves obtained by different operators (Figure 5b), it was observed that the calculated F-value (4.20) is lower than the critical F-value (6.54 bilateral) for a 99% confidence level, indicating that the hypothesis was accepted and the variances are equal. The analytical curve slopes were also compared; the calculated t-value (0.08) is lower than the critical t-value (2.92 bilateral) for a 99% confidence level, indicating that the slopes for these two curves are equal. Like the results obtained for the statistical analysis of the amperometric method, a statistical analysis of results obtained via the spectrophotometric method showed that the analytical curves obtained on different days and by different operators are statistically equal showing to be precise.
There is no matrix effect in the spectrophotometric method sensitivity either because the variances obtained
for the analytical curves in real produced water sample and in 29 g L-1 chloride solution (Figure 5c) are equal. The
calculated F-value (4.33) is lower than the critical F-value (6.54 bilateral) for a 99% confidence level, indicating that the hypothesis is accepted. In addition, the calculated t-value (0.80) is lower than the critical t-value (2.92 bilateral) for a 99% confidence level, indicating that the slopes for these two curves are equal.
The anion interference in the spectrophotometric method from chloride, bromide, fluoride and sulfate was also evaluated at 227 nm based on the seawater composition (Figure 5d). As observed in Figure 5d, only sulfate causes potential interference for samples with high sulfate content. Other species, for example, Fe(II), sulfur dioxide and thiocyanate may also interfere with the results, but these were not investigated.
Comparison of methods
The iodide content of the real produced water sample analyzed by ion chromatography was 1.74 ± 0.06 mg L-1.
Despite the fact that the methods presented here are not intended to measure the iodide content in produced water without the addition of iodide as a tracer component, we have performed a comparative analysis of the amperometric and spectrophotometric methods using these unspiked samples, since these samples might be considered a low iodide content challenge for these methods. The amperometric and spectrophotometric analyses of this sample showed 1.59 ± 0.04 and 1.92 ± 0.03 mg L-1 of iodide, respectively.
Comparing the averages obtained by amperometry and ion chromatography, the calculated t-value (3.31) was found to be lower than critical t-value (4.54) for 99% confidence level, indicating that the hypothesis was accepted and the Table 6. Recovery results obtained for the spectrophotometric quantification of iodide in produced water samples
Theoretical iodide concentration / (mg L-1)
Spectrophotometric method Measured iodide
concentration / (mg L-1)
Standard deviation / (mg L-1)
Variance /
(mg L-1)2 Recovery / %
2.0
2.1
0.014 0.0002
105
2.1 105
2.1 105
4.0
3.9
0.012 0.0001
98
3.9 98
3.9 98
6.0
6.0
0.011 0.0001
100
6.0 100
6.0 100
8.0
7.8
0.022 0.0005
98
7.8 98
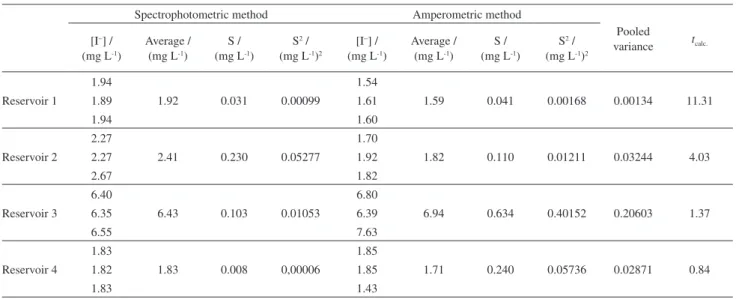
Table 8. Analysis of reservoir produced water samples by spectrophotometry and amperometry
Spectrophotometric method Amperometric method
Pooled
variance tcalc.
[I−] /
(mg L-1)
Average / (mg L-1)
S / (mg L-1)
S2 /
(mg L-1)2
[I−] /
(mg L-1)
Average / (mg L-1)
S / (mg L-1)
S2 /
(mg L-1)2
Reservoir 1
1.94
1.92 0.031 0.00099
1.54
1.59 0.041 0.00168 0.00134 11.31
1.89 1.61
1.94 1.60
Reservoir 2
2.27
2.41 0.230 0.05277
1.70
1.82 0.110 0.01211 0.03244 4.03
2.27 1.92
2.67 1.82
Reservoir 3
6.40
6.43 0.103 0.01053
6.80
6.94 0.634 0.40152 0.20603 1.37
6.35 6.39
6.55 7.63
Reservoir 4
1.83
1.83 0.008 0,00006
1.85
1.71 0.240 0.05736 0.02871 0.84
1.82 1.85
1.83 1.43
Critical t-value (3.75), S: Standard deviation, S2: Variance.
averages were equal. Comparing the averages obtained by spectrophotometry and ion chromatography, the calculated t-value (4.40) was found to be lower than critical t-value (4.54) for 99% confidence level, indicating that the hypothesis was accepted and the averages were equal.
Another three produced water samples were analyzed by amperometric and spectrophotometric methods. Iodide content could not be quantified in these samples by ion chromatography due to the high amount of salts (including chloride salts, the main interference in ion chromatography analysis). Table 8 shows the results of the iodide content from different reservoir produced water samples with the average, the standard deviation and variance. Among the analyzed reservoir produced water samples, two of them (reservoirs 1 and 2) showed that the calculated t-value is less than the critical t-value (3.75), indicating that both methods are similar. Only two samples presented different iodide contents. This result could be explained by the presence of sulfate ion in the samples, which is an interfering anion in spectrophotometric method.
The analyses of different reservoir produced water samples showed good correlation between the amperometric and spectrophotometric methods for iodide content determination with a slope of 1.18 and a good linear correlation with r = 0.9894.
Conclusions
Amperometric and spectrophotometric methods were developed separately for the quantification of iodide tracer in produced water from offshore oil reservoirs. The results obtained in this study suggest that these methods
exhibit a good signal-to-noise ratio, linearity, short response time, low limit of detection and good sensitivity. The amperometric and spectrophotometric detection of iodide in synthetic samples allowed for the detection of low concentrations of iodide (1 to 10 mg L-1). The
amperometric and spectrophotometric methods exhibited limits of detection of 0.2 and 1.0 mg L-1, respectively, and
the linear correlation coefficients for each method were 0.9944 and 0.9983, respectively. The amperometric method exhibited a lower limit of detection based on all criteria and proved to be the most sensitive technique. Data obtained via both methods proved to be precise, linear and homoscedastic and showed no matrix effect in the sensitivity of both studied methods.
The recovery obtained for the amperometric and spectrophotometric methods were 101 ± 2 and 100 ± 3%, respectively, while the recovery for produced water samples fortified with iodide were 97 ± 7 and 100 ± 3%, respectively.
A produced water sample was analyzed by amperometric and spectrophotometric methods obtaining 1.59 ± 0.04 and 1.92 ± 0.03 mg L-1 of iodide, respectively.
Good correlation was found between the result obtained from these two methods and that from the ion chromatography technique for this kind of sample.
Acknowledgements
References
1. Leibundgut, C.; Seibert, J. In Treatise on Water Science, 1st ed.;
Wilderer P., ed.; Elsevier: Germany, 2011.
2. Melo, M. A.; Holleben, C. R.; Almeida, A. R.; Soc. Petrol. Eng. J., Document ID: 69474-MS in SPE Latin American and
Caribbean Petroleum Engineering Conference, Buenos Aires, Argentina, 2001.
3. Silva, L. L.; Donnici, C. L.; Ayala, J. D.; Freitas, C. H.; Moreira, R. M.; Pinto, A. M. F.; Quim. Nova2009, 32, 1576.
4. Smith, J. D.; Butler, E. C. V.; Airey, D.; Sandars, G.; Mar. Chem. 1990, 28, 353.
5. Truesdale, V. W.; Upstill-Goddard, R.; Estuarine Coastal Shelf. Sci.2003, 56, 261.
6. Ito, K.; Anal. Chem. 1997, 69, 3628. 7. Ito, K.; J. Chromatogr., A1999, 830, 211.
8. Bruggink, C.; van Rossum, W. J. M.; Spijkerman, E.; van Beelen, E. S. E.; J. Chromatogr., A2007, 1144, 170.
9. Rebary, B.; Paul, P.; Ghosh, P. K.; Food Chem.2010, 123, 529. 10. Luther, G. W.; Swartz, C. B.; Ullman, W. J.; Anal. Chem.1988,
60, 1721.
11. Tian, R. C.; Nicolas, E.; Mar. Chem.1995, 48, 151.
12. Švancara, I.; Ogorevc, B.; Nović, M.;,Vytřas, K.; Anal. Bioanal. Chem.2002, 372, 795.
13. Chailapakul, O.; Amatatongchai, M.; Wilairat, P.; Grudpan, K.; Nacapricha, D.; Talanta2004, 64, 1253.
14. Johnson, D. C.; Ryan, M. D.; Wilson, G. S.; Anal. Chem.1988,
60, 147R.
15. Malinski, T.; Taha, Z.; Nature1992, 358, 676.
16. Souza, F. C.; Rocha, J. C.; Vieira, E. C.; Machado, S. A. S.; D’Elia, E.; Electroanal.2009, 21, 2277.
17. Tomčík, P.; Bustin, D.; Fresenius J. Anal. Chem.2001, 371,
562.
18. Pereira, F. C.; Moretto, L. M.; De Leo, M.; Zanoni, M. V. B.; Ugo, P.; Anal. Chim. Acta2006, 575, 16.
19. Blandamer, M. J.; Fox, M. F.; Chem. Rev.1970, 70, 59.
20. Yong-Ju, W.; Cui-Ge, L.; Li-Ping, M.; Spectrosc. Spect. Anal. 2005, 25, 86.
21. Beckwith, R. C.; Margerum, D. W.; Inorg. Chem.1997, 36, 3754.
22. Massart, D. L.; Vandeginste, B. G. M.; Buydens, L. M. C.; Jong, S. D.; Lewi, P. J.; Smeyers-Verbeke, J. In Handbook of Chemometrics and Qualimetrics: Part A, vol. 20A; Vandeginste, B. G. M.; Rutan, S. C., eds.; Elsevier: New York, USA, 1997. 23. Miller, J. C.; Miller, J. N.; Statistics for Analytical Chemistry,
3rd ed.; Prentice Hall: New York, USA, 1993.
24. Hanson, K. J.; Tobias, C. W.; J. Electrochem. Soc.1987, 134, 2204.
Submitted: July 10, 2013