0103 - 5053 $6.00+0.00
A
r
ti
c
le
* e-mail: [email protected]
Multi-Wavelength Spectrophotometric Determination of Propofol Acidity
Constant in Different Acetonitrile-Water Mixtures
Diego Pissinis, Leónides E. Sereno and Juan M. Marioli*
Departamento de Química, Facultad de Ciencias Exactas, Físico, Químicas y Naturales, Universidad Nacional de Río Cuarto, ruta 36 km 601, X5804BYA Río Cuarto, Argentina
A constante ácido-base de uma droga anestésica, propofol, foi determinada em diferentes misturas acetonitrila-água usando-se dados de titulação espectrofotométrica multivariada. Os valores de pH medidos com eletrodo de vidro calibrado com tampão aquoso, nas misturas acetonitrila-água, s
wpH, foram corrigidos para obter-se o s
spH, que é o pH da mistura acetronitrila-água medido com eletrodo de vidro, calibrado com tampão na mesma mistura de solvente. Essa escala de pH está diretamente relacionada com a constante termodinâmica ácido-base. O valor de pKa do propofol encontrado em água é de 11,67. Relações lineares foram observadas quando os valores calculados de pKa do propofol, em diferentes misturas de solvente, foram comparados com a fração molar de acetonitrila. Uma relação linear foi também encontrada entre os valores de pKa e a permissividade relativa recíproca da mistura de solventes, 1/ε. Este comportamento foi considerado como indicativo da natureza eletrostática do processo de ionização.
The acid-base constant of an anaesthetic drug, propofol, was determined in different acetonitrile-water mixtures by using multiwavelength spectrophotometric titration data. The pH values measured in acetonitrile-water mixtures with a glass electrode calibrated with an aqueous buffer, s
wpH, were corrected to obtain s
spH, that is, the pH of the acetonitrile-water mixture as measured with a glass electrode calibrated with a buffer in the same solvent mixture. This last pH scale is directly related to the thermodynamic acid-base constant. The pKa value of propofol in pure water was found to be 11.67. Linear relationships were observed when the calculated pKa values of propofol in different solvent mixtures were plotted against the acetonitrile molar fraction. Also, a linear relationship was observed between pKa values and the reciprocal of the relative permittivity of the solvent mixture, 1/ε. This behavior was taken as indicative of the electrostatic nature of the ionization process.
Keywords: propofol, spectrophotometric titrations, acidity constant, solvent mixtures
Introduction
Propofol (2,6-diisopropylphenol, AH in Scheme 1) is a short acting intravenous administered anaesthetic largely used for induction and maintenance of anaesthesia in human and veterinary medical practice.1 Propofol has two
important advantages as an anaesthetic: a short induction period and a relatively short and predictable action.2
Moreover, the pharmacokinetic profile of propofol is unique as compared with other anaesthetics. Its rapid metabolism and large distribution clearence relative to distribution volume result in a unique disposition that is well suited to both the induction and maintenance of anaesthesia.3 Given the widespread use of propofol, precise
analytical methods are required to monitor its concentration in body fluids.
A variety of methods have been published describing the assay of propofol in plasma, blood or serum. These procedures have generally employed reversed phase High Performance Liquid Chromatography (RP-HPLC) with either UV,4 fluorimetric5-7 or electrochemical8, 9 detection
techniques. The mobile phase was usually composed of a relatively high proportion of an organic solvent (e. g. acetonitrile or methanol) and an acidic aqueous buffer in
order to elute propofol from the column in a few minutes. The low pH of the buffer was intended to keep propofol in its neutral form given that this compound may be ionized at high pHs.
Retention of acidic as well as basic analytes is strongly influenced by the pH of the mobile phase.10,11 The
knowledge of the acid-base dissociation constants of the chemical groups in the analytes is very important in predicting the influence of pH on retention and selectivity in HPLC. Also, the pH of the mobile phase must be known to avoid misunderstanding the results. These conditions raise questions on how the pH of the mobile phase is determined and what is the pKa value of the analytes in the different organic-aqueous buffer mixtures employed.
Hydrogen ion activity in the mobile phase is a key value for predicting retention, as well as both column and sample stability.12 It is a common practice for many
chromatographers to prepare the aqueous buffer and then to add the organic modifier. In these instances the pH measurement made in the aqueous buffer cannot be used to calculate an absolute hydrogen ion activity in the organic-modified mobile phase. The change in hydrogen ion activity following the addition of the organic modifier could be one or two orders of magnitude. Thus, it is recommended to measure the pH of the mobile phase after the addition of the organic modifier in order to obtain better relationships between retention and mobile-phase pH.13,14
On the other hand, the pKa of the analyte is affected by the relative permittivity of the mobile phase.13 This last
parameter is different for each different mixture of organic modifier-aqueous buffer. Dissociation of substances in acetonitrile-water mixtures is ruled by electrostatic interactions, as well as specific solvent-solute interactions (solvation effects). In the dissociation of neutral or anion acids, charges are created and the dissociation process is disturbed when the relative permittivity of the medium decreases with the increase in acetonitrile content (acetonitrile has a lower relative permittivity than water, i. e. 38.8 at 20 ºC15 and 78.5 at 25 ºC16, respectively). Hence,
for the dissociation of phenolic protons, the electrostatic interaction overwhelm the specific solvation and the pKa increases with the percentage of acetonitrile in the mixture.17
Several methodologies have been proposed for the determination of ionization constants. Capillary electrophoresis, liquid chromatography, potentiometry and UV-Visible spectrophotometry are frequently used for the determination of pKa values of substances.18 Capillary
electrophoresis has been recently introduced as a method for the determination of the pKa value of substances. The
advantages attributed to the capillary electrophoretic determination of pKa values are the small amounts of solute samples at low concentration used, and the fact that it does not require the measurement of solute or titrant concentrations.19 On the other hand, the potentiometric
titration of a sparingly soluble compound poses a challenging problem for this methodology given its restricted accuracy when the concentration of the analytes
is lower than approximately 10-4 mol L-1.20
Spectrophotometry is an attractive method for pKa determination provided that the compound possesses pH-dependent light absorption. Computer programs using data from multiwavelength spectrophotometry are frequently used for the determination of acid dissociation constants.21-24 These programs often use Principal
Component Analysis and Target Factor Analysis to analyze two- and three-component kinetic systems, and the analyte concentrations are calculated by solving the simultaneous equations of mass balance.
In this work we use bilinear regression25 to analyze the
spectral data from the acid-base titration of propofol in various acetonitrile-water (ACN-water) mixtures. Bilinear regression of spectrally-resolved kinetic data and time-resolved spectra was successfully applied to the disproportionation of aqueous solutions of triphenyltetrazolium chloride studied by flash photolysis at room temperature.26 The program allowed us to calculate
the concentration of species at each pH for a given ACN-water mixture, and the pKa of propofol in each mixture was easily computed by using those concentrations and the Henderson-Hasselbalch buffer equation. The mole fraction of ACN in the mixtures was varied from approximately 0.035 to 0.260, and the pH between approximately 8 to 13.5. The pKa value of propofol in pure water was found to be 11.65, increasing linearly with the percentage of ACN in the mixture.
Experimental
Chemicals
Propofol was purchased from Aldrich (USA). Hydrochloric acid, acetonitrile (HPLC grade) and sodium hydroxide were purchased from Merck (Argentina). Solutions were prepared in HPLC grade water. Sodium chloride (Merck, Argentina) was added to control the ionic strength of water. HPLC quality water was obtained from a Labconco (USA) WaterPro Mobile reverse osmosis system. The initial solvent was composed of 0.01 mol L-1 HCl,
0.1 mol L-1 NaCl (ionic strength 0.11) dissolved in water
then added to this solvent until its concentration was 5.0x10⁻⁴ mol L-1. The titration of propofol in the different
solvent mixtures was accomplished by adding a carbonate free sodium hydroxide solution to the initial propofol solution until the desired s
w pH value was obtained (the
meaning of s
w pH and s
s pH is discussed in the section
Titration of propofol in different acetonitrile-water mixtures). s
w pH values were read as a function of time. After
attaining a constant and stable s
w pH value (usually within
three minutes) this value was taken as the final s
w pH of the
solution, and the propofol spectrum was recorded. Carbonate free sodium hydroxide was obtained from a 50% m/v solution of NaOH (Sigma, Argentina).
Instrumentation
pH measurements were carried out on a Orion 720A (USA) pH-meter provided with a Ross Combination Electrode Orion 8102 SC, with a precision of ±0.002 pH units. The alkaline error of the electrode, as informed in its instruction manual, was less than 0.01 pH units at pH around 14 under the experimental conditions used in this work. Calibration of the pH-meter was accomplished by using fresh aqueous buffers and a two points calibration method. The temperature was maintained at 298.0±0.2 K with a MGW Lauda model K4R Electronic thermostatized bath. The titrations were performed by using a high-precision automatic burette Schott-Gerate (Great Lakes Instruments, Inc., USA) and a 1 μL microsyringe (Hamilton, USA).
Spectra were obtained with a Hewlett-Packard (USA) model 8453 UV-visible spectrophotometer controlled by a Hewlett-Packard (USA) Kayak XA computer. Spectral data were processed in a PC compatible computer by the software BILINEAR, kindly provided by Prof. San Román. Oxygen dissolved in the solutions was removed by bubbling high purity nitrogen. A nitrogen atmosphere was kept over the solutions throughout the experiments.
Data processing
In a spectrophotometric titration the spectral data obtained is a series of spectra acquired at different pH values. Thus, according to the Beer-Lambert law, absorbance per unit pathlength is given by:
(1)
where the absorption coefficient of species i, εi, is a
continuous function of wavelength, λ; and the
concentration of species i, ci, is a function of pH. The
spectral data processing program BILINEAR handles both
λ and pH as discrete variables indexed as λj and pHk. Therefore, the absorbance is expressed by way of both indexes as:
(2)
The problem can be easily handled using matrix algebra. Thus, equation (2) can be expressed in matrix form as:
|ajk| = |εji| |cik| (3)
The bilinear form of equation (2) can be considered as a linear function of concentrations at constant wavelength or of absorption coefficients at constant pH. Random errors of bilinear form as (2) or its matrix equivalent (3) may be minimized by the alternating calculus of the matrices |εεεεε| and |c| by multiple linear regression analysis. An initial value is assigned to either the |εεεεε| or |c| matrix; a least-squares condition is then applied to calculate a resulting
|εεεεε| or |c| matrix, and the process is iteratively repeated
until convergence is achieved. The procedure also serves as an internal check for the validity of the experimental matrix |a|.25
Propofol has, in principle, two species at any given pH (the anionic and the neutral form in Scheme 1). Its mass balance can be written as:
(4)
where C0 stands for the total molar concentration of
propofol, and CA- and CAH represent the molar concentration of the dissociated and undissociated propofol species, respectively.
The resolution of equation (2) or its matrix equivalent (3) allowed us to calculate the concentrations of these species. Then, the pKa value of propofol at each particular solvent mixture was easily computed from the Henderson-Hasselbalch buffer equation.
Results and Discussion
Titration of propofol in water
The titration of propofol in water was performed beginning from the initial wwpH of approximately 2 to nearly
14. The spectra of propofol in solutions of wwpH below 9
phenolic compounds, particularly those with electron-donor substituents. The spectra of propofol remains unchanged when the wwpH of the solution is below 9. A
spectrum of propofol obtained at wwpH 8.08 (spectrum a in
Figure 1) is shown as an example. Propofol is expected to be mostly in its undissociated form at this wwpH value.
The wwpH of the propofol solution was then raised to
10.45, and a new spectra was taken (spectra b in Figure 1). The development of two new absorption waves was the main effect produced in the spectra by the increment of
w
wpH. The short-wavelength absorption wave began to
develop between 235 and 250 nm, while the long-wavelength absorption wave began to develop between 285 nm and 305 nm. These two waves are characteristic of the dissociated phenol molecule.
Propofol titration was then continued, and more spectra were taken. Figure 1 shows representative spectra of propofol at wwpH 11.69, 12,69, and 13.65 (traces c, d, and e,
respectively). The waves at around 240 nm and 290 nm increased their absorbance until they reached a maximum absorbance value. Successive increases in wwpH did not
affect significantly the spectra of propofol, as shown in Figure 1 (see for example traces d and e). This behavior indicates that the anionic form of propofol may have reached its maximum concentration.
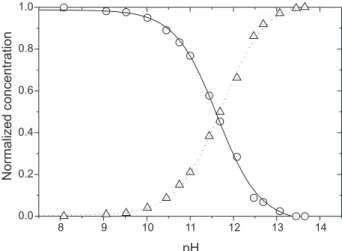
The concentration of the neutral and anionic species of propofol could be computed with the aid of BILINEAR. Thus, the |c| matrix was optimized to fit the experimental results by iterative linear regression. As a result, the concentration for both the anionic and the neutral species were calculated for each wwpH of the aqueous solution. These
concentrations are shown in Figure 2 as normalized concentrations.
The pKa value for propofol could then be calculated for each solution wwpH by using the Henderson-Hasselbalch
buffer equation and the computed concentrations of the dissociated and undissociated species. Thus, a set of pKa values was obtained, and the outliers were removed by using the test of Grubbs.27 The mean pK
a value determined
for propofol in water was 11.49±0.02 for a confidence interval of 95%. This value allowed us to back-compute the concentrations of the anionic and neutral forms of propofol, which are shown in Figure 2 as a solid line (neutral form) and a dashed line (anionic form). It is clear from Figure 2 that the concentrations computed by using this pKa value have a good fit with the concentrations calculated using BILINEAR. Thus, the value of 11.49±0.02 was taken as the best approximation to the pKa value of propofol in water at 298 K. This number is close to the value of 11 informed in the literature by others authors.28
Titration of propofol in different acetonitrile-water mixtures
At this point, some considerations may be made about the pH value measured in an aqueous-organic solvent mixture. Since pH is defined in terms of hydrogen ion activity, it depends not only on the concentration scale used but also on the standard state of activity chosen. In water, the standard state for the hydrogen ion activity (aH) is infinite dilution in water, for which γH → 1. On the other hand, two different standard states can be chosen in an aqueous-organic solvent mixture. One is infinite dilution of the ion in the aqueous-organic solvent mixture (solvent s), and the other is infinite dilution of the ion in water (solvent w). This leads to two different pH scales, one relative to each particular solvent mixture and the other relative to water. IUPAC29 recommends the notation
Figure 1. Spectra of propofol in water at different pH. pH: (a) 8.08; (b) 10.45; (c) 11.69; (d) 12.69; (e) 13.65. Propofol concentration: 5.0x10⁻⁴ mol L-1.
proposed by Robinson and Stokes to distinguish between the two pH scales, that is, lower-case left-hand superscripts indicate the solvent (w or s) in which the measurements are being made; lower-case left-hand subscripts indicate the solvent in which the ionic activity coefficient, γ, is referred to unity at infinite dilution (w or s). Thus, sspH
stands for a pH value measured in solvent s and referred to the solvent s standard state, and s
wpH stands for a pH value
measured in solvent s and referred to the aqueous standard state. These two pH scales differ in the primary medium effect for the transfer of the H+ ion from water (w) to the
solvent mixture (s), –log(wsγ H
0).30
Operationally, these two pH scales differ in the δ term:31
(5)
which includes the primary medium effect, –log(wsγ H
0), and
the difference between the liquid-junction potentials (E–
j)
of the electrode system in solvent s and w. This latter quantity can be made negligible by using a salt bridge containing a solution of an equitransferent binary salt at a much higher concentration than the sample and standard solutions.30
It has been demonstrated that the δ value is constant independently of the buffer solution at a given solvent composition.32 Thus, the simplest way to obtain
s
spH is to
measure s
wpH with aqueous standards and subtract the
appropriate value of δ for the particular solvent composition and temperature. This procedure was used in this work by taking into account δ values already published for different ACN-water mixtures.30 Thus, the pH value in any
ACN-water mixture was determined by using a glass electrode calibrated with an aqueous buffer (thus obtaining s
wpH)
and this value was then corrected to sspH by means of δ
values obtained from the work of Espinosa et al.30
The titration of propofol was performed in ACN-water mixtures of the following acetonitrile molar fractions (χACN): 0.037, 0.079, 0.129, 0.187, and 0.256, which correspond to the following volume percentages: 10:90, 20:80, 30:70, 40:60, and 50:50, respectively.
Typical results of the titration of 5.0x10⁻⁴ mol L-1
propofol in an ACN-water mixture of χACN=0.079 are shown in Figure 3. The spectral data obtained were processed by using the same procedure as that described in the previous section for the titration of propofol in water. A pKa value of 12.34±0.06 for a confidence interval of 95% was thus computed. The inset in Figure 3 shows the normalized concentrations of the neutral (solid line) and anionic form of propofol (dotted line) back-computed with the aid of the Henderson-Hasselbalch equation. It can be observed in the inset in Figure 3 that the concentrations computed
by using this pKa value have a good fit with the concentrations calculated using BILINEAR. Thus, the value of 12.34±0.06 may be taken as the best value for the dissociation constant of propofol in this solvent mixture.
When the pKa values of propofol, calculated by using the above mentioned procedure, are plotted against the mole fraction of the organic modifier (ACN) in the solvent mixture, a linear relationship is obtained. The relevant fitting parameters for the linear regression (pKa=A+B.χACN)
are: A=11.67, B=7.11, r=0.9939 for the 6 data points obtained in this study. These fitting parameters are similar to those obtained in the study of the acid-base pK values in ACN-water of molecules belonging to the phenol family.33 In that study the authors informed a linear
relationship between the pKa of various phenol derivatives and the ACN percentage (v/v).
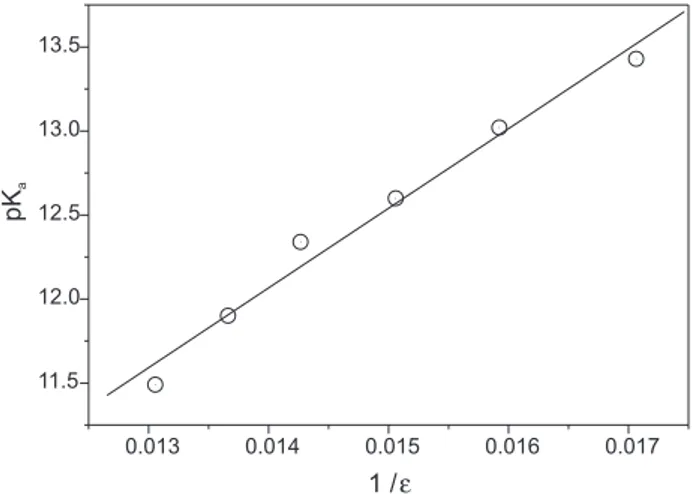
Two interesting properties can be inferred from the behavior of propofol pKa values with the molar fraction of acetonitrile in the solvent mixtures. One of them arises from the dependence of pKa with the relative permittivity of the medium. As expected from the linear relationship between the reciprocal of the relative permittivity of the solvents mixture (1/ε) and the molar fraction of acetonitrile, a linear relationship is also obtained if the pKa values of propofol are plotted against 1/ε.30 Relative
permittivity values were taken from reference 30. The linear segment shows a slope of 457.4 and an intercept value of 5.4, with a correlation coefficient of 0.9915. These results can be rationalized by considering that the propofol Figure 3. Spectra of propofol in an acetonitrile-water mixture (20:80 v/v) at different s
spH . s
spH: (a) 9.07; (b) 11.42; (c) 12.39; (d) 12.83; (e) 13.63. Propofol concentration: 5.0x10⁻⁴ M. Inset: Distribution species plot of propofol at different s
acidity constant decreases with increasing acetonitrile content in the medium. The dissociation process produces ions in solution whose interaction energy at these concentration levels is governed by the Debye-Hückel law. Thus, the linearity of the plot of pKavs 1/ε indicates that a simple model, in which only electrostatic interactions are considered, explains the changes in the pKa of propofol over the full range of solvent composition studied.
Another interesting property of the acid-base equilibrium behavior is related to the autoprotolysis constant of each particular solvent mixture. The extent to which an acid dissociates in different solvents depends upon the “intrinsic” acid strength of the acid as well as on the affinity of the solvent for protons. The former (the intrinsic acidity of the acid) is a property that cannot be measured independently34 because the existence of free
protons in solution is unlikely. Thus, the acidic function of any species does not manifest unless the solvent molecules are themselves able to act as a proton acceptor or donor. On the other hand, a solvent HS (a pure solvent or a binary aqueous organic solvent mixture) capable of being both a proton donor and a proton acceptor, can undergo autoprotolysis according to the general process:35
HS + HS ↔ H2S+ + S– (6)
The general equilibrium constant for equation 4 is called the autoprotolysis constant, Kap, and is defined as:
(7)
where aH2S + and a
S– are the ionic activities of the species
H2S+and S–, respectively and a H 2
S is the activity of the
species HS. Thus, Kap is a dimensionless thermodynamic quantity which is a composite function of the intrinsic acidic and basic strength of the solvent and its relative permittivity. A linear relationship is obtained if the pKa values calculated for propofol at the different solvent compositions are plotted against the autoprotolysis constant of the solvent mixture (r = 0.9932). Autoprotolysis constants were calculated by using the equation Kap = 14.03+5.46χ, taken from the work of Barbosa et al.35 Again, the linearity of the plot shows the
electrostatic nature of the ionization of molecules in the different solvent mixtures.
Conclusions
The acidity constant, Ka, of propofol was determined by acid-base titration and using a multi-wavelength spectro-photometric technique in different ACN-water mixtures, in the mole fraction range from 0 to 0.260 (0 – 50% v/v). The pH values of the titrations in each solvent mixture were corrected to obtain sspH values, that is, the pH of the
ACN-water mixture as measured with a glass electrode calibrated with a buffer in the same solvent mixture. The calculated pKa value of propofol in water was 11.49±0.02. The value of the pKa increased proportionally with the amount of acetonitrile in the solvent mixture. The plot of pKavsχACN
gave the following linear fitting parameters: A=11.67, B=7.11, r=0.9939 for the 6 data points obtained in this study. The plots of pKavs 1/ε (the reciprocal of the relative permittivity) and vs pKap (the negative decimal logarithm of the solvent mixture autoprotolysis constant) also gave linear segments, indicating the electrostatic nature of the ionization process.
Acknowledgements
The authors acknowledge Secretaría de Ciencia y Técnica (Universidad Nacional de Río Cuarto) and Fondo Nacional de Ciencia y Tecnología (FoNCyT) for financial support, and Iliana Martinez for language assistance. They greatly acknowledge Professor Enrique San Román from Universidad Nacional de Buenos Aires for kindly providing the spectral data processing software, BILINEAR. JMM is a member of Carrera del Investigador Científico (CONICET).
References
1. Lynne Hughes, J. M.; Nolan, A. M.; Veterinary Surgery1999, 28, 513.
2. Cuadrado, A.; Solares, G.; González, S.; Sánchez, B.; Armijo, J. A.; Meth. Find. Exp. Clin. Pharmacol.1998, 20, 297. 3. Glowaski, M. M.; Wetmore, L. A.; Clin. Techn. Small Anim.
Pract.1991, 14, 1.
4. Dawidowicz, A. L.; Fornal, E.; Fijalkowska, A.; Chromatographia1998, 47, 523.
5. Vree, T. B.; Lagerwerf, A. J.; Bleeker, C. P.; de Grood, P.M. R. M.; J. Chromatog. B1999, 721, 217.
6. Knibbe, C. A. J.; Koster, V. S.; Deneer, V. H. M.; Stuurman, R. M.; Kuks, P. F. M.; Lange, R.; J. Chromatog. B1998, 706, 305.
7. Hiraoka, H.; Yamamoto, K.; Okano, N.; Morita, T.; Goto, F.; Horiuchi, R.; Clin. Pharmacol. Ther.2004, 75, 324. 8. Dowrie, R. H.; Ebling, W. F.; Mandema, J. W.; Stanski, D. R.;
J. Chromatog. B 1996, 678, 279.
9. Trocewicz, J.; Suprynowicz, Z.; Markowicz, J.; J. Chromatogr. B1996, 685, 129.
10. Rosés, M.; Canals, I.; Allemann, H.; Siigur, K.; Bosch, E.; Anal. Chem.1996, 68, 4094.
11. Barbosa, J.; Bergés, R.; Sanz-Nebot, V.; J. Chromatogr. A1998, 823, 411.
12. Tindall, G. W.; LC-GC2003, 21, 28.
13. Bosch, E.; Espinosa, S.; Rosés, M.; J. Chromatogr. A1998, 824, 137.
14. Canals, I.; Portal, J. A.; Bosch, E.; Rosés, M.; Anal. Chem. 2000, 72, 1802.
15.The Merck Index, 11th ed., Centennial Edition, Merck and Co., Inc.: New Jersey, USA, 1989.
16.CRC Handbook of Chemistry and Physics, 70th ed., CRC Press, Inc.: Boca Raton, 1989, pp. E50-E51.
17. Barbosa, J.; Bergés, R.; Toro, I.; Sanz-Nebot, V.; Int. J. Pharm. 1997,149, 213.
18. Barbosa, J.; Barrón, D.; Jiménez-Lozano, E.; Sanz-Nebot, V.; Anal. Chim. Acta 2001, 437, 309.
19. Barbosa, J.; Barrón, D.; Jiménez-Lozano, E.; J. Chromatogr. A1999, 839, 183.
20. Allen, R. I.; Box, K. J.; Comer, J. E. A.; Peake, C.; Tam, K. Y.; J. Pharmac. Biomed. Anal.1998, 17, 699.
21. Polster, J.; Lachman, H.; Spectrometric Titrations. Analysis of Chemical Equilibria; VCH Publishers: Weinheim, 1989. 22. Takács-Novák, K.; Tam, K. Y.; J. Pharmac. Biomed. Anal.
2000, 21, 1171.
23. Tam, K. Y.; Takács-Novák, K.; Anal. Chim. Acta2001, 434, 157.
24. Schulman, S. G.; Rosenberg, L. S.; Sturgeon, R. J.; J. Pharmac. Sci.1978, 67, 334.
25. San Román, E.; González, M. C.; J. Phys. Chem.1989, 93, 3532.
26. González, M. C.; San Román, E.; J. Phys. Chem.1989, 93, 3536.
27. Taylor, J. K. In Statistical Techniques for Data Analysis; Lewis Publishers, Inc.: Michigan, 1990.
28. Shyr, M-H.; Tsai, T-H.; Tan, P. P. C.; Chen, C-F.; Chan, S. H. H.; Neurosc. Lett.1995, 184, 212.
29.IUPAC Compendium of Analytical Nomenclature. Definitive Rules 1997, 3rd ed., Blackwell: Oxford, 1998.
30. Espinosa, S.; Bosch, E.; Rosés, M.; Anal. Chem. 2000, 72, 5193.
31. Bates, R. G.; Paabo, M.; Robinson, R. A.; J. Phys. Chem.1963, 67, 1833.
32. Castells, C. B.; Ràfols, C.; Rosés, M.; Bosch, E.; J. Chromatog. A2003, 1002, 41.
33. Espinosa, S.; Bosch, E.; Rosés, M.; J. Chromatog. A 2002, 964, 55.
34. Daniels, F.; Alberty, R. A.; Physical Chemistry, 2nd ed., J. Wiley and Sons, Inc.: New York, 1962.
35. Barbosa, J.; Sanz-Nebot, V.; Anal. Chim. Acta1991, 244, 183.
Received: September 13, 2004