0103 - 5053 $6.00+0.00
Article
*e-mail: [email protected]
Resonance Raman Spectroscopy of Fe
IIFe
IIIand Fe
IIIFe
IIIModel Complexes Containing an
Unsymmetrical Dinucleating Ligand: A Biomimetic Redox Pair for Uteroferrin
Norberto S. Gonçalves,a Adolfo Horn Jr.,b Mauricio Lanznaster,c Lucia K. Nodaa and Ademir Neves*,a
a
Departamento de Química, Centro de Ciências Físicas e Matemáticas, Universidade Federal de Santa Catarina, CP 476, 88040-900 Florianópolis - SC, Brazil
b
Laboratório de Ciências Químicas, Centro de Ciências e Tecnologia, Universidade Estadual do Norte Fluminense Darcy Ribeiro, 28013-602 Campos dos Goytacazes - RJ, Brazil
c
Instituto de Química, Centro de Estudos Gerais, Universidade Federal Fluminense, 24020-150 Niterói - RJ, Brazil
Neste trabalho, investigamos os perfis de excitação Raman do complexo [FeIIFeIII(bpbpmp)
(C2H3O2)2](ClO4) (1) e de sua inédita forma oxidada, [FeIIIFeIII(bpbpmp)(C
2H3O2)2](ClO4)2
(2), sendo bpbpmp a molécula 2-bis[{(2-piridilmetil)-aminometil}-6-{(2-hidroxibenzil)(2-piridilmetil)}-aminometil]-4-metilfenol. No complexo 1, o modo vibracional mais intensificado no espectro Raman é o correspondente ao ν(Fe-Ophen_terminal), observado em 608 cm-1. Já no complexo 2, passa a ser o ν(CO
phen_terminal), observado em 1276 cm
-1. Estas diferenças
são devidas às mudanças na estrutura eletrônica do esqueleto dinuclear unido por ponte fenolato, a qual é capaz de deslocalizar carga eletrônica entre os dois centros metálicos.
Raman excitation profiles for the complex [FeIIFeIII(bpbpmp)(C
2H3O2)2](ClO4) (1), and its
oxidized form, the new compound [FeIIIFeIII(bpbpmp)(C
2H3O2)2](ClO4)2 (2), are reported.
H2bpbpmp is the proligand 2-bis[{(2-pyridylmethyl)-aminomethyl}-6-{(2-hydroxybenzyl)(2-pyridylmethyl)}-aminomethyl]-4-methylphenol. For compound 1, the most enhanced vibrational mode in the Raman spectra is the ν(Fe-Ophen_terminal), observed at 608 cm-1. For compound 2, the ν(COphen_terminal), which corresponds to the band at 1276 cm-1, becomes the most enhanced one.
These differences are ascribed to the changes in the electronic structure of the dinuclear phenolate bridged core upon oxidation. The phenolate bridge allows charge density transmission between the metal centers.
Keywords: Resonance Raman spectroscopy, purple acid phosphatase, biomimetic analogue, mixed-valence, unsymmetrical ligand
Introduction
Purple acid phosphatases (PAP´s) constitute a class of metalloenzymes that have been isolated from animals, plants and fungi. They contain a dinuclear core FeIIIMII
(M = Fe, Mn or Zn) in their active sites, which are able to catalyze the hydrolysis of a variety of phosphoric acid esters and anhydrides within the pH range 4-7.1-3
In particular, the core FeIIFeIII is present in uteroferrin,
a PAP from porcine uterus that is involved in the hydrolysis of orthophosphate monoesters and the regulation of the levels of phosphate at pH 4.9-6.0 .1,4 The reduced form of
the enzyme is pink (λmax=505-510 nm, ε ≈ 4000 L mol-1
cm-1/Fe
2), and is active for hydrolysis, while the purple
form, FeIIIFeIII (λ
max=550-570 nm, ε ≈ 4000 L mol -1 cm-1/
Fe2) is inactive.4 The similarity between the molar
absorptivities of these two forms comes from the fact that the reduced iron is not part of the chromophoric group (tyrosinate-FeIII).3
inorganic coordination compounds,5 metal-containing
proteins6-8 and their biomimetic analogues.9-18 PAP’s and
related systems have also been studied by this technique,19-25
aiming to characterize the chromophoric moiety for improved understanding of their electronic structure. The visible chromophore in the PAP enzyme has been associated with a tyrosinate to FeIII charge-transfer
transition.2,4 Resonance Raman studies on PAP´s, using
visible excitation, confirm the presence of tyrosinate ring modes.26
In a previous work,27 a RR study of two isomeric
dinuclear bis-µ-alkoxo complexes containing two FeIII
centers, [Fe2(bbpnol)2], revealed that the electronic coupling between the two centers is significantly increased in the cis-cis rather than in the cis-trans form. The mixed-valence FeIIFeIII,28 MnIIFeIII29 and MnIIMnIII30 complexes
containing the MII(µ-C
2H3O2)2M
III moiety with H
2bpbpmp
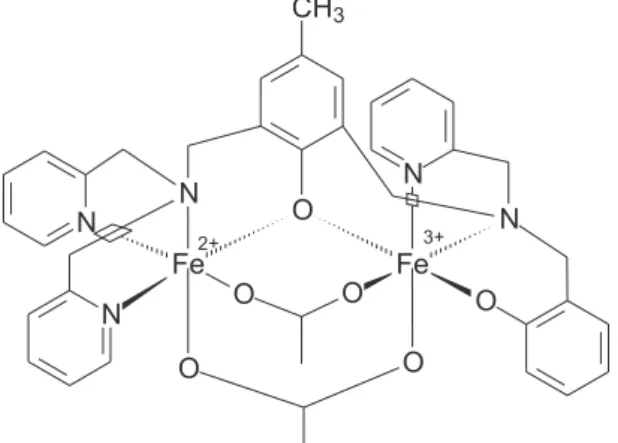
have already been described in the literature. The molecular structures of H2bpbpmp and of its FeIIFeIII
coordination compound (supposing the same structure of the MnIIFeIII complex29) are represented in Figures 1 and
2, respectively.
In this work, we report a detailed RR study of two coordination compounds, aiming to analyze the effect of a mixed-valence core that may exhibit distinct reactivities as a function of the oxidation state, as well as to identify the changes in the electronic structure pertinent to the FeIIIFeX (X=II,III) core. The FeIIIFeIII complex is still
unknown in the literature. It is important to notice that such complexes, which contain a terminal FeIII-O
phenolate
bond with the unsymmetrical proligand H2bpbpmp, have been proposed as structural and functional models for utero-porcin PAP.28 Another goal is to corroborate previous
results of a theoretical paper31 concerning the force field
parameters that reflect in the vibrational wavenumbers.
Experimental
Syntheses
CAUTION!Perchlorate salts of metal complexes are potentially explosive and therefore should be prepared in small quantities with the proper care.
The syntheses of the unsymmetrical proligand 2-bis[{(2-pyridylmethyl)-aminomethyl}-6-{(2-hydroxy benzyl)(2-pyridylmethyl)}-aminomethyl]-4-methyl
phenol, H2bpbpmp, and the complex [FeIIFeIII
(bpbpmp)(C2H3O2)2](ClO4) (1), were already reported.28
The oxidized form, the new compound [FeIIIFeIII
(bpbpmp)(C2H3O2)2](ClO4)2 (2), was synthesized by reacting FeIII ions with the proligand, as follows: in a
methanolic solution (50 mL) of Fe(ClO4)3·9H2O (2.13
mmol, Aldrich), H2bpbpmp (1 mmol) was added under
magnetic stirring and ambient conditions. Then, sodium acetate trihydrate (4.25 mmol, Aldrich) was added and the resulting solution was heated at 40 oC for ten
minutes. The dark-blue precipitate was filtered off and recrystallized from methanol/isopropanol (1:1), forming blue single-crystals. Yield 50% (0.56 g). Anal. Calc. for Fe2C38H39N5O6·2ClO4·3MeOH·3H2O: C, 43.87; H, 4.57; N, 6.24. Found C, 44.30; H, 4.58; N, 6.24%. All solvents and reagents employed were of analytical grade.
Spectroscopic measurements
Raman spectra were obtained with a Renishaw Raman System 3000, using the 632.8 nm exciting line of a Helium-Neon laser (Spectra-Physics Model 127). The samples were finely ground and slightly pressed over glass slides. The spectral slit was set to 4 cm-1.
Resonance Raman (RR) spectra were obtained with a Jobin-Yvon U-1000 using the exciting lines of either Ar+
and Kr+ lasers (Coherent Innova 90) and photon-counting
detection (EG & G PAR). The samples were prepared by dilution in KNO3 (internal standard) in a 1:50 proportion (m/m). The finely ground mixture was placed in a rotating cell to avoid local heating. Laser power was adjusted in the Figure 1. Representation of the molecular structure of H2bpbpmp.
range of 50-100 mW. The spectral slit was set to 4 cm-1.
Raman excitation profiles (REP) were constructed by plotting relative Raman intensities versus exciting wavelength. These relative Raman intensities were computed from the ratio of peak heights to the 1050 cm-1
band of the internal standard.
In order to allow comparison between REP and optical spectra, these have been plotted together with the respective REP’s. The optical spectra of the samples were obtained as diffuse reflectance spectra, using the integrating sphere attachment in the Perkin-Elmer Lambda-19. The samples were dispersed in MgO, which also served as reference.
Results and Discussion
Raman spectroscopy
The Raman spectra of the pure compounds [FeIIFeIII(bpbpmp)(C
2H3O2)2]ClO4 (1) and [Fe IIIFeIII
(bpbpmp)(C2H3O2)2]ClO4 (2), acquired near the resonance region in the Renishaw spectrometer, are displayed in Figure 3.
Selected vibrational wavenumbers of the most prominent bands were picked up from the Raman spectra and presented in Table 1, that also contains a tentative assignment based on previous works on related systems.27,31
Resonance Raman spectroscopy
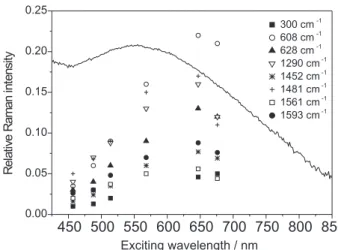
Raman excitation profiles were constructed for the most prominent bands of compounds 1 and 2, indicated in Figures 4 and 5, respectively. The optical spectra of compound 1 in the solid state (λmax = ca. 570 nm) agrees
with that reported in CH3CN solution by Neves et al. (λmax = 555 nm).28 From the diffuse reflectance spectra,
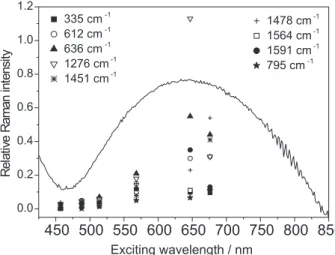
it is possible to observe that the REP is red-shifted relative to the optical spectrum for compound 1, a behavior already noticed for this kind of substance (see 27 and references therein). The solid state optical spectra of compound 2 (λmax = ca. 650 nm) also correlates well with that reported by de Brito32 in CH
3CN solution
(λmax = 618 nm), and there is no significant shift for the most enhanced vibrational modes.
The general pattern of the spectra is very similar to that exhibited by the bovine spleen purple acid phosphatase, as reported by Averill et al.,26 what is a strong
evidence of the similarity between the iron coordination environment in the complexes and the phosphatase active center. The enhanced bands can be assigned to the Table 1. Observed Raman wavenumbers (cm-1) for complexes 1 and 2.
Ring modes are indicated by Wilson vibration numbering
1 2 assignment
300(w) —- νS(Fe-Ophen_bridge-Fe)
333(sh) 335(w) νS(Fe-Ophen_bridge-Fe)
608(s) —- ν(Fe-Ophen_terminal)
—- 612(m) 6b
628(m) —- 6b
—- 636(s) ν(Fe-Ophen_terminal)
798(vw) 795(vw) νAS(Fe-Ophen_bridge-Fe)
887(w) 890(w) 1
1114(w) 1112(w) 18a
1150(w) 1151(w) 15
—- 1243(sh) ν(CO)phen_bridge
1290(vs) 1276(vs) ν(COphen_terminal)
1344(w) —- 14
1452(m) 1451(m) 19b
1481(s) 1478(m) 19a
1561(m) 1564(m) 8b
1593(s) 1591(m) 8a
v=very weak, w=weak, m=medium, s=strong, vs=very strong, sh=shoulder, br=broad.
Figure 3. Raman spectra of compounds (a) 1 and (b) 2 excited at 632.8 nm, near the resonance region.
phenolate internal ring, the terminal phenolate ν(C-Ophen), and the ν(Fe-Ophen_terminal) modes.
The comparison between the two Raman excitation profiles allows drawing the following conclusions.The ν(COphen_terminal) mode is much more intensified in compound 2 than in 1. As pointed out previously by Paes et al.,31 the terminal phenolate oxygen bears a high
electronic density in this kind of compound containing two phenolate rings. In compound 2, the presence of two FeIII atoms would imply in electronic states having
altered charge distribution, compared to compound 1. See, for instance, the case of the electronic ground state, which presents an expressive figure for the Δν = |ν(C-Ophen_terminal) (1) - ν(C-Ophen_terminal) (2)| = 14 cm-1.
This change in the charge distribution would also result in an increased dissimilarity between the fundamental and the excited electronic states, as the LUMO would then have the contribution from the two FeIII atoms
(since the bridge couples electronically the two FeIII
atoms). The net effect is to increase the transition dipole moment, thus leading to an enhanced tyrosinate-to-FeIII
CT transition (as more charge will be displaced), which increases the molar absorptivity (ε) and thus the RR
enhancement, as observed for compound 2. The
effective electronic coupling provided by the Fe-O-Fe bridge was reported in a previous work.27 However, this
should not be confused with the weak antiferromagnetic coupling exhibited by the phenoxo bridges, which is caused by the low electronic density on the oxygen bridge.31
Data for other iron complexes with phenolate ligands33 show that tyrosinate-to-FeIII CT transition
molar absorptivities are much higher than the phenolate(bridge)-to-FeIII analogs. As the RR
inten-sification is proportional to the squared molar
absorptivities, most of the RR enhanced bands of compounds 1 and 2 can be safely assigned to terminal phenolates. In the low-frequency region, the bands at 300-335 cm-1 range are tentatively assigned to
ν(Fe-Ophen_bridge), although the correct normal mode description would be a kind of chelate ring breathing,
as proposed previously.27 The much smaller
inten-sification observed for these low-frequency bands indicates that the Ophen_bridge-to-FeIII CT transition is very
weak, compared to the stronger tyrosinate-to-FeIII CT
transition in the electronic spectra, which overlays the weaker one. This also reflects in the Raman spectra of
2, as the shoulder at 1243 cm-1 (assigned to
ν(CO)phen_bridge) is much less intense than the band at 1276 cm-1, assigned to ν(CO)
phen_terminal. It is interesting
to observe that no counterpart for this shoulder at 1243 cm–1 could be safely assigned in the Raman spectrum
of compound 1, since in this compound there is only one vicinal FeIII to enhance the O
phen_bridge-to-Fe III CT
transition.
In compound 1, an outstanding fact is that the most
enhanced band in the REP is the one at 608 cm-1,
assigned to the terminal ν(Fe-Ophen_terminal) mode, whose frequency is in the region reported for other iron-phenolate complexes.34 This assignment also corrects
that of a previous work,29 since it would not be expected
that an asymmetric mode such as the νAS(Fe-Ophen_bridge -Fe) would present such a high RR enhancement, at least for a Raman intensification mechanism based on the A-term Albrecht formalism.3 The new proposed values
for the νAS(Fe-Ophen_bridge-Fe) (798 and 795 cm-1 for
complexes 1 and 2, respectively) are consistent with the relative low RR enhancement exhibited by these bands (the 798 cm-1 band is not represented in the REP
due to its low intensity). The assignment for the ν(Fe-Ophen_terminal) (608 cm-1) and the 6b ring mode (628 cm-1)
is also based on the higher Raman intensification showed by the former one, since the molecular orbitals of the (Fe-Ophen_terminal) chemical bond should participate more effectively in the chromophoric group. The ring mode 6b is weakly coupled to the ν(Fe-Ophen_terminal); therefore, it should exhibit only a slight enhancement. This weak enhancement of the ring mode is a behavior
already noticed for the compound “cis-cis
”-[Fe2(bbpnol)2].29 However, for compound 2, the Raman
intensification pattern is just reversed (see the respective REP), viz., the band at 612 cm-1 is less intensified than
the one at 636 cm-1 (see Figure 5). This finding suggests per se that the vibrational assignment of this doublet should also be reversed, as shown in Table 1, that is, the band at lower wavenumber is now assigned to the Figure 5. Raman excitation profiles for compound 2, together with the
ring mode 6b and the other at higher wavenumber is assigned to the ν(Fe-Ophen_terminal) mode. Besides, the change in the iron oxidation state should disturb the ν(Fe-Ophen_terminal) mode in a higher extension than the ring ν6b ring mode, as evidenced by the Δν: |ν6b(1 )-ν6b(2)| = 16 cm-1 versus |ν(Fe-O
phen_terminal)(1)-ν
(Fe-Ophen_terminal)(2)| = 28 cm-1. Also, this change in the
iron oxidation state is expected to increase the wavenumber of the ν(Fe-Ophen_terminal) mode in compound 2 due to the charge redistribution that reinforces the Fe-Ophen_terminal bonding by populating bonding orbitals. The charge probably came from the ring orbitals, since the 6b ring mode vibrational wavenumber decreases in
compound 2 (as well as the other ring modes, in a
general way). The fact that the change in oxidation state of the iron atom on the other side of the Fe-O-Fe bridge (coordinated to the pyridine ligands) disturbs the iron atom coordinated to the terminal phenolate just confirms the high degree of electronic delocalization on the bridge, also favored by the trans disposition of the terminal phenolate.
Conclusions
The change in the oxidation state in a mixed valence bridged core affects the fundamental state as revealed by the shifting of the vibrational wavenumbers. This change also reflects in the electronic excited state as evidenced by the comparison between the REP’s of compounds 1 and 2. The phenolate bridge is able to transmit charge density between the two iron centers. Complexes 1 and 2 can be considered good models for the resonance Raman properties of PAP’s in their reduced and oxidized forms, respectively.
Acknowledgments
CAPES/ProDoc for the grant (LKN), CNPq/Edital Universal 01/2002 (process 478999/2003-8), CNPq process 307033/2004-0 (NSG), LEM-IQUSP for the use of the spectroscopic facilities and Prof. Oswaldo Sala for the Resonance Raman spectra.
References
1. Vincent, B.J.; Olivier-Lilley, G. L.; Averill, B. A.; Chem. Rev.
1990, 90, 1447.
2. Antanaitis, B. C.; Aisen, P.; Adv. Inorg. Biochem. 1983, 5, 111. 3. Klabunde, T.; Krebs, B.; Struct. Bonding (Berlin)1997, 89,
177.
4. K. Doi, K.; Antanaitis, B.C.; Aisen, P.; Struct. Bonding (Berlin)
1988, 70, 1.
5. Clark R.J.H.; Dines, T.J.; Angew. Chem., Int. Ed. Engl. 1986,
25, 131.
6. Que Jr., L.; Coord. Chem. Rev. 1983, 50, 73.
7. T.Klabunde, T.; Krebs, B.; Struct. Bond. 1997, 89, 177. 8. Sanders-Loehr, J.; Wheeler, W.D.; Shiemke, A.K.; Averill B.A.;
Loehr, T.M.; J. Am. Chem. Soc. 1989, 111, 8084.
9. Gabber, B.P.; Miskowski V.; Spiro, T.G.; J. Am. Chem. Soc. 1974, 96, 6868.
10. Salama, S.; Stong, J.D.; Neilands J.B.; Spiro T.G.; Biochemistry
1978, 17, 3781.
11. Plowman, J.E.; Loehr, T.M.; Schauer, C.K.; Anderson, O.P.;
Inorg. Chem. 1984, 23, 1553.
12. Pyrz, J.W.; Karlin, K.D.; Sorrell, T.N.; Vogel, G.C.; Que Jr., L.;
Inorg. Chem. 1984, 23, 4581.
13. Armstrong, W.H.; Spool, A.; Papaefthymiou, G.C.; Frankel R.B.; Lippard, S.J.; J. Am. Chem. Soc. 1984, 106, 3653. 14. Spool, A., Williams, I.D.; Lippard, S.J.; Inorg. Chem. 1985,
24, 2156.
15. Pyrz, J.W.; Roe, A.L.; Stern L.J.; Que Jr, L.; J. Am. Chem. Soc. 1985, 107, 614.
16. Czernuszevicz, R.S.; Sheats, J.E.; Spiro, T.G.; Inorg. Chem. 1987, 26, 2063.
17. Carrano, C.J.; Carrano, M.W.; Sharma, K.; Backes G.; Sanders-Loehr, J.; Inorg. Chem. 1990, 29, 1865.
18. Solomon, E.I.; Tuczek, F.; Root, D.E.; Braun, C.A.; Chem. Rev. 1994, 94, 827.
19. Feng, X.; Bott, S.G.; Lippard, S.J.; J. Am. Chem. Soc. 1989,
111, 8046.
20. Turowski, P.N.; Armstrong, W.H.; Roth M.E.; Lippard, S.J.; J.
Am. Chem. Soc. 1990, 112, 681.
21. Norman, R.E.; Yan, S.; Que Jr., L.; Backes, G.; Ling, J.; Sanders-Loehr, J.; Zang, J.H.; O’Connor, C.J.; J. Am. Chem. Soc. 1990,
112, 1554.
22. Vincent, J.B.; Olivier-Lilley, G.L.; Averill, B.A.; Chem. Rev. 1990, 90, 1447.
23. Holz, R.C.; Elgren, I.E.; Pearce, L.L.; Zhang, J.H.; O’Connor C.J.; Que Jr., L.; Inorg. Chem.1993, 32, 5844.
24. Chabrut, B.; Chardon-Noblat, S.; Deronzier, A.; Chottard, G.; Bousseksou, A.; Tuchagues, J.-P.; Laugier, J.; Bardet, M.; Latour, J.-M.; J. Am. Chem. Soc. 1997, 119, 9424.
25. Mizoguchi T.J.; Lippard, S.J.; Inorg. Chem. 1997, 36, 4526. 26. Averill, B.A.; Davis, J.C.; Burman, S.; Zirino, T.;
Sanders-Loehr, J.; Sanders-Loehr, T.M.; Sage, J.T.; Debrunner, P.G.; J. Am. Chem. Soc.1987, 109, 3760.
27. Gonçalves, N.S.; Rossi, L.M.; Noda, L.K.; Santos, P.S.; Bortoluzzi, A.J.; Neves A.; Vencato, I.; Inorg. Chim. Acta 2002, 329, 141.
28. Neves, A.; de Brito, M. A.; Drago, V.; Griesar, K.; Haase, W.;
Inorg. Chim. Acta 1995, 237, 131.
29. Karsten, P.; Neves, A.; Bortoluzzi, A.; Drago, V.; Lanznaster,
30. Karsten, P.; Neves, A.; Bortoluzzi, A. J.; Strähle, J.; Maichle-Mössmer, C.; Inorg. Chem. Commun.2002, 5, 434.
31. Paes, W.P.; Faria, R.B.; Machuca-Herrera, J.O.; Neves, A.; Machado, S. P.; Can. J. Chem. 2004, 82, 1619.
32. de Brito, M.A.; PhD Thesis, Universidade Federal de Santa Catarina, Brazil, 1994.
33. Suzuki, M.; Oshio, H.; Uehara, A.; Endo, K.; Yanaga, M.; Kida, S.; Saito K.; Bull. Chem. Soc. Japan 1988, 61, 3907. 34. Pyrz, J.W.; Roe A.L.; Stern L.J.; Que Jr., L.; J. Am. Chem. Soc.
1985, 107, 614.