ISSN 0104-6632 Printed in Brazil
www.abeq.org.br/bjche
Vol. 30, No. 01, pp. 141 - 154, January - March, 2013
*To whom correspondence should be addressed
Brazilian Journal
of Chemical
Engineering
ALUMINOTHERMIC REDUCTION OF Cr
2
O
3
CONTAINED IN THE ASH OF THERMALLY
TREATED LEATHER WASTE
B. M. Wenzel
1,2*, T. H. Zimmer
1, C. S. Fernandez
1, N. R. Marcilio
1*and M. Godinho
31Laboratory of Waste Treatment, (LPR), Department of Chemical Engineering, Phone: + (55) (55) 3359-3979,
Federal University of Rio Grande do Sul, (UFRGS), Eng. Luiz Englert str. s/n°, 90040-040, Porto Alegre - RS, Brazil. E-mail: [email protected]; [email protected]
2Federal University of Fronteira Sul, (UFFS), Major Antônio Cardoso str. 590, 97900-000, Cerro Largo - RS, Brazil. 3
Department of Chemical Engineering, University of Caxias do Sul, (UCS), Francisco Getúlio Vargas str. 130, 95070-560, Caxias do Sul - RS, Brazil.
(Submitted: November 21, 2011 ; Revised: April 17, 2012 ; Accepted: June 1, 2012)
Abstract - In this study the viability of utilising ashes with high chromium oxide content, obtained by thermal treatment of footwear leather waste, in the production of low-carbon ferrochromium alloy (Fe-Cr-LC) by aluminothermic reduction was investigated. The following key-factors were selected for process modelling: the quantity of aluminium (Al) employed in the reaction, the iron amount added, the iron compound (Fe and/or Fe2O3) used, and the chromic acid addition. The process was investigated using a 24 full factorial design where the percentage of Cr2O3 reduced was used as the response. Variance analysis was employed to determine the significant effects and to validate the obtained model. The model was useful for finding the optimal operating conditions, including the maximisation of chromium conversion and the gross margin. Both resulted in similar process conditions, with 76.8±12.3% of chromium being reduced to the metallic phase, and 1.65±0.52 USD (kg ash)-1 as the gross margin. The qualities of some alloys obtained were investigated by scanning electron microscopy coupled with energy dispersive X-ray spectroscopy analysis (SEM/EDS). The results showed that the main problem for these alloys in a standard specification was the P and S content, suggesting that a pre-treatment is required.
Keywords: Footwear leather waste; Chromium oxide; Aluminothermic reduction; Low-carbon ferrochromium; Statistical experimental design; Optimisation.
INTRODUCTION
According to Brazilian governmental institutions (State Foundation of Environmental Protection – FEPAM), 118 thousand tonnes/year of hazardous solid wastes are generated from the leather industries in Rio Grande do Sul State, corresponding to 62% of the total hazardous wastes produced in this State (FEPAM, 2003). This solid waste is hazardous because it contains trivalent chromium derived from the salts used in tannery. Chromium is considered to be very harmful for living cells, and may cause
cancer (Langard, 1990; Tsou et al., 1997) and cell death (Blankenship et al., 1994). The majority of these wastes are disposed in landfills, and only about 3% are recycled (FEPAM, 2003). In specific envi-ronmental conditions, chromium (III) can be converted to chromium (VI) (Fathima et al., 2001; Milacic and Stupar, 1995), thus causing environmental impacts.
semi-pilot unit (350 kWth) projected by the Laboratory of Waste Treatment was built to study leather residue gasification and combustion (described by Godinho et al. (2007; 2009; 2010)). The thermal capacity of this unit will be increased in the near future, reaching a higher level of energy recovery (600 kWth).
About 5.8 wt% (dry basis) of the leather waste is composed of ash (Godinho et al., 2007). The ash resulting from this process contains 50-62 wt% of chromium oxide (Cr2O3) and less than 5 ppmw hexavalent chromium (Cr+6) (Godinho, 2006; Godinho
et al., 2007; Vieira, 2004; Wenzel, 2008), and might
be utilised as a raw material, potentially replacing chromic ore (chromite). Some researchers approach the chromium (VI) route to obtain chromium compounds from ashes (Dettmer et al., 2010a; Dettmer
et al., 2010b).
Low carbon ferrochromium alloy (Fe-Cr-LC) is an important input in the production of stainless steel. Chromium is one metal used as an alloying element in steel. Its use provides high corrosion resistance, by forming a thin oxide layer on the metal surface, called the passive layer, which protects against the action of the environment (Chiaverini, 2005). In this context, this study investigates the production of Fe-Cr-LC employing chromium-rich leather waste ashes via non-isothermal aluminothermic reduction.
The aluminothermic reduction process was patented primarily in Germany by Goldschmit, and was named the thermite reaction. Pure metals and ferro-alloys, including chromium, were commercially produced by variations of the original patent. The process is also being used to recover metals (Shibata
et al., 2002). During the reaction, the temperature
must exceed 2,100 ºC to permit the adequate separation of the product metal and slag (Nelson, 1996). According to Nelson (1996), the energy balance of the process is a key factor that can lead to poor metal yield when energy is insufficient or can cause excessive fumes and explosions when too much energy is injected into the system. Therefore, new sources of raw material must be evaluated in small scale tests. The reaction of chromium oxide is highly exothermic (ΔHo25ºC= -272.8 kJ (mol Al)-1), but is insufficient to be autothermic, requiring the input of additional energy. An autothermic process requires the addition of boosters or reactant preheating in some cases. One of the chemical boosters, also known as an exothermical reactant, is chromic acid (CrO3). The aluminothermic reduction of CrO3 (ΔHo25ºC=-548.5 kJ (mol Al)-1) is indicated as an
energy source and to initiate and sustain the aluminothermic process (Nelson, 1996). However, such compounds present the inconvenience of carcinogenic effects. Another compound that could be used is hematite (Fe2O3; ΔHo25ºC =-851.4 kJ (mol Al)
-1 ) (Bodaghi et al., 2009).
The present study was conducted using an experimental design technique (full factorial design) with four independent variables (factors) across two levels. The simultaneous effects of Al amount, iron amount, the iron compound used (oxide or metal), and chromic acid addition were selected as factors to be investigated. The quantity of the reduction agent (Al) was tested in the range between stoichiometric levels and an excess of 30%, considering the reactions that occur in the system. Chromic acid was used as a chemical booster, to provide additional energy to the system. Iron was used in two forms: metallic iron and iron (III) oxide. The oxide (hematite) is known to supply more energy to the reaction system (acting as booster), but consumes more Al. A representative model that involves these factors was validated, and optimal conditions were obtained. Due to the relatively high price of raw materials involved in this process, a simple economic optimisation was performed (gross margin maxi-misation). The alloy quality was investigated using scanning electron microscopy (SEM) equipped with energy dispersive X-ray spectroscopy (EDS). Alloy samples obtained from two experimental conditions were used for comparison with the standard speci-fications of Fe-Cr-LC.
EXPERIMENTAL
Ash from Leather Wastes and Other Materials
The ash used in the experiments was collected in the gasification reactor of the pilot plant for leather waste thermal treatment (described by Godinho et al. (2010; 2007; 2009)). A representative ash sample was prepared through successive manual quartering and comminution in a ball mill until particle sizes of < 75 μm were obtained.
Brazilian Journal of Chemical Engineering Vol. 30, No. 01, pp. 141 - 154, January - March, 2013
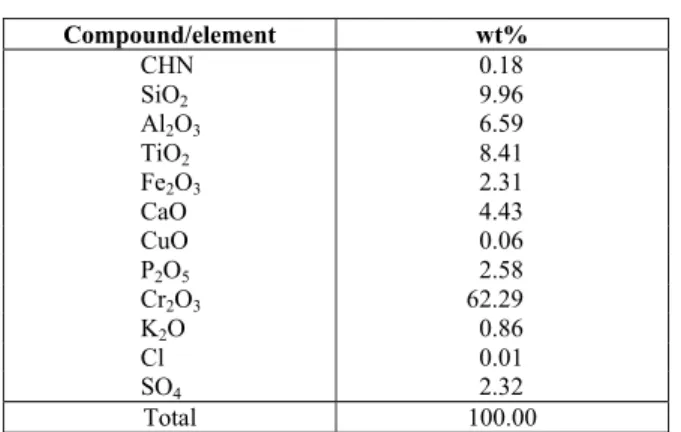
these elements (CHN). Table 1 summarises the results of chemical characterisation. According to Godinho et al. (2007), the hexavalent chromium content in the ash is less than 5 ppmw.
Table 1: Ash composition.
Compound/element wt%
CHN 0.18
SiO2 9.96
Al2O3 6.59
TiO2 8.41
Fe2O3 2.31
CaO 4.43 CuO 0.06
P2O5 2.58
Cr2O3 62.29
K2O 0.86
Cl 0.01
SO4 2.32
Total 100.00
X-ray powder diffraction analysis identified the crystalline phases present in the sample as eskolaite (Cr2O3), quartz and cristobalite (SiO2), magnetite [(Fe,Mg)(Al,Cr,Fe,Ti)2O4], and microcline (KAlSi3O8). The compound identification was performed by comparison with the database of the JCPDS (Joint Committee of Powder Diffraction Society).
Besides the ash samples, the following materials were used to accomplish the experimental work: metallic aluminum (96% Al); metallic iron (99% Fe); iron (III) oxide (99% Fe2O3); chromic acid (98% CrO3); alumina crucibles (99.7% Al2O3); potassium chlorate (99% KClO3); and magnesium ribbon.
Experimental Factors
Fifty grams of ash (diameter < 75 µm) were used in all runs. The geometry of crucibles (trunk cone 100/70/50 mm – height/diameter) and the intimate mixture of the charges were also adopted in all experiments.
The factors investigated in this work were: the Al quantity employed in the reaction system (X1), the amount of iron added (X2), the iron compound used (Fe and/or Fe2O3) (X3), and the chromic acid addition (X4). For correct parameterisation of the studied factors, the methodology presented below was used.
Al quantity (X1) is expressed with an excess of the stoichiometric quantity necessary for the reduction of all of the reducible compounds in the charge (according to the Ellingham diagram (Gaskell et al., 2001)), including the compounds present in ash (Cr2O3, Fe2O3, TiO2, SiO2 and CuO) and the inputs
(CrO3 and Fe2O3, when used). Equations (1) to (6) express all of the reactions that might occur in the reaction system.
2 3 2 3
Cr O +2 Al→2 Cr+Al O (1)
2 2 3
3 SiO +4 Al→3 Si+2 Al O (2)
2 2 3
3 TiO +4 Al→3 Ti+2 Al O (3)
2 3 2 3
Fe O +2 Al→2 Fe+Al O (4)
2 3
3 CuO+2 Al→3 Cu+Al O (5)
3 2 3
CrO +2 Al→Cr+Al O (6)
The iron amount (X2) employed in the experiments was calculated by assuming a hypothetical situation in which all of the elements of reducible oxides (Equations (1) to (6)) are incorporated into the metallic phase. The iron amount factor is expressed as the chromium mass fraction in this hypothetical metallic alloy. Thus, an increase of the Cr mass fraction for this factor results in a decrease in iron utilisation in the experiment. The iron addi-tion is necessary because low-carbon ferrochromium specifications, according to A101 (ASTM, 2004), present a chromium content up to 75 wt%. Utilisa-tion of ash without previous purificaUtilisa-tion, as in this study, is unfeasible for chromium metal production, since a lower content of impurities is needed for this purpose (A481; ASTM, 2005).
The factor associated with the iron compounds utilized (X3) (metallic iron and/or iron (III) oxide) is expressed as the mass fraction of Fe (metallic iron) added in relation to the total iron added. The utilisation of Fe2O3 as iron source in the system might be advantageous since it acts as a chemical booster, but there is a greater consumption of Al.
The addition of chromic acid (CrO3) to the reaction system guarantees more energy liberation, as it is also a chemical booster. The factor associated with the quantity of chromic acid added (X4) is expressed as the mass% of CrO3 used in relation to ash employed.
factors studied in this work, expressed as real variables, according to the definitions above. Note that the raw material mass should take into account the purity of the compound of interest in the raw material used. In the case of the experiments of this study, purities were shown in the section “Ash from leather wastes and other materials”. Hence, the numerical coefficients of Equations (7) to (10) are with respect to the molar mass of the compounds and metals, the ash composition (Table 1), the stoichiometric coefficients of the reactions, and the molecular formula of oxides.
(
)
(
)
(
)
Al 1 3 2 3 1 1 1 X1 m 1 X2 1002.61 10 2.51 10 X4 X3 X2
6.60 10 2.89 10 X4
2.06 10 2.51 10 X4 1 X3
− − − − − ⎛ ⎞ = ⎜ + ⎟ ⎝ ⎠ ⎧⎡ × + × +⎤ ⎫ ⎪⎢ ⎥ ⎪ × + × ⎨⎢⎣ ⎥⎦ ⎬ ⎪+ × + × − ⎪ ⎩ ⎭ (7) 1 1
Fe 1 3
X3 4.26 10 5.20 10 X4 m
5.40 10 X2 5.20 10 X4X2 X2 − − − ⎛ × + × ⎞ = ⎜ ⎟ − × − × ⎝ ⎠ (8)
(
)
(
)
(
)
Fe2O3 1 1 1 3 1m 1 X3
X2
6.09 10 7.43 10 X4
7.72 10 7.43 10 X4 X2
− − − = − ⎡ × + × ⎤ ⎢ ⎥ − × + × ⎢ ⎥ ⎣ ⎦ (9) CrO3 X4 m 100
= (10)
Experimental Procedure and Apparatus
The experimental apparatus was composed of an alumina crucible wrapped with a thermal insulator (lime). The reaction charge, which consisted of 50 g of ash along with Al, metallic iron and/or iron (III) oxide, and chromic acid as appropriate, was thoroughly mixed and deposited in a crucible. The amount of raw materials employed was obtained from the factor values, which were defined according to each experimental run. An ignitor was prepared, which was a mixture of potassium chlorate and Al agglutinated with glue, and then coupled with magnesium ribbon to initiate the reaction. A similar experimental apparatus was employed by Venugopalan and Sathiyamoorthy (2006).
When the apparatus was assembled, the ignitor was placed in the surface of the reaction charge and
the magnesium ribbon burned. This burning provided the energy for the activation of the ignitor reaction which, in turn, released the necessary energy for the aluminothermic reduction reaction activation. After this was triggered, the reaction was only completed when all of the Al had been oxidised. Since the reaction is highly exothermic and the adiabatic system was adopted (i.e. a non-isothermal reaction), the molten product formed during the reaction provided the phase separation, which was basically slag and metal (alloy). After the system had cooled, these two phases were manually separated, weighed and stored. The Cr2O3 remaining in the slag phase was analysed for conversion determinations.
Response Variable and Analytical Methods
The response variable, or chromium conversion (Y), was obtained from determinations of the Cr2O3 concentration in the slag phase, and the slag mass value. The slag mass was determined by the total mass balance, which is the difference of the initial charge mass and the alloy and volatilised masses. From the definition of conversion and the application of a mass balance for chromium, the conversion was calculated according to Equation (11), where xslagCr is the mass fraction of Cr in the slag phase (measured in each run, according to the procedure described below); mslag is the mass of slag (measured in each run); xashCr is the mass fraction of Cr in the ash raw material (0.4262, according to the characterisation); and mash is the mass of ash employed in the experiments (50 g).
slag slag Cr ash Cr ash x m
Y 100 1
x m
⎛ ⎞
= ⎜⎜ − ⎟⎟
⎝ ⎠
(11)
For the determination of the chromium mass fraction (xslagCr ) , the slag phase was comminuted in a planetary ball mill. A sample of slag with a diameter < 75 µm was fused with lithium tetraborate (Li2B4O7) in a graphite crucible at 1,000 °C, followed by a final dissolution of the melt in dilute hydrochloric acid (HCl) according to standard practice E886 (ASTM, 1994). The solution was analysed for chromium using graphite furnace atomic absorption spectroscopy (GF-AAS).
Brazilian Journal of Chemical Engineering Vol. 30, No. 01, pp. 141 - 154, January - March, 2013
on a JEOL JSM 5800, and 20 kV of accelerating voltage was employed in the SEM. Microstructural investigation examined the different regions of the particles, while the EDS microprobe mapped the chemical elements and performed point chemical analyses.
Design of Experiments and Statistical Analysis
In this study a 24 full factorial experimental design was applied, with the addition of centre points (Montgomery, 2009). The factorial design was applied to determine the influence of the operational condi-tions on the aluminothermic reduction process, and has been previously used in various studies (Ferreira
et al., 2004; Nahui et al., 2008; Venugopalan and
Sathiyamoorthy, 2006; Wenzel et al., 2010). The levels of the four factors (described in the “Experimen-tal factors” section) are shown in Table 2.
Nineteen experiments were performed (24=16, with more repetitions of the “16th" run, and two for the central point). The duplicate experiments were carried out for the estimation of experimental errors (experimental variance) with two degrees of freedom.
The analysis of variance (ANOVA) was applied to determine: 1) the significance of the main and interaction effects on the response; 2) the second order curvature in the response; 3) the adequacy of the models; and 4) model comparison.
Optimisation Problems
Two optimisation problems were encountered for the proposed process. Firstly, the maximisation of the conversion model obtained for description of system, and secondly, in view of the relative high price of the raw materials involved in the process, a simple economic analysis was performed through gross margin optimisation.
In the gross margin optimisation problem, the objective function to be maximised is represented by Equation (12), where GM is a gross margin, expressed in USD (kg ash)-1; Ymod is the model obtained for the chromium conversion (a function of
the variables selected in this study), expressed in %; pi (i = Fe-Cr, Fe2O3, CrO3, Al and Fe) is the price of compound/product “i” (for raw materials, this is obtained from the raw material cost divided by the purity of the compound of interest); mj (j = Fe, Fe2O3, CrO3 and Al) is the mass of compound “j” employed as a raw material in the process (calculated by Equations (7) to (10)); mR is the mass of the reducible compounds in the charge (mass of the hypothetical alloy minus the mass of the metallic iron added) and can be calculated by Equation (13).
mod
R Fe Fe Cr
Fe2O3 Fe2O3 CrO3 CrO3 Al Al Fe Fe
Y
GM m m p
100
m p m p
m p m p
−
⎛ ⎞
=⎜ + ⎟
⎝ ⎠
+
⎛ ⎞
−⎜⎝+ + ⎟⎠
(12)
(
)
(
)
(
)
R
1 3
10 12
1 1
m
5.40 10 5.20 10 X4 X3 X2 1
3.30 10 4.00 10 X4
X2
4.26 10 5.20 10 X4 1 X3
− −
− −
− =
⎧⎡ × + × −⎤ ⎫
⎪⎢ ⎥ ⎪
× − ×
⎨⎢⎣ ⎥⎦ ⎬
⎪+ × + × − ⎪
⎩ ⎭
(13)
In the formulation of the gross margin objective function the following hypotheses were assumed: 1) all reducible compounds in the charge are converted to a metallic form with the same conversion obtained for chromium (Ymod); 2) all iron compounds in the iron ore employed as a raw material are Fe2O3 (see Table 3); 3) the price of ferrochromium alloy is constant, independent of the composition; 4) the alloy produced has the specification required for Fe-Cr-LC. Table 3 shows the raw material prices (IndexMundi, 2010; MetalPrice, 2010) adopted in the gross margin problem.
For maximisation of these two non-linear problems with constraints (experimental domain), the Sequential Quadratic Programming (SQP) method described by Fletcher and Leyffer (2002) and Wilson (1963) was utilised. The BFGS method (Broyden-Fletchner-Goldfarb-Shanno) was used for evaluation of the Hessian matrix.
Table 2: Real variable values of the factors and the respective levels in codified form.
Levels
Factor Unit Symbol
-1 0 +1
Excess of Al wt% in relation to stoichiometric amount X1 0 15 30 Iron quantity wt% of Cr in hypothetical alloy X2 70 60 50
Iron compound used (g of Fe0) [g of Fe total (from Fe0 and Fe2O3)]-1 X3 0 0.5 1
Table 3: Prices and specification of raw materials used in the gross margin optimisation.
Raw material Price (USD kg-1) Purity/composition Reference
Ash 0.00 See Table 1 -
Aluminum 2.34 96% of Al (IndexMundi, 2010)
Iron ore 0.18 68% Fe (97% Fe2O3) (IndexMundi, 2010)
Chromic acid 2.30 98% CrO3 a
Metallic iron 0.235 96% Fe (MetalPrice, 2010)
Low-carbon ferrochromium 4.96 65-60% Cr; 0.15% max carbon (MetalPrice, 2010)
a mean of prices from various Brazilian importers.
RESULTS AND DISCUSSION
Factorial Design
Table 4 shown the results obtained for the experiments using the 24 full factorial design. The
factor notations presented in Table 2 were maintained. The results obtained in the experimental domain presented large variations in conversion for the different factor combinations, until reaching 75.6%. Figure 1 shows a photograph of a typical alloy obtained in the experiments.
Table 4: Experiments of 24 factorial design with central points.
Run X1a X2b X3c X4d Y e
1 30 (+1) 50 (+1) 1 (+1) 10 (+1) 0.0
2 0 ( - 1) 50 (+1) 1 (+1) 10 (+1) 0.0
3 30 (+1) 70 ( - 1) 1 (+1) 10 (+1) 3.5
4 0 ( - 1) 70 ( - 1) 1 (+1) 10 (+1) 36.9
5 30 (+1) 50 (+1) 0 ( - 1) 10 (+1) 60.2
6 0 ( - 1) 50 (+1) 0 ( - 1) 10 (+1) 32.8
7 30 (+1) 70 ( - 1) 0 ( - 1) 10 (+1) 21.9
8 0 ( - 1) 70 ( - 1) 0 ( - 1) 10 (+1) 38.2
9 30 (+1) 50 (+1) 1 (+1) 0 ( - 1) 16.0
10 0 ( - 1) 50 (+1) 1 (+1) 0 ( - 1) 46.8
11 30 (+1) 70 ( - 1) 1 (+1) 0 ( - 1) 44.1
12 0 ( - 1) 70 ( - 1) 1 (+1) 0 ( - 1) 0.0
13 30 (+1) 50 (+1) 0 ( - 1) 0 ( - 1) 75.6
14 0 ( - 1) 50 (+1) 0 ( - 1) 0 ( - 1) 27.2
15 30 (+1) 70 (- 1) 0 ( - 1) 0 ( - 1) 0.3 44.9
16 0 ( - 1) 70 ( - 1) 0 ( - 1) 0 ( - 1)
37.6 43.0
17 15 (0) 60 (0) 0.5 (0) 5 (0)
37.4
a
Al quantities: real (excess% of stoichiometric amount) and coded factor (in parentheses); b iron quantity: real (wt% of Cr in hypotetical alloy) and coded factor (in parentheses); c iron compound: real (metallic Fe mass fraction added) and coded factor (in parentheses); d CrO
3 addition: real (wt% in respect to ash used) and coded factor (in parentheses); e experimental chromium
conversion to metallic form (wt%).
Brazilian Journal of Chemical Engineering Vol. 30, No. 01, pp. 141 - 154, January - March, 2013
Table 5 shows the variance analysis applied for determination of the significance of factors and the factor interaction effects, and the presence of quadratic curvature (i.e., the second-order model). The experimental variance (experimental error pre-sented in Table 5) was considered to be uniform among non-correlated experiments, and its value was obtained on the basis of two replicates performed under two experimental conditions: the 16th and 17th runs (the central point of the experimental region) (see Table 4).
Table 5: Analysis of variance (ANOVA) for effects of full factorial design and quadratic curvature.
Source of variation
Sum of squares
Degrees of
freedom F-value p-value Decision
a
X1 0.2 1 0.0071 0.94 NS
X2 328 1 16 0.06 NS
X3 1409 1 67 0.01 S
X4 208 1 9.8 0.09 NS
X1X2 524 1 25 0.04 S
X1X3 93.4 1 4.4 0.17 NS
X1X4 116 1 5.5 0.14 NS
X2X3 838.8 1 40 0.02 S
X2X4 478 1 23 0.04 S
X3X4 354 1 17 0.05 NS
X1X2X3 1904 1 90 0.01 S X1X3X4 158 1 7.5 0.11 NS X1X2X4 245 1 12 0.08 NS X2X3X4 59.1 1 2.8 0.24 NS X1X2X3X4 1481 1 70 0.01 S Pure quadratic
curvature
273 1 13 0.07 NS
Experimental error
42 2
a
Based on a 95% confidence level (significance level, α=0.05): S – significant; NS – non-significant.
The experimental 95% confidence interval was calculated as ±15.7 and ±12.0% for the 16th and 17th runs, respectively. To test the factors and the factor interaction effects, the variance associated with experimental error was compared with the variance associated with the change of factor level or factor interactions by computation of an F-value (see Table 5). The p-value (the probability of obtaining a true null hypothesis) was computed using the Fisher distribution. Note: the null hypothesis considers that the experimental variance is comparable to the variance associated with a change of factor levels or factor interactions. Therefore, assuming a significance level of 0.05 (95% confidence level), the following effects and interactions were considered significant: X3, X1X2, X2X3, X2X4, X1X2X3, X1X2X3X4. This involves all of the factors that were investigated.
Figure 2 shows the Pareto chart of effects for the 24 full factorial design. The vertical line corresponds
to a 95% confidence level (p-value = 0.05) above which the effects are significant. The most pronounced effect is the interaction of X1, X2 and X3 with negative values.
Figure 2: Pareto chart of standardised effects for a 24 full factorial design.
Experimental variance was also compared with the variance of the pure quadratic curvature, which was calculated from the central point experiments, according to other studies (Fernández et al., 2010; Gómez and Callao, 2008; Montgomery, 2009). Table 5 shows no evidence of a second-order curvature (considering a 95% confidence level).
Response Surface Model
Table 6: Variance analysis of the models.
Groups Variability between groups
Variability within
group "B" F-test
Model prediction quality
A B Sum of
squares
Degrees of freedom
Sum of squares
Degrees of
freedom F-value p-value R
2 R
Adj2
Decisiona
Model 1 Experimental 145 1 42 2 6.8 0.12 0.983 0.722 S Model 2 Experimental 1.71x10³ 10 42 2 8.1 0.12 0.795 0.673 S
Model 3 Experimental 3.19x10³ 11 42 2 14 0.07 0.618 0.444 S Model 2 Model 1 1.56x10³ 9 145 1 1.20 0.615 Model 2 Model 3 Model 2 1.48x10³ 1 1.71x10³ 10 8.68 0.015 Model 2
a Based on a 95% confidence level (significance level, α=0.05); S – significant, Model 2 – model 1 is not significantly better
than model 2 or model 2 is significantly better than model 3.
The decision of which model was more appropriate to predict the response was made from the results of the F-test for model comparison (see Table 6). The variability between models was compared to the variance of a model with more parameters. From the Model 2 and Model 1 comparison, it was concluded that Model 1 is not significantly better than Model 2 (the null hypothesis stated that the variability between models is equal to the variability of Model 1, and this cannot be rejected), although there was a decrease of the adjusted coefficient of determination value. In contrast, a comparison of Model 3 with Model 2 showed that the null hypothesis is rejected. In this sense, Model 2 is significantly more appropriate than Model 3.
In view of the conclusion obtained in Table 6, Model 2 was used for the subsequent problem interpretation. Equation (14) represents this model. The parameters are shown with 95% confidence intervals calculated by the t-test. The variance obtained in the main diagonal of the parameter-covariance matrix was utilised for this variability estimation.
(
) (
)
(
)
(
)
(
)
(
)
(
)
mod 3
1 2
2 3
2 4
1 2 3
1 2 3 4
Y 28.5 2.5 9.38 2.56 X
5.72 2.56 X X
7.24 2.56 X X
5.47 2.56 X X
10.91 2.56 X X X
9.62 2.56 X X X X
= ± − ±
+ ±
− ± +
− ±
− ±
+ ±
(14)
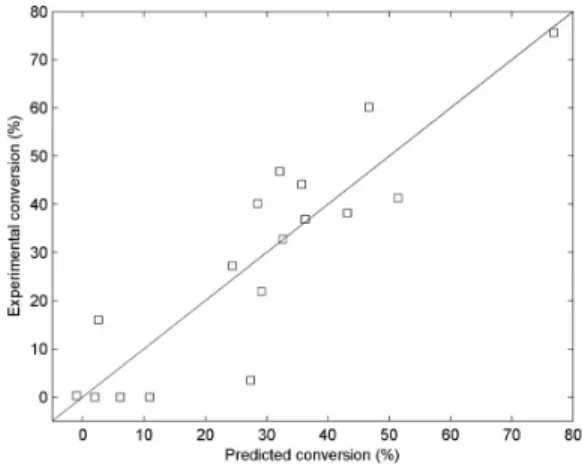
The computation of an error-prediction covariance matrix allowed the estimation of variance for the predicted values of conversion obtained by the model adopted. The t-test applied resulted in a 95% confidence interval of ±12.3% for values predicted by the model in the experimental region, which was the maximum confidence interval obtained in this study. Figure 3 shows the comparison of chromium
conversion results obtained in the experiments with the values predicted by the model (Equation (14)).
Figure 3: Comparison of the measured conversion results and the predicted results calculated using the proposed model.
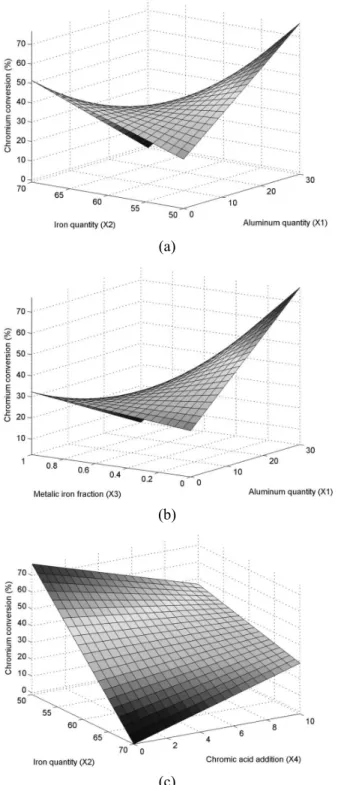
Figure 4 shows some response surfaces for chromium conversion in the system as a function of real variables, using Equation (14).
Brazilian Journal of Chemical Engineering Vol. 30, No. 01, pp. 141 - 154, January - March, 2013
(a)
(b)
(c)
Figure 4: Chromium conversion response surfaces as a function of: (a) Al amount and iron quantity, using Fe2O3 as iron source (metallic iron mass fraction = 0) and no chromic acid addition; (b) Al amount and metallic iron mass fraction, for maximum iron addition (50 wt% of chromium in hypothetical alloy) and no chromic acid addition; (c) iron quantity and chromic acid addition, for maximum Al utilisation and Fe2O3 as the iron source.
Figure 4(b) shows the effects of the metallic iron mass fraction and Al quantities studied when the maximal quantity of iron is used and no chromic acid is added. For 30 wt% excess of Al in relation to the stoichiometric amount, the utilisation of metallic iron causes a decrease in chromium conversion from the maximal value to ~3%. This effect is related to the energy liberation upon reduction of Fe2O3 by Al. However, the use of Fe2O3 causes a greater consumption of Al, which is the more expensive raw material.
In Figure 4 (c), the surface response for chromium conversion as a function of the iron quantity and chromic acid employed in the reaction shows that increases in the amount of added chromic acid resulted in different effects on the response evaluated, whereas in the maximal utilisation of Al only Fe2O3 is employed. When a minimal quantity of iron is used, the reaction energy of chromic acid reduction contributes to a better performance. In the maximal addition of iron (III) oxide, the use of chromic acid presented a reduction in conversion. This can be explained by considering the fact that the calculation of conversion is based on the amount of chromium present in the ash, but does not consider chromium added as CrO3 (see Equation (11)). Considering two systems with equal global chromium reduction per-centage (considering Cr from ash and chromic acid), the chromium conversion (Y) will be less in the system with addition of CrO3. This shows that the lower conversion is due to the proportion of Cr from the CrO3 that is not converted and is present in the slag phase. The different situations of Figure 4 (c) can be explained from the analysis of the vertices in a counter-clockwise direction from the frontal vertex: 1) in this situation, lower conversion occurs because the chemical boosters CrO3 and Fe2O3 were used in lower quantities; 2) with the addition of CrO3, the largest energy released in the exothermic reaction corresponds to the best performance; 3) increasing the quantity of Fe2O3 causes a higher energy libera-tion, resulting in an improvement in the reduction percentage; and 4) the energy contribution from boosters of the previous situation was greater than necessary, and the conversion increases with the removal of CrO3 due to the fact that the unconverted part of CrO3 is no longer present in the slag phase.
Optimisations
function concerns the difference between the revenue of the product obtained in this process and the cost of raw materials, which is a gross margin analysis, and was calculated according to Equation (12).
Two non-linear optimisation problems were formulated for this case: 1) the conversion (Equation (14)) maximisation; and 2) the gross margin (Equation (12)) maximisation. These two problems with con-straints (experimental domain) were solved using SQP with BFGS. The optimal operational conditions are shown in Table 7.
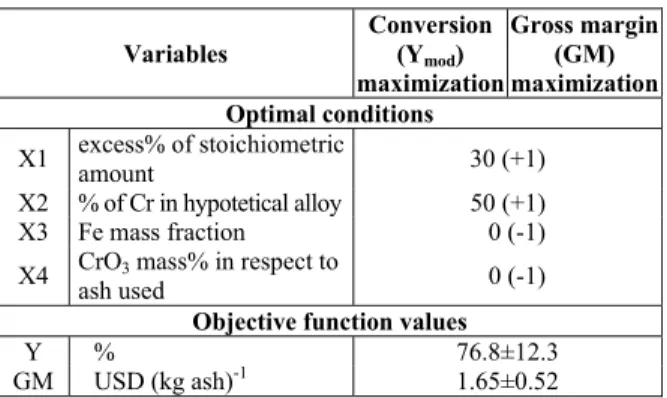
Table 7: Optimisation results.
Variables
Conversion (Ymod)
maximization
Gross margin (GM) maximization Optimal conditions
X1 excess% of stoichiometric
amount 30 (+1)
X2 % of Cr in hypotetical alloy 50 (+1) X3 Fe mass fraction 0 (-1) X4 CrO3 mass% in respect to
ash used 0 (-1)
Objective function values
Y % 76.8±12.3
GM USD (kg ash)-1 1.65±0.52
The same optimal operating conditions were obtained for these problems, and corresponded to: a 30 wt% excess of Al in relation to the stoichiometric amount (level +1 of X1 factor); the maximum addition of iron in the system, i.e., a 50 wt% of chromium in the hypothetical alloy (level +1 of X2 factor); Fe2O3 as the source of iron in the system, i.e., zero as the mass fraction of metallic iron added (level -1 of X3 factor); and no chromic acid addition (level -1 of X4 factor). In these conditions, 76.8±12.3% of chromium was converted from oxide to metallic form, and a gross margin of 1.65±0.52 USD (kg ash)-1 was obtained.
Volkert and Frank (1972) cited by Nelson (1996) suggest a general rule for a self-sustained alumino-thermic reaction and an adequate metal-slag separation:
o 25ºC H
Δ < -302 kJ (mol Al)-1. The optimal conditions of Table 7 satisfy this rule.
The results obtained in this research showed that a relatively high gross margin is possible in aluminothermic reduction of chromium oxide from leather waste ash.
Alloy Quality Investigation
In order to verify the quality of the alloys produced by the method proposed in this research, a micrographic investigation by SEM coupled with
EDS analysis was performed. For this, the alloys obtained in experimental runs nº 13 (with the highest conversion) and 4 were used. Run nº 4 was selected in view of the opposite levels of factors in comparison with run nº 13.
Figure 5 (a)-(d) show four typical external surfaces observed in samples at various magnifications. The surface of Figure 5 (e) was prepared by a manual polishing, which was aimed at verification of the internal composition of the piece.
In Table 8 the results (wt%) of the marked points in the photographs of Figure 5 are presented, and also the mean of several EDS analyses performed on alloy pieces of experiments nº 4 and 13. Although a semi-quantitative method, the means of the EDS results for the experimental runs nº 4 and 13 were taken as the basis for inference of the conversions of ash compounds capable of reduction (according to chemical Equations (1) to (6)) and are shown in Table 8. The chromium reduction percentages calculated by EDS analysis (32.6 and 98.8% for runs nº 4 and 13, respectively) presented differences of 4.3 and 20.8 compared with data presented in Table 4. Phosphorus and iron reduction percentages were similar for the two experimental conditions. In comparison to experiment nº 4, run nº 13 presents a significantly higher reduction percentage for oxides of silicon, titanium, sulphur, and chromium, probably due to a higher quantity of Al in the system (factor X1 in level +1), the utilisation of Fe2O3 as an iron source (X3 in level -1), and greater employment of iron (X2 in level +1), which act as a chemical booster.
In terms of the chemical requirements for Fe-Cr-LC (presented in standard specification A101 (ASTM, 2004)), the following elements are not in accordance: Cr, Ti, S and P. The silicon content in alloys is adequate, since grade A of Fe-Cr-LC tolerates contents up to 8 wt%. For others grades of Fe-Cr-LC amounts below 1% are required. Using EDS analysis, the presence of copper and carbon was not detected.
The chromium content of the alloy from run nº 13 was slightly below the specification of a grade A Fe-Cr-LC. This can be adjusted by employing less iron, by a small decrease of the coded factor X2.
Brazilian Journal of Chemical Engineering Vol. 30, No. 01, pp. 141 - 154, January - March, 2013
(a) (b)
(c) (d)
(e)
Figure 5: Microstructure photographs of Fe-Cr-LC samples: (a) and (b) – experiment nº 4 (magnifications: 400x and 190x, respectively); (c), (d) and (e) – experiment nº 13 (magnifications: 2000x, 900x and 300x).
Table 8: EDS results for the Fe-Cr-LC alloys (wt%) of Fig. 5, means of various observation and approximate conversions.
Experiment nº 4 Experiment nº 13
Element
Fig. 5 (a), 1 Fig. 5 (a), 2 Fig. 5 (b) Meana YEDS (%)b Fig. 5 (c) Fig. 5 (d) Fig. 5 (e) Meana YEDS (%)b
Si 2.08 2.08 1.98 1.56 8.5 0.92 1.27 2.65 1.66 25.1 P 1.57 1.58 2.00 2.83 63.9 0.49 0.08 0.47 0.82 51.3 S 0.08 0.08 0.39 0.35 11.4 ND 0.51 0.08 0.91 83.3
Ti ND ND ND 0.08 0.4 0.55 13.07 0.57 5.22 73.1
The content of phosphorus and sulphur was much higher than required in all grades and types of ferrochromium alloy (ASTM, 2004). For Fe-Cr-LC, the requisite maximum is 0.025 wt% for sulphur and 0.030 wt% for phosphorus. This is due to the well-known difficulty of controlling these elements during steel production. The presence of P and S affects the mechanical properties of steel (Chiaverini, 2005). In reduction, phosphorous and sulphur are promptly transferred from the slag to the metal phase. Therefore, a method for extraction of these elements directly from ash is required.
CONCLUSIONS
In this study we proposed a new raw material for low-carbon ferrochromium alloy production: the reutilisation of chromium oxide contained in footwear leather waste ash obtained from a thermal treatment process. The aluminothermic reduction was investigated through a 24 full factorial design where the chromium oxide reduction percentage was the response variable. The following factors were selected for process description: the quantity of Al employed for the reduction reaction, the iron amount added, the type of iron compound (Fe0 and/or Fe3+ oxide), and chromic acid addition. Variance analysis showed that all of the investigated factors had a significant effect on the system. Central point experiments were executed to test for possible quadratic curvature. Because the results indicated that a second-order model was no more adequate than a first-order model for response prediction, three linear first-order models were then proposed. Variance analysis was employed in model validation, also providing the indication of the best model. For the selected model, predicted values have a confidence interval of ±12.3% in the experimental region. The response surface model was utilised in two different non-linear optimisation problems, namely, the maximisation of chromium conversion, and the gross margin. Both resulted in same process conditions: maximal utilisa-tion of Al, with a 30% excess of the stoichiometric amount, maximal iron addition, using 50 wt% of chromium in a hypothetical alloy, the utilisation of Fe2O3 as the iron source, and no chromic acid addition. Under these conditions, the chromium conversion was estimated to be 76.8±12.3%, with a gross margin of 1.65±0.52 USD (kg ash)-1. In view of the gross margin results, the process may be economically interesting. The alloy quality of two samples (with highest conversion and the test with opposite values of the factors) was investigated by
SEM coupled with EDS analysis. This showed that the Cr content was slightly below the specification of a grade A Fe-Cr-LC; the Si content was adequate for grade A, Ti presented large amounts, but is not considered deleterious, but P and S levels were much higher than the level required for all grades and types of Fe-Cr-LC. Therefore, more studies aimed at the pre-treatment of ash to remove phosphorus and sulphur are required.
ACKNOWLEDGMENTS
The authors are very grateful to CAPES, CNPq and FAPERGS for the financial support and to Prof. Daniel J. Daroit for the review and helpful comments on the manuscript.
NOMENCLATURE
Fe-Cr-LC
Low-carbon
ferrochromium alloy
(-)
GF-AAS Graphite furnace atomic absorption spectroscopy
(-)
SQP Sequential Quadratic Programming
(-)
BFGS Broyden-Fletchner-Goldfarb-Shanno method for evaluation of the Hessian matrix
(-)
X1 Al quantity employed in the reaction, expressed as excess of stoichiometric amount
% excess
X2 Iron amount added
expressed as Cr amount in hypothetical alloy
wt% of Cr
X3 Iron compound (Fe and/or Fe2O3) used – expressed as metallic iron mass fraction
(g of Fe0) [g of Fe total (from Fe0and Fe2O3 added)]-1 X4 Chromic acid addition, in
relation to ash mass
wt%
Y Experimental chromium
conversion (response variable); Equation (11)
%
slag
Cr
x Mass fraction of Cr in slag phase (measured in each run)
(-)
mslag Mass of slag (measured In each run)
g
ash
Cr
x Mass fraction of Cr in ash (0.4262, according to the characterization)
Brazilian Journal of Chemical Engineering Vol. 30, No. 01, pp. 141 - 154, January - March, 2013
mash mass of ash employed in experiments (50 g)
g
Ymod Predicted chromium conversion (response variable); Equation (14)
%
GM Gross margin; Equation (12) USD (kg ash)-1 pi Price of compound/
product “i” (i = Fe-Cr-LC, Fe2O3, CrO3, Al or Fe); for raw material, is the division of price by purity of the interested
compound
USD (kg of “i”)-1
mj Mass of compound “j” employed as raw material in the process (j = Fe, Fe2O3, CrO3 and Al); Equations (7) to (10)
(g of “j”) (g of ash)-1
mR Mass of reducible compounds of the charge (mass of hypothetical alloy minus mass of metallic iron added); Equation (13)
g (g of ash)-1
R2 Coefficient of determination
(-)
R2Adj Adjusted coefficient of determination
(-)
YEDS Conversion of reducible compounds calculated on the basis of the EDS mean analysis
%
REFERENCES
ASTM, Standard Practices for Dissolution of Refuse-Derived Fuel (RDF) Ash Samples for Analyses of Metals, E886. American Society for Testing and Materials (1994).
ASTM, Standard Specification for Ferrochromium, A101. American Society for Testing and Materials (2004).
ASTM, Standard Specification for Chromium Metal, A481. American Society for Testing and Materials (2005).
ASTM, Standard Test Methods for Instrumental Determination of Carbon, Hydrogen, and Nitrogen in Laboratory Samples of Coal, D5373. American Society for Testing and Materials (2008).
ASTM, Standard Test Methods for Chromic Oxide in Leather (Perchloric Acid Oxidation), D2807. American Society for Testing and Materials (2009).
Blankenship, L. J., Manning, F. C. R., Orenstein, J. M. and Patierno, S. R., Apoptosis is the mode of cell-death caused by carcinogenic chromium. Toxicology and Applied Pharmacology, 126, (1), 75-83 (1994).
Bodaghi, M., Zolfonoon, H., Tahriri, M. and Karimi, M., Synthesis and characterisation of nanocrystalline [alpha]-Al2O3 using Al and Fe2O3 (hematite) through mechanical alloying. Solid State Sciences, 11, (2), 496-500 (2009).
Brady, G. S., Clauser, H. R. and Vaccari, J. A., Materials Handbook. McGraw-Hill Handbooks (2002).
Chiaverini, V., Aços e Ferros Fundidos: Característi-cas gerais, tratamentos térmicos, principais tipos. Associação Brasileira de Metalurgia e Materiais, São Paulo (2005). (In Portuguese).
Dettmer, A., Nunes, K. G. P., Gutterres, M. and Marcílio, N. R., Obtaining sodium chromate from ash produced by thermal treatment of leather wastes. Chemical Engineering Journal, 160, (1), 8-12 (2010a).
Dettmer, A., Nunes, K. G. P., Gutterres, M. and Marcílio, N. R., Production of basic chromium sulfate by using recovered chromium from ashes of thermally treated leather. Journal of Hazardous Materials, 176, (1-3), 710-714 (2010b).
Fathima, N. N., Rao, J. R. and Nair, B. U., Chromium(VI) formation: Thermal studies on chrome salt and chrome tanned hide powder. Journal of the American Leather Chemists Association, 96, (11), 444-450 (2001).
FEPAM, Relatório sobre a Geração de Resíduos Perigosos Industriais no Estado do Rio Grande do Sul. Fundação Estadual de Proteção Ambiental Henrique Luiz Roessler - RS (2003). (In Portuguese). Fernández, C., Larrechi, M. S. and Callao, M. P.,
Modelling of the simultaneous photodegradation of Acid Red 97, Acid Orange 61 and Acid Brown 425 using factor screening and response surface strategies. Journal of Hazardous Materials, 180, (1-3), 474-480 (2010).
Ferreira, A. L. O., Giordano, R. L. C. and Giordano, R. C., Improving selectivity and productivity of the enzymatic synthesis of ampicillin with immobi-lized penicillin G acylase. Brazilian Journal of Chemical Engineering, 21, 519-529 (2004). Fletcher, R. and Leyffer, S., Nonlinear programming
without a penalty function. Mathematical Program-ming, 91, (2), 239-269 (2002).
Science and Technology. Elsevier, Oxford, pp. 5481-5486 (2001).
Godinho, M., Gaseificação e combustão de resíduos sólidos da indústria calçadista. Federal University of Rio Grande do Sul, Porto Alegre, pp. 96 (2006). (In Portuguese).
Godinho, M., Birriel, E. J., Marcilio, N. R., Masotti, L., Martins, C. B., Wenzel, B. M., High-temperature corrosion during the thermal treatment of footwear leather wastes. Fuel Processing Technology, v. 92, p. 1019-1025 (2011).
Godinho, M., Marcilio, N. R., Faria Vilela, A. C., Masotti, L. and Martins, C. B., Gasification and combustion of the footwear leather wastes. Journal of the American Leather Chemists Association, 102, (6), 182-190 (2007).
Godinho, M., Marcilio, N. R., Masotti, L., Martins, C. B., Ritter, D. E., Wenzel, B. M., Formation of PCDD and PCDF in the thermal treatment of footwear leather wastes. Journal of Hazardous Materials, (Print), v. 167, p. 1100-1105, (2009). Gómez, V. and Callao, M. P., Modeling the
adsorption of dyes onto activated carbon by using experimental designs. Talanta, 77, (1), 84-89 (2008).
IndexMundi, Commodity Price Indices: Aluminium; Iron Ore. (October 2010). http://www.indexmundi. com/ (Accessed in November 1, 2010).
Langard, S., 100 years of chromium and cancer - a review of epidemiological evidence and selected case-reports. American Journal of Industrial Medicine, 17, (2), 189-215 (1990).
MetalPrice, Brazil Scrap/Steel Iron (April 2009); Chrome metal and Ferrochrome prices, electrolytic, aluminothermic and ferro chromium (December 2007). http://www.metalprices.com/ (Accessed in November 1, 2010).
Milacic, R. and Stupar, J., Fractionation and oxidation of chromium in tannery waste- and sewage sludge-amended soils. Environmental Science & Technology, 29, (2), 506-514 (1995).
Montgomery, D. C., Design and Analysis of Experi-ments. John Wiley & Sons, New York (2009). Nahui, F. N. B., Nascimento, M. R., Cavalcanti, E.
B. and Vilar, E. O., Electroflotation of emulsified oil in industrial wastes evaluated with a full factorial design. Brazilian Journal of Chemical Engineering, 25, 435-442 (2008).
Nelson, L. R., The preparation of chromium metal by a sealed, cold-hearth, plasma-assisted alumino-thermic process. The Journal of The South African Institute of Mining and Metallurgy, July/August (1996).
Shibata, E., Egawa, S. and Nakamura, T., Reduction behavior of chromium oxide in molten slag using aluminum, ferrosilicon and graphite. ISIJ International, 42, (6), 5 (2002).
Tsou, T.-C., Lin, R.-J. and Yang, J.-L., Mutational spectrum induced by Chromium(III) in shuttle vectors replicated in human cells: Relationship to Cr(III)-DNA interactions. Chemical Research in Toxicology, 10, (9), 962-970 (1997).
Venugopalan, R. and Sathiyamoorthy, D., Investigation through factorial design on novel method of preparing vanadium carbide using carbon during aluminothermic reduction. Journal of Materials Processing Technology, 176, (1-3): 133-139 (2006). Vieira, M. S., Recuperação do cromo contido nas
cinzas provenientes da incineração de resíduos sólidos das indústrias coureira e calçadista visando a obtenção de cromato de sódio (VI). Federal University of Rio Grande do Sul, Porto Alegre, pp. 120 (2004). (In Portuguese).
Volkert, G. and Frank, K. D., The metallurgy of ferroalloys. Springer, Berlin (1972).
Wenzel, B. M., Redução carbotérmica do cromo contido nas cinzas do tratamento térmico de resíduos de couro visando a obtenção de liga ferrocromo e sulfato de cromo. Msc. Federal University of Rio Grande do Sul, Porto Alegre, pp. 120 (2008). (In Portuguese).
Wenzel, B. M., Marcilio, N. R., Godinho, M., Masotti, L. and Martins, C. B., Iron and chromium sulfates from ferrochromium alloy for tanning. Chemical Engineering Journal, 165, (1), 17-25 (2010). Wilson, R. B., A Simplicial Algorithm for Concave