536
ADSORPTION- DESORPTION FOR SOME HEAVY METALS
IN THE
PRESENCE OF SURFACTANT ON SIX AGRICULTURAL SOILS
Rounak M. Shariff 1 & Lawen S. Esmail 2 1,2
The University of Salahaddin- Erbil, College of Science, Department of Chemistry, Kurdistan Region, Iraq
ABSTRACT
The present work investigate the effects of surfactant on the sorption of some heavy metals as Zinc, Nicle and Copper at different initial concentrations on six selected soil samples through batch equilibrium experiments. The pH-adjusted for each metal has been varied from 3 to7. Linear, Freundlich and Langmuir models were used to describe the sorption processes. The sorption data fitted very well with both Freundlich and Langmuir isotherm model which gave high correlation coefficients. Freundlich coefficient KF values for adsorption process varied between 1.582 - 2.121 mlg-1, 1.781- 2.054 mlg-1 and 1.291- 1.958 mlg-1 for Zinc, Nicle and Copper respectively. Langmuir coefficient KL values for adsorption process varied between 0.012 - 0.029 mlg-1, 0.017 - 0.057 mlg-1 and 0.008- 0.021 mlg-1 for Zinc, Nicle and Copper respectively. The pseudo- second order kinetic model was most agreeable with the experiments. An inionic surfactants sodium dodecyl sulfate (SDS) at critical micelles concentration (cmc ) were tested for their adsorption-desorption potential, was found to be fairly effective to removal of more than 61, 64, and 68% of sorbed metals Zinc, Nicle and Copper respectively. The Freundlich coefficient for desorption processes KFdes values varied between 1.637 - 1.944 mlg-1, 1.652- 2.311 mlg-1 and 1.546- 2.304 mlg-1 for Zinc, Nicle and Copper respectively. Langmuir coefficient KLdes values for desorption process varied between 0.025 - 0.080 mlg-1, 0.083 - 0.117 mlg-1 and 0.041- 0.222 mlg-1 for Zinc, Nicle and Copper respectively.
Keywords:Adsorption- Desorption Isotherms, Zinc, Nicle, Copper, Surfactant. 1. INTRODUCTION
Heavy metals are toxic to our environmental quality, and pose a threat to groundwater through that metal contaminants can remain on site for long time until they are been removed. Remediation of heavy metal contaminated soils represents a formidable challenge[1]. The Sorption of heavy metals onto soil particles affects the movement and fate of heavy metals in soil. Therefore, accurate description of the retention or sorption process of heavy metal is important. The sorption –desorption of heavy metals from soils can affected by many factors as pH, temperature, and residence time. The effective remediation of contaminated soils should be explained through the mechanism of heavy metal interaction with soil and factors that affect their retention and /or release from these particles [2&3].
Surfactants have shown some potential for remediation of heavy metal from soil. It is possible that surfactant adsorption may displace adsorbed metals, thereby mobilizing them. Factors affecting soil washing/soil flushing processes include clay content, humic material, metal concentration, particle size distribution/soil texture, separation coefficient, and wash solution [4]. The mechanism of surfactant enhanced heavy metal removal from soil surface is ion exchange, precipitation-dissolution, and counterion binding [5&6]. It is necessary to take into account the characteristics of the surfactant (e.g., chemical structure, hydrophilic-lipophilic balance [HLB], or its concentration in the soil-water system, the solubility and hydrophobicity of the characteristics of soil (e.g., OM, clay content) [7&8]. The concentration at which micelles form is known as the critical micelle concentration (cmc), surfactants above the cmc level may greatly increase the solubility of less hydrophilic organic pollutants. Surfactants are classified according to the nature of the hydrophilic portion of the molecule[9&10]. Zinc is the most common elements in the earth's crust it is highly soluble and therefore very mobile in aquatic system [11]. Nickel is a very abundant natural element. Pure nickel is a hard, silvery-white metal .Nickel is carcinogenic metal and associated with reproductive problems and birth defect [12] . Copper is a reddish-colored metal; it has its characteristic color because of its band structure[13].
2. MATERIALS AND METHODS 2.1. Soils
537 2.2. Metals
Analytical grad substituted heavy metals (Zn, Ni, and Cu) were selected for adsorption studies. Zn(NO3)2.6H2O (fluka AG, Chemische fabrik, CH-9470 Buchs). NiCl2.6H2O (fluka, Garntie,MG 237.71, Switzend). CuCl2.H2O (B.D.H.laboratory chemicals, trade mark product No.10088,England). The anionic sodium dodecyl sulphate (SDS), ( B.D.H), formula is C18H29SO4Na, and the molecular weight is 448 g moL-1, while the cmc is 2.38 gL-1. All chemicals used were of analytical grade reagents and used without pre-treatments. Standard stock solutions of the metals were prepared in deionised water.
2.3. Adsorption Experiments
Kinetic studies indicated that metal ion adsorption were characterized by a rapid adsorption processes, for Zn, Ni, and Cu were carried out through batch method[14&15]. Duplicate air-dried soil samples were equilibrated with
different metal initial concentration (50, 100, 150 and 200) μgml-1
, were for each metal alone at the soil solution ratios 1:10 gml-1, in 18 ml glass tube fitted with Teflon-lined screw caps. The samples plus blanks (no metal) and control (no soil). The samples were shaken continuously at temperature controlled (25 0C) water bath shaker (185 rpm) for different contact time intervals (15, 30, 60, 120, 180, 240, 480 and 600) hours. The tubes were centrifuged for 20 min. at 3500 rpm. The clear supernatant was removed and analyzed for the metal ion of Zn, Ni, and Cu solution with by atomic absorption spectrophotometer AAS. The initial pH solution values were adjusted at 6.0 for Zn, 5.6 for Ni, and 5.9 for Cu using 0.1M NaOH and 0.1M HCl. The total amount of metal adsorbed in the adsorption processes was calculated from the difference between the amount added initially and that remaining in solution after equilibration. The measured liquid phase concentrations were then used to calculate the adsorption capacity. Desorption experiments were done as each test tube was placed in a thermostated shaker at 25ºC after equilibration for 24 h with different metals concentrations (50, 100, 150, and 200) µg ml-1, the samples were centrifuged, 5ml of supernatant was removed from the adsorption equilibrium solution and immediately replaced by 5ml of SDS and was this repeated for four times. The resuspended samples were shaken for (15, 30, 60, 120, 180, 240, 480 and 600) min for the kinetic study. Desorption of the metal that remained on soil at each desorption stage was calculated as the difference between the initial amount adsorbed (the amount of metal sorbed at equilibrium concentration corresponding to the initial concentration) and the amount desorbed (after each removing), all determinations were carried out in duplicate.
Competitive metal ion adsorption-desorption between soil and surfactant in the soil-metal-water-surfactant system, in the presence SDS, at concentrations of 0.1cmc, cmc, and 10cmc were conducted adsorption-desorption isotherms[12&16]. The same procedure were repeated in the presence of SDS for the three metals alone and for the same agitation time, and the desorption done by removing 5ml from the adsorption equilibrium solution and immediately replaced by 5ml of water and was this repeated for four times.
3. DATA ANALYSIS 3.1. Kinetic Model
The amount of metals adsorbed (qt) per gram of soil (μgg-1) at time t, was calculated as follows[14]:
(1)
(2)
(3)
Co and Ct are the metal concentration in liquid phase at the initial and time t (in μg.ml-1) respectively, M is the weight of the soil (g), and V is the volume of the solution (ml). For the desorption intestate of (Co : Ce is used which means the equilibrium metal concentration), equation 2 calculate the sorption capacity, and equation 3 calculate the recovery or percent of metal removal. Fig. 1-a,b, and c plotted the R% vis pH for 100 µgml-1 for a- Zinc b-Nicle, and c- Copper.
3.1. 1. Pseudo-First Order Equation
The pseudo-first order rate expression known as Lagergren equationwhich describes the adsorption rate based on the adsorption capacity, generally expressed
as
[17&18]:M V C
C
qt ( o t)*
1000 *
* ) (
M V Ce
C
qe o
0
100
*
)
(
%
C
Ce
538 )
(
1 e t
t K q q
dt dq
(4)
Where qe and qt are the adsorption capacities at equilibrium and at time t, respectively (µgg-1) and K1 is the rate constant of pseudo-first order adsorption (min-1). After integration and applying boundary condition t=0 to t=t and qt=0 to qt=qt, the integrated form of equation (4) becomes as follows:
t K e Logq t
q e q Log
303 . 2
1 )
( (5)
When the values of log (qe-qt) were linearly correlated with t, the plot of log (qe-qt) versus t will give a linear relation ship from which K1 and qe can be determined from the slope and intercept of the graph respectively all the results shown in table 1-a, b, and c.
3.1. 1. Pseudo-Second Order Equation
pseudo–second order kinetic expression for the adsorption system of divalent metal ions. This model has since been widely applied to a number of metal/adsorbent adsorption system to investigate the mechanism of adsorption and the rate constants for the adsorption of metal ions on to soil samples the pseudo- second order equation given below was used[19&20]:
e e
t q
t q K q
t
2 2
1 (6)
in which K2 is the rate constant for the pseudo second order adsorption (g.μg-1min-1). The initial rate can be obtained as qt/t approaches zero:
2
2qe
K
h (7)
Where h is the initial adsorption rate (μgg-1
min-1). The results were also analyzed using the pseudo second order model. The linear variation of t/qt vise t for the selected soil samples at different initial metal ion concentration Zn, Ni, and Cu, the values of qe and K2 are determined from the slope and intercepts respectively. The initial adsorption rate (h ) , the pseudo second order regression of coefficients of determination (R2) and amount of metal ions adsorbed at equilibrium (qe) obtained from the kinetic experiments were all given in Table 1 a, b, and c.
3.2. Adsorption-Desorption Isotherms
3.2.1. Linear Adsorption-Desorption Isotherms
In the linear adsorption model, adsorption is described with distribution coefficient or Kd(ml/g) as[21]:
(8)
Where Cs (μg/g) is the concentration of the metal on the solid and Ce (μg/ml) is the concentration of the metal in the aqueous phase.Kd is the distribution coefficient, which obtained from the slope of plot of Cs versus Ce and it indicates the mobility of the metal. Values of R2 revealed that adsorption isotherms were non linear under all conditions tested so our data were not fit the linear distribution model. The values of Kd and R2 obtained are listed in Table 2,3,4.
.
3.2.2. Frendlich Adsorption-Desorption Isotherms
The Freundlich isotherm is the most widely used non linear adsorption model. Freundlich isotherm is often used for heterogeneous surface energy systems. A linear form of the Freundlich equation is given as [22]:
(9) e
d
s
K
C
C
e
F C
n K
539
Where KF is the Freundlich distribution coefficient (ml/g) related to adsorption capacity and n the exponent (correction factor) related to adsorption intensity. KFa nd n can be determined from the linear plot of Log qe versus Log Ce, as shown in Fig. 2 and 4.The model is an empirical equation based on the distribution of solute between the solid phase and aqueous phase at equilibrium[23]. Values of KF were in Table 2,3,4.revealed that our experimental data fit to Freundlich model rather than to Linear model. Adsorption isotherm parameters were calculated using the linearized form of Freundlich equation.
Desorption isotherm parameters were calculated using the linearized form of Freundlich equation[19]:
(10)
The values of KFdes and 1/n calculated from this regression equation showed that Freundlich adsorption model effectively describes isotherms for the metalses in all cases. Cs and Ce were defined previously, KFdes is Freundlich desorption coefficients, and n is a linearity factor, it is also known as desorption intensity [20-22]: (Table2,3,4.)
3.2.3. Langmuir Adsorption isotherm
Data from the batch adsorption conform to Langmuir equation[24&25]:
(11)
Cm is the maximum amount of metal adsorbed (adsorption maxima, µg ml-1), it reflects the adsorption strength and KL is the Langmuir adsorption coefficient, binding energy coefficient. The results were summarized in (Table 2, 3, 4) and shown in Fig. 3, and5.
4. RESULTS AND DISSCUSSION
The most important parameter in the adsorption processes is the initial pH value of the solution, which influences both the adsorbent surface metal binding sites and the metal chemistry in water[26]. Fig. 1-a, b, and c represents the
influence of pH on the adsorption of 100 μgml-1
for a- Zinc b-Nicle c- Copper on selected soils. At pH less than 3.0, H+ ions compete with Zn+2, Ni+2 and Cu+2 ions from reaching binding site on the surface of the adsorbent by
repulsive forces. At pH higher than 5 formation of hydroxide ions causes’ precipitation, for this reason the maximum pH value were selected to be 6.0 for Zi+2, 5.6 for Ni+2, and 5.9 for Cu+2 ions[27]. The non-linear adsorption isotherms might be expected for the compounds for which competition for a limited number of cation exchange sites contributes significantly to adsorption process.
e Fdes
s C
n K
LogC log 1log
m e
L m s
e
C C K
C C
540
Figure 1. The influence of pH on the adsorption of 100ppm for a-Zinc b-Nicle, and c- Copper on selected samples.
Kinetic studies showed that the sorption rates could be described by both pseudo first-order and pseudo second-order models. Data in table 1-a, b, and c summarized the K1 values ranged between 0.001-0.005 min- with R2 0.790-0.996, 0.002-0.009 min- with R2 0.723-0.996, and 0.002-0.008 min-1 with R2 0.856-0.944 for Zinc, Nicle, and Copper respectively. The pseudo-second order model showed a better fit with a rate constant K2 value ranged between 2.82x10⁻⁶-8.13x10⁻⁵ g.μg-1min-1 with R2 value 0.906-0.998 and h value ranged between 0.542-2.257 μgg -1
min-1for Zinc. K2 value ranged between 2.74x10⁻⁶-1.13x10⁻⁴ g.μg-1min-1 with R2 value 0.943-0.999 and h value ranged between 0.613-3.985 μgg-1min-1for Nicle. K2 value ranged between 2.98x10⁻⁶-2.24x10⁻⁴g.μg-1min-1 with R2 value 0.856-0.944 and h value ranged between 0.455-7.438 μgg-1min-1for Copper[19&28].
a-
b-
c-
0
20
40
60
80
3
4
5
6
7
8
R%
pH
0
20
40
60
3
4
5
6
7
8
R%
pH
0
20
40
60
3
4
5
6
7
8
R%
541
Table 1-a. The kinetic parameters of Adsorption process of Zinc using Pseudo-first order Lagergren model K1
and Pseudo-second order model K2 on the selected soil samples.
Soil
Initial Conc.
μgml-1
Pseudo-first order Pseudo-second order model.
K1 (min-1) R2 K2(g.μg-1min-1) h(μgg-1min-1) R2
S1 50 0.003 0.987 7.36x10⁻⁶ 0.773 0.991
100 0.004 0.790 5.12x10⁻⁶ 1.078 0.998 150 0.003 0.919 3.21x10⁻⁶ 1.611 0.997
200 0.003 0.994 3.02x10⁻⁶ 1.651 0.936 S2 50 0.003 0.975 6.69x10⁻⁶ 0.819 0.972
100 0.004 0.987 4.71x10⁻⁶ 1.323 0.958 150 0.004 0.938 3.58x10⁻⁶ 1.753 0.955 200 0.003 0.977 2.84x10⁻⁶ 1.906 0.970 S3 50 0.005 0.964 6.48x10⁻⁶ 0.858 0.980
100 0.005 0.987 5.16x10⁻⁶ 1.024 0.987 150 0.004 0.988 3.26x10⁻⁵ 1.358 0.974 200 0.003 0.980 2.89x10⁻⁶ 2.257 0.906 S4 50 0.003 0.976 9.27x10⁻⁶ 0.486 0.994
100 0.004 0.985 5.47x10⁻⁶ 1.044 0.965 150 0.005 0.957 3.76x10⁻⁵ 9.115 0.979 200 0.003 0.957 3.30x10⁻⁶ 1.575 0.987
S5 50 0.001 0.950 1.02x10⁻⁵ 0.542 0.914
100 0.004 0.976 5.04x10⁻⁶ 1.018 0.983 150 0.002 0.996 8.13x10⁻⁵ 2.077 0.989 200 0.002 0.991 3.39x10⁻⁶ 1.457 0.980 S6 50 0.003 0.977 8.89x10
-6
0.784 0.907 100 0.003 0.984 4.63x10⁻⁶ 1.151 0.974 150 0.003 0.941 3.77x10⁻⁵ 1.320 0.975 200 0.002 0.962 2.82x10⁻⁶ 1.773 0.978
Table 1-b. The kinetic parameters of Adsorption process of Nicle using Pseudo-first order Lagergren model K1
and Pseudo-second order model K2 on the selected soil samples.
Soil
Initial Conc. μgml-1
Pseudo-first order Pseudo-second order model.
K1 (min-1) R
2
K2( g.μg-1min-1) h(μgg-1min-1) R
2
S1 50 0.005 0.944 7.57x10
-6
0.656 0.955 100 0.008 0.948 5.18x10⁻⁶ 0.915 0.993 150 0.003 0.869 7.40x10⁻⁵
3.584 0.996 200 0.009 0.792 3.19x10⁻⁶ 1.569 0.943
S2 50 0.005 0.939 6.83x10
-6
0.701 0.997 100 0.007 0.921 4.26x10⁻⁶ 1.108 0.999 150 0.004 0.995 1.08x10⁻⁴ 3.907 0.999 200 0.008 0.787 2.74x10⁻⁶
1.714 0.999 S3 50 0.006 0.939 6.38x10
-6
0.739 0.999 100 0.009 0.876 4.46x10⁻⁶ 1.078 0.999 150 0.005 0.964 1.09x10⁻⁴
3.821 0.999 200 0.004 0.994 2.71x10⁻⁶ 1.711 0.999 S4 50 0.004 0.996 1.33x10
-5
0.344 0.999 100 0.006 0.723 4.80x10⁻⁶ 0.967 0.999
150 0.002 0.949 1.10x10⁻⁴ 3.729 0.999 200 0.004 0.991 3.08x10⁻⁶
1.510 0.999 S5 50 0.002 0.731 7.58x10
-6
0.613 0.990 100 0.004 0.879 4.70x10⁻⁶
0.979 0.995 150 0.005 0.919 1.13x10⁻⁴ 3.985 0.999
200 0.003 0.907 3.07x10⁻⁶
1.512 0.990 S6 50 0.006 0.862 8.47x10
-6
0.548 0.997 100 0.007 0.879 3.99x10⁻⁶ 1.165 0.999 150 0.006 0.941 1.10x10⁻⁴
3.816 0.999
542
Table 1-c. The kinetic parameters of Adsorption process of Copper using Pseudo-first order Lagergren model K1
and Pseudo-second order model K2 on the selected soil samples.
Soil
Initial Conc.
μgml-1
Pseudo-first order Pseudo-second order model.
K1 (min-1) R 2
K2(g.μg-1min-1) h(μgg-1min-1) R 2
S1 50 0.003 0.983 1.76x10
-5
1.357 0.905
100 0.004 0.995 5.82x10⁻⁶ 0.958 0.951
150 0.003 0.989 4.65x10⁻⁵ 2.093 0.935
200 0.003 0.990 2.98x10⁻⁶ 1.458 0.934
S2 50 0.005 0.973 7.65x10
-6
0.735 0.955
100 0.004 0.947 6.13x10⁻⁶ 1.471 0.856
150 0.004 0.952 8.87x10⁻⁶ 2.683 0.953
200 0.005 0.992 3.32x10⁻⁶ 1.866 0.948
S3 50 0.009 0.995 7.75x10
-6
0.764 0.972
100 0.007 0.991 5.95x10⁻⁶ 0.931 0.986
150 0.003 0.963 2.26x10⁻⁵ 6.732 0.944
200 0.007 0.995 3.60x10⁻⁶ 1.817 0.944
S4 50 0.002 0.995 8.65x10⁻⁵ 0.522 0.994
100 0.002 0.994 7.05x10⁻⁶ 0.774 0.953
150 0.002 0.837 3.80x10⁻⁵ 7.057 0.963
200 0.003 0.923 4.17x10⁻⁶ 1.238 0.980
S5 50 0.004 0.979 1.11x10⁻⁵ 0.455 0.987
100 0.004 0.965 5.66x10⁻⁶ 0.862 0.936
150 0.004 0.994 1.37x10⁻⁴ 2.195 0.989
200 0.003 0.995 3.63x10⁻⁶ 1.328 0.994
S6 50 0.006 0.899 1.89x10
-4
1.474 0.948
100 0.007 0.956 7.54x10⁻⁵ 1.474 0.967
150 0.006 0.966 2.24x10⁻⁴ 7.438 0.932
200 0.008 0.987 4.62x10⁻⁵ 2.404 0.987
Data demonstrated in table 2,a and b represents the values of partition coefficient Kd for adsorption of Zinc on selected soil sample. The Kd , standard error S.E , and R2 ranged from 6.696 -12.57 mlg-1, 0.139-0.192, and 0.705-0.946 for adsorption of Zinc respectively. While Kd, S.E , and R2 ranged from 2.816 -3.948 mlg-1, 0.102-0.188, and 0.740-0.780 for desorption of Zinc in presence of SDS respectively. To investigate the effect of surfactants on adsorption behavior of metals[11], batch equilibrium experiments performed. The presence of anionic surfactant SDS in adsorption of Zinc Kd, S.E , and R2 ranged from 4.762 -8.825 mlg-1, 0.123-0.159, and 0.735-0.895 respectively . While Kd, S.E , and R2 ranged from 6.342 -10.52 mlg-1, 0.132-0.164, and 0.635-0.765 for desorption of Zinc respectively.
Data demonstrated in table 3, a, and b represents the values of partition coefficient Kd for adsorption of Nicle on selected soil sample. The Kd, standard error S.E, and R2 ranged from 8.386 -11.09 mlg-1, 0.129-0.161, and 0.706-0.765 for adsorption of Nicle respectively. While Kd, S.E, and R2 ranged from 2.915 -8.382 mlg-1, 0.138-0.150, and 0.627-0.688 for desorption of Nicle in presence of SDS respectively. The presence of anionic surfactant SDS in adsorption of Nicle Kd, S.E, and R2 ranged from 4.804 -7.240 mlg-1, 0.121-0.158, and 0.684-0.870 respectively. While Kd, S.E, and R2 ranged from 7.466 -14.77 mlg-1, 0.110-0.171, and 0.708-0.840 for desorption of Nicle respectively.
543
A smaller Kd value indicates that a smaller amount of the soil-borne element is needed to produce 1mlg-1 of the element in solution phase thus potentially higher exposure risks[13&29].
The values of KF, n, S.E and R2 demonstrated in table 2, a, and for adsorption of Zinc on selected soil sample. The KF, n, S.E, and R2 ranged from 1.582 - 2.121 mlg-1, 1.727-2.801, 0.148-0.163, and 0.813-0.994 for adsorption of Zinc respectively. While KFdes, n, S.E, and R2 ranged from 0.943 -1.362mlg-1, 1.645-1.961, 0.135-0.147, and 0.878-0.925 for desorption of Zinc in presence of SDS respectively. The presence of anionic surfactant SDS in adsorption of Zinc KF, n, S.E, and R2 ranged from 1.337-1.839mlg-1, 1.605-2.342, 0.136-0.153, and 0.751-0.980 respectively. While KFdes, n, S.E, and R2 ranged from 1.637- 1.944mlg-1, 1.869-2.681, 0.149-0.162, and 0.763-0.930 for desorption of Zinc respectively.
The values of KF, n, S.E and R2 demonstrated in table 3, a, and b for adsorption of Nicle on selected soil sample. The KF, n, S.E, and R2 ranged from 1.781- 2.054 mlg-1, 1.968-2.597, 0.149 -0.159, and 0.886-0.999 for adsorption of Nicle respectively. While KFdes, n, S.E, and R2 ranged between 0.897-1.906 mlg-1, 1.3472.203, 0.138 -0.154, and 0.857-0.964 for desorption of Nicle in presence of SDS respectively. The presence of anionic surfactant SDS in adsorption of Nicle KF, n, S.E, and R2 ranged from 1.422 -1.725mlg-1, 1.194-2.020, 0.145-0.157, and 0.781-0.941respectively. While KFdes, n, S.E, and R2 ranged from 1.652- 2.311mlg-1, 2.074-5.780, 0.154-0.166, and 0.749-0.975 for desorption of Nicle respectively.
The values of KF, n, S.E and R2 demonstrated in table 4, a, and b for adsorption of Copper on selected soil sample. The KF, n, S.E, and R2 ranged from 1.291- 1.958 mlg-1, 1.494-2.545, 0.143-0.157, and 0.815-0.997 for adsorption of Copper respectively. While KFdes, n, S.E, and R2 ranged from 0.832-1.308mlg-1, 0.772-1.727, 0.132-0.145, and 0.886-0.987 for desorption of Copper in presence of SDS respectively. The presence of anionic surfactant SDS in adsorption of Copper KF, n, S.E, and R2 ranged from 0.865-1.920 mlg-1, 1.279-2.778, 0.134-0.148, and 0.716-0.872 respectively. While KFdes, n, S.E, and R2 ranged from 1.546- 2.304mlg-1, 1.751-5.587, 0.156-0.172, and 0.817-0.980 for desorption of Copper respectively. Our result agreed with literature. The results reveal that the model parameters are largely dependent on the initial sorbate concentration value. The KF indicates the binding affinity between the sorbate and sorbent[30].
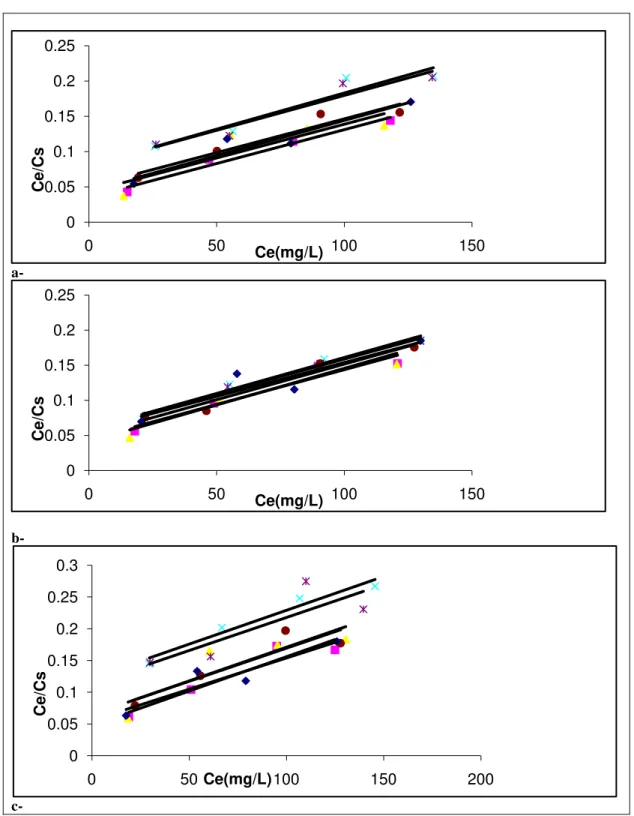
The values of KL, Cm, S.E and R2 demonstrated in table 2, a, and for adsorption of Zinc on selected soil sample. The KL, Cm, S.E, and R2 ranged from 0.012 - 0.029 mlg-1, 1000μgg-1, 0.146-0.153, and 0.877-0.974 for adsorption of Zinc respectively. While KL, Cm, S.E, and R2 ranged from 0.003 -0.013mlg-1, 500μgg-1, 0.135-0.144, and 0.750-0.808 for desorption of Zinc in presence of SDS respectively. The presence of anionic surfactant SDS in adsorption of Zinc KL, Cm, S.E, and R2 ranged from 0.008-0.017mlg-1, 1000 μgg-1, 0.149-0.157, and 0.740-0.944 respectively. While KL, Cm, S.E, and R2 ranged from 0.025 - 0.080 mlg-1, 500μgg-1, 0.133-0.141, and 0.827-0.961 for desorption of Zinc respectively.
The values of KL, Cm, S.E and R2 demonstrated in table 3, a, and b for adsorption of Nicle on selected soil sample. The KL, Cm, S.E, and R2 ranged from 0.017 - 0.057 mlg-1, 1000 μgg-1, 0.147 -0.245, and 0.878-0.987 for adsorption of Nicle respectively. While KL, Cm, S.E, and R2 ranged between 0.008-0.038 mlg-1, 500 μgg-1, 0.136 -0.141, and 0.838-0.976 for desorption of Nicle in presence of SDS respectively. The presence of anionic surfactant SDS in adsorption of Nicle KL, Cm, S.E, and R2 ranged from 0.007 -0.019mlg-1, 1000 μgg-1, 0.152-0.156, and 0.724-0.939 respectively. While KL, Cm, S.E, and R2 ranged from 0.083 - 0.117mlg-1, 500μgg-1, 0.132-0.143, and 0.855-0.996 for desorption of Nicle respectively.
The values of KL, Cm, S.E and R2 demonstrated in table 4, a, and b for adsorption of Copper on selected soil sample. The KL, Cm, S.E, and R2 ranged from 0.008- 0.021 mlg-1, 1000 μgg-1, 0.147-0.157, and 0.841-0.966 for adsorption of Copper respectively. While KL, Cm, S.E, and R2 ranged from 0.003-0.018mlg-1, 500μgg-1, 0.138-0.146, and 0.715-0.948 for desorption of Copper in presence of SDS respectively. The presence of anionic surfactant SDS in adsorption of Copper KL, Cm, S.E, and R2 ranged from 0.004-0.012 mlg-1, 1000 μgg-1, 0.153-0.162, and 0.825-0.957 respectively. While KL, Cm, S.E, and R2 ranged from 0.041- 0.222mlg-1, 500μgg-1, 0.134-0.139, and 0.912-0.986 for desorption of Copper respectively. The Langmuir sorption model served to estimate the maximum metal adsorption values Cm. The constant KL represents the affinity between the sorbate and the sorbent and it indicate the binding capasity[31].
544
at surfactant concentrations below the cmc competitive adsorption of organic compound by soil and/or by a surfactant in solution may occur, and hence an increase or decrease in desorption of compound from soil, depending on the characteristics of soil and organic compound[32].
Desorption of the neutral form was completely reversible, however, the charged species exhibited desorption-resistance fraction. The difference in sorption and desorption between the neutral and charged species is attributed to the fact that the neutral form partition by the hydrophobic binding to the soil, while anionic sorbs by a more specific exothermic adsorption reaction[33]. Desorption of soil-associated metal ions and possible mechanisms have received considerable attention in literature[34]. Desorption rates of metal ions can be characterized by three types of processes, rapid desorption, rate-limited desorption, and a fraction that does not desorbed over experimental time scale. Many factors affect the adsorption-desorption of metalion type; soil properties, organic matter, clay content, soil pH and environmental conditions[35]. The main effect of surfactant at concentrations close to cmc is to increase the affinity of metal ion for the soil with, except for soils high in clay content where the surfactant effect is to enhance the affinity of metal ion for aqueous phase.
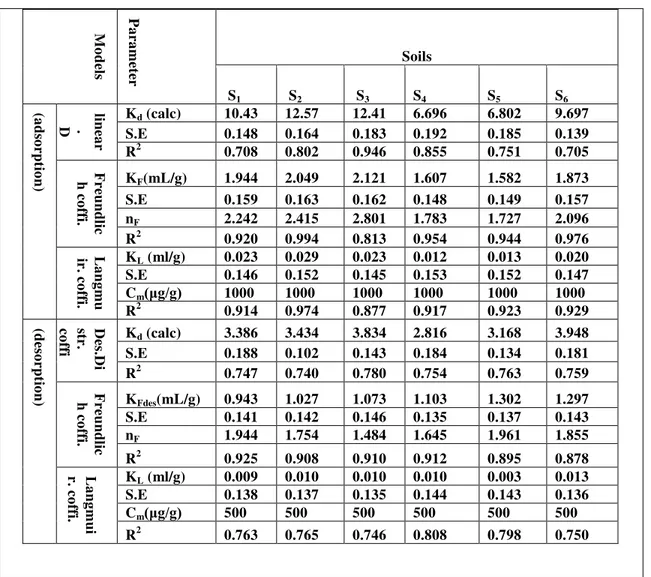
Table 2-a. The characteristic parameters of linear, Freundlich and Langmuir models isotherms for Adsorption-desorption process of Zinc on the selected soil samples.
M
o
dels
P
a
ra
met
er Soils
S1 S2 S3 S4 S5 S6
(a
ds
o
rpt
io
n)
lin
ea
r
.
D
is
tr.
Kd (calc) 10.43 12.57 12.41 6.696 6.802 9.697
S.E 0.148 0.164 0.183 0.192 0.185 0.139
R2 0.708 0.802 0.946 0.855 0.751 0.705
F
re
un
dli
c
h c
o
ff
i.
KF(mL/g) 1.944 2.049 2.121 1.607 1.582 1.873
S.E 0.159 0.163 0.162 0.148 0.149 0.157
nF 2.242 2.415 2.801 1.783 1.727 2.096
R2 0.920 0.994 0.813 0.954 0.944 0.976
L
a
ng
mu
ir.
co
ff
i.
KL (ml/g) 0.023 0.029 0.023 0.012 0.013 0.020
S.E 0.146 0.152 0.145 0.153 0.152 0.147
Cm(μg/g) 1000 1000 1000 1000 1000 1000
R2 0.914 0.974 0.877 0.917 0.923 0.929
(des
o
rpt
io
n)
Des.D
i
st
r.
co
ff
i
Kd (calc) 3.386 3.434 3.834 2.816 3.168 3.948
S.E 0.188 0.102 0.143 0.184 0.134 0.181
R2 0.747 0.740 0.780 0.754 0.763 0.759
F
re
un
dli
c
h c
o
ff
i.
KFdes(mL/g) 0.943 1.027 1.073 1.103 1.302 1.297
S.E 0.141 0.142 0.146 0.135 0.137 0.143
nF 1.944 1.754 1.484 1.645 1.961 1.855
R2 0.925 0.908 0.910 0.912 0.895 0.878
L
a
ng
mui
r.
co
ff
i.
KL (ml/g) 0.009 0.010 0.010 0.010 0.003 0.013
S.E 0.138 0.137 0.135 0.144 0.143 0.136
Cm(μg/g) 500 500 500 500 500 500
545
Table 2-b. The characteristic parameters of linear, Freundlich and Langmuir models isotherm for Adsorption-desorption process of Zinc in the presence of SDS at cmc concentration, on the selected soil samples.
M o d el s Pa ra m e te
r Soils
S1 S2 S3 S4 S5 S6
(a d so r p ti o n ) lin ea . D ist r .
Kd (calc) 4.884 8.825 6.877 4.871 4.762 7.349
S.E 0.123 0.136 0.138 0.129 0.159 0.124
R2 0.735 0.759 0.785 0.769 0.763 0.895
Fr e u n d lic h c o ff i.
KF(mL/g) 1.689 1.838 1.839 1.377 1.492 1.689
S.E 0.142 0.136 0.149 0.143 0.142 0.153
nF 2.247 2.083 2.342 1.605 1.808 1.879
R2 0.776 0.980 0.858 0.818 0.751 0.943
L a n g m u ir . c o ff i.
KL (ml/g) 0.011 0.017 0.013 0.008 0.008 0.014
S.E 0.153 0.149 0.154 0.156 0.157 0.154
Cm(μg/g) 1000 1000 1000 1000 1000 1000
R2 0.740 0.932 0.779 0.754 0.944 0.862
(d e so r p tio n ) D e s.Dist r . c o ff i
Kd (calc) 9.995 9.276 10.52 8.826 6.342 9.117
S.E 0.164 0.142 0.143 0.153 0.143 0.132
R2 0.635 0.741 0.765 0.709 0.644 0.655
Fr e u n d lic h c o ff i.
KFdes(mL/g) 1.944 1.671 1.709 1.889 1.784 1.637
S.E 0.159 0.159 0.162 0.155 0.149 0.158
nF 2.653 2.008 1.946 2.681 2.625 1.869
R2 0.907 0.848 0.930 0.878 0.763 0.792
La n g m u ir . c o ff i.
KL (ml/g) 0.063 0.051 0.080 0.049 0.025 0.041
S.E 0.139 0.133 0.135 0.138 0.141 0.134
Cm(μg/g) 500 500 500 500 500 500
R2 0.961 0.916 0.876 0.920 0.827 0.892
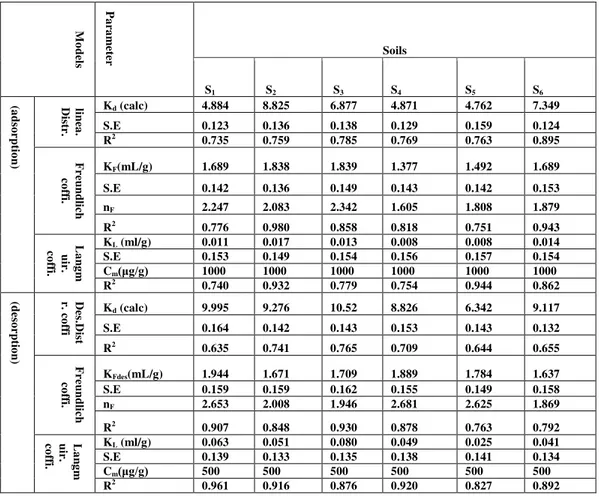
Table 3-a. The characteristic parameters of linear, Freundlich and Langmuir models isotherms for Adsorption-desorption process of Nicle on the selected soil samples.
M
od
e
ls er et m ra Pa Soils
S1 S2 S3 S4 S5 S6
(a d so r p ti o n ) lin ea r. D ist r .
Kd (calc) 8.904 10.37 11.09 8.386 8.398 9.216
S.E 0.133 0.146 0.161 0.133 0.129 0.131
R2 0.765 0.710 0.701 0.706 0.761 0.755
Fr e u n d lic h c o ff i.
KF(mL/g) 1.792 1.944 2.054 1.817 1.781 1.819
S.E 0.155 0.158 0.159 0.153 0.154 0.149
nF 1.968 2.247 2.597 2.070 1.980 2.000
R2 0.886 0.975 0.945 0.998 0.999 0.905
L a n g m u ir . c o ff i.
KL (ml/g) 0.057 0.023 0.024 0.017 0.017 0.020
S.E 0.149 0.147 0.147 0.245 0.149 0.148
Cm(μg/g) 1000 1000 1000 1000 1000 1000
R2 0.878 0.934 0.901 0.974 0.987 0.959
(d e so r p tio n ) D e s. D ist r. c o ff i
Kd (calc) 3.598 3.752 3.876 3.556 2.915 8.382
S.E 0.111 0.118 0.118 0.121 0.162 0.165
R2 0.685 0.647 0.688 0.674 0.692 0.627
Fr e u n d lic h c o ff i.
KFdes(mL/g) 1.176 1.141 1.190 1.391 0.897 1.906
S.E 0.139 0.143 0.145 0.150 0.138 0.154
nF 1.642 1.579 1.667 2.203 1.357 1.347
R2 0.955 0.932 0.908 0.964 0.962 0.857
La n g m u ir . c o ff i.
KL (ml/g) 0.013 0.013 0.018 0.010 0.008 0.038
S.E 0.139 0.138 0.137 0.140 0.141 0.136
Cm(μg/g) 500 500 500 500 500 500
546
Table 3-b. The characteristic parameters of linear, Freundlich and Langmuir models isotherm for Adsorption-desorption process of Nicle in the presence of SDS at cmc concentration, on the selected soil samples.
M
od
e
ls er et m ra Pa Soils
S1 S2 S3 S4 S5 S6
(a d so r p ti o n ) lin ea r. D ist r .
Kd (calc) 6.868 7.240 5.593 5.751 4.804 5.128
S.E 0.128 0.124 0.121 0.123 0.142 0.158
R2 0.734 0.752 0.799 0.772 0.870 0.684
Fr e u n d lic h c o ff i.
KF(mL/g) 1.725 1.708 1.603 1.642 1.422 1.516
S.E 0.152 0.151 0.145 0.146 0.149 0.157
nF 2.020 1.194 1.908 1.976 1.678 1.795
R2 0.901 0.839 0.797 0.781 0.941 0.866
L a n g m u ir . c o ff i.
KL (ml/g) 0.012 0.016 0.019 0.009 0.007 0.008
S.E 0.152 0.152 0.154 0.155 0.156 0.156
Cm(μg/g) 1000 1000 1000 1000 1000 1000
R2 0.873 0.939 0.855 0.907 0.724 0.725
(d e so r p tio n ) D e s. D ist r. c o ff i
Kd (calc) 7.466 14.44 14.77 13.78 11.28 11.97
S.E 0.132 0.110 0.166 0.112 0.171 0.161
R2 0.717 0.708 0.780 0.754 0.840 0.795
Fr e u n d lic h c o ff i.
KFdes(mL/g) 1.652 2.058 1.917 2.311 1.995 1.991
S.E 0.154 0.166 0.167 0.162 0.161 0.162
nF 2.074 3.300 2.217 5.780 2.881 2.762
R2 0.900 0.795 0.910 0.975 0.943 0.749
La n g m u ir . c o ff i.
KL (ml/g) 0.044 0.100 0.154 0.143 0.083 0.117
S.E 0.137 0.135 0.132 0.143 0.137 0.137
Cm(μg/g) 500 500 500 500 500 500
R2 0.969 0.954 0.855 0.996 0.991 0.958
Table 4-a. The characteristic parameters of linear, Freundlich and Langmuir models isotherms for Adsorption-desorption process of Copper on the selected soil samples.
M o d el s Pa ra m e te r Soils
S1 S2 S3 S4 S5 S6
(a d so r p ti o n ) lin ea r. D ist r .
Kd (calc) 9.325 9.428 8.521 8.578 5.293 7.818
S.E 0.139 0.143 0.125 0.137 0.133 0.129
R2 0.755 0.709 0.773 0.733 0.766 0.757
Fr e u n d lic h c o ff i.
KF(mL/g) 1.807 1.945 1.958 1.417 1.418 1.291
S.E 0.157 0.156 0.153 0.143 0.145 0.152
nF 2.000 2.347 2.545 1.494 1.618 2.053
R2 0.913 0.949 0.815 0.997 0.889 0.938
L a n g mu ir . c o ff i.
KL (ml/g) 0.018 0.021 0.015 0.008 0.009 0.015
S.E 0.147 0.149 0.151 0.157 0.156 0.151
Cm(μg/g) 1000 1000 1000 1000 1000 1000
R2 0.865 0.904 0.860 0.956 0.966 0.841
(d e so r p tio n ) D e s.Distr . c o ff i
Kd (calc) 2.107 2.183 4.168 2.978 2.645 4.377
S.E 0.154 0.159 0.119 0.164 0.157 0.149
R2 0.901 0.962 0.875 0.712 0.755 0.711
Fr e u n d lic h c o ff i.
KFdes(mL/g) 0.846 0.832 1.296 0.968 0.935 1.308
S.E 0.132 0.136 0.145 0.136 0.134 0.144
nF 1.459 1.433 0.772 1.401 1.431 1.727
R2 0.960 0.987 0.915 0.934 0.886 0.977
La n g mu ir . c o ff i.
KL (ml/g) 0.006 0.003 0.013 0.009 0.018 0.008
S.E 0.141 0.142 0.139 0.145 0.146 0.138
Cm(μg/g) 500 500 500 500 500 500
547
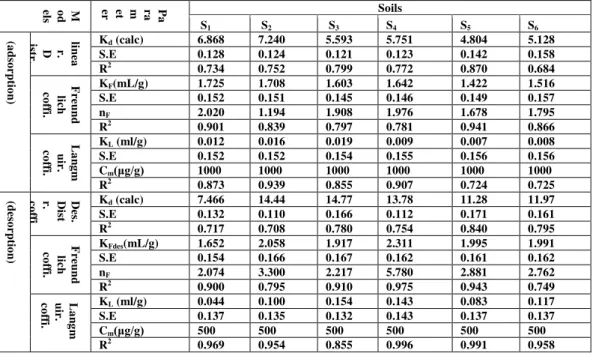
Table 4-b. The characteristic parameters of linear, Freundlich and Langmuir models isotherm for Adsorption-desorption process of Copper in the presence of SDS at cmc concentration, on the selected soil samples.
M
o
d
el
s
Pa
ra
m
e
te
r
Soils
S1 S2 S3 S4 S5 S6
(a
d
so
r
p
ti
o
n
)
lin
ea
r.
D
ist
r
.
Kd (calc) 6.385 6.529 4.684 2.630 3.322 5.128
S.E 0.138 0.135 0.123 0.163 0.188 0.116
R2 0.749 0.719 0.754 0.708 0.756 0.786
Fr
e
u
n
d
lic
h
c
o
ff
i.
KF(mL/g) 1.920 1.868 1.712 0.865 1.069 1.516
S.E 0.147 0.148 0.141 0.134 0.148 0.144
nF 2.778 2.532 2.364 1.279 1.418 1.795
R2 0.816 0.872 0.860 0.879 0.716 0.866
L
a
n
g
mu
ir
.
c
o
ff
i.
KL (ml/g) 0.011 0.012 0.008 0.004 0.005 0.009
S.E 0.156 0.156 0.159 0.162 0.161 0.153
Cm(μg/g) 1000 1000 1000 1000 1000 1000
R2 0.957 0.837 0.848 0.912 0.903 0.825
(d
e
so
r
p
tio
n
)
D
e
s.Distr
.
c
o
ff
i
Kd (calc) 7.942 11.18 17.89 13.45 12.57 13.90
S.E 0.126 0.153 0.186 0.112 0.109 0.190
R2 0.605 0.718 0.651 0.731 0.714 0.722
Fr
e
u
n
d
lic
h
c
o
ff
i.
KFdes(mL/g) 1.546 1.850 2.094 2.304 2.186 2.114
S.E 0.156 0.167 0.172 0.161 0.161 0.165
nF 1.751 2.369 2.710 5.587 4.048 3.424
R2 0.817 0.821 0.936 0.962 0.980 0.764
La
n
g
mu
ir
.
c
o
ff
i.
KL (ml/g) 0.041 0.053 0.100 0.111 0.111 0.222
S.E 0.138 0.137 0.134 0.142 0.139 0.137
Cm(μg/g) 500 500 500 500 500 500
548
Figure 2. Fitted adsorption isotherm Ferundlich model for a- Zinc b-Nicle c- Copper
on selected soils samples (♦ S1, ■ S2, ▲ S3, x S4, * S5, ●S6).
a-
b-
c-
2
2.2
2.4
2.6
2.8
3
1.1
1.4
1.7
2
2.3
log
Cs
log Ce
2.1
2.3
2.5
2.7
2.9
1.1
1.3
1.5
1.7
1.9
2.1
2.3
log
Cs
log Ce
2
2.2
2.4
2.6
2.8
3
1.1
1.3
1.5
1.7
1.9
2.1
2.3
log
Cs
549
Figure 3. Fitted adsorption isotherm Languir model for a- Zinc b-Nicle c- Copper
on selected soils samples (♦ S1, ■ S2, ▲ S3, x S4, * S5, ●S6).
a-
b-
c-
0 0.05 0.1 0.15 0.2 0.25
0 50 100 150
C
e/
C
s
Ce(mg/L)
0 0.05 0.1 0.15 0.2 0.25
0 50 100 150
C
e/
C
s
Ce(mg/L)
0 0.05 0.1 0.15 0.2 0.25 0.3
0 50 100 150 200
C
e/
C
s
550
Figure 4. Fitted adsorption isotherm Ferundlich
model for a- Zinc b-Nicle c- Copper in the presence of cmc SDS
on selected soils samples (♦ S1, ■ S2, ▲ S3, x S4, * S5, ●S6).
a-
b-
c-
2
2.2
2.4
2.6
2.8
3
1.2
1.5
1.8
2.1
log
Cs
log Ce
2.1
2.3
2.5
2.7
2.9
1.3
1.5
1.7
1.9
2.1
2.3
log
Cs
log Ce
2
2.2
2.4
2.6
2.8
3
1.3
1.5
1.7
1.9
2.1
2.3
log
Cs
551
Figure5. Fitted adsorption isotherm Langmiur model for a- Zinc b-Nicle c- Copper in the presence of cmc SDS
on selected soils samples (♦ S1, ■ S2, ▲ S3, x S4, * S5, ●S6).
5. OVERALL CONCLUSIONS
Surfactants work as a remediation tool by lowering the contaminant-water interfacial tension and thereby causing a degree of contaminant mobility, and enhanced contaminant solubility in water, so responsible for increasing the solubility. The potential of anionoic surfactant to desorb the studied heavy metals from the contaminated matrix was also investigated. Results showed that anionic surfactant significantly decreased the retention of heavy metals
6. ACKNOWLEDGEMENTS
The authors wish to thank all the chemistry staff in Salahaddin University. We express my gratitude to Assit proff Dr. Kasim.
a-
b-
c-
0 0.05 0.1 0.15 0.2 0.25 0.3 0.35 0.4
0 50 100 150 200
C
e/
C
s
Ce(mg/L)
0 0.05 0.1 0.15 0.2 0.25 0.3 0.35
0 50 100 150 200
C
e/
C
s
Ce(mg/L)
0 0.1 0.2 0.3 0.4 0.5 0.6
0 50 100 150 200
C
e/
C
s
552 7. REFERENCES
[1] Mulligan, C.N., Yong, R.N., and Gibbs, B.F., " Rremoval of heavy metals from soil and sediments using the biosurfactant surfactin". Journal of Soil Contamination. 8,231-254 (1999).
[2] Peters, R. W., and Shem, L., "Adsorption/desorption characteristics of lead on various types of soil"., Environ Prog, 11,234-240. (1992). [3] Ray. A. B., Ma, J.H., and Borst, M., "Adsorption of surfactants on clays". Hazardous wast and hazardous materials. 12, 357-364 (1995). [4] Peters, R. W., "Chelant extraction of heavy metals from contaminated soils". J. hazard. Materi., 66, 151-210 (1999).
[5] Rosen, M.J. "Surfactants and interfacial Phenomena, 2nd". Wiley – Intersciencs: NowYork (1989).
[6] Nivas B.T., Sabatini, D. A., Shiau, B. J., and Harwell, J. H."Surfactant enhanced remediation of subsurface chromium contamination". Wat. Res., 30,511-52 (1996).
[7] Werkheiser, W.O. and Anderson, S.J. "Effect of Soil Properties and Surfactant on Primisulfuron Sorption". Journal of Environmental Quality., 25, 809-814. (1996).
[8] Rounak M. Sh., Narmeen S. A., and Abdulla S. Y., "Adsorption –desorption study of surfactant on six agricultural soils",. International Jour. Chem.,21, 185-200 (2011).
[9] Rouse, J. D., D.A. Sabatini, and J. H. Harwell. "Minimizing Surfactant Losses using Twin-head Anionic Surfactant in Subsurface Remediation". Environ. Sci. Technol. 27, 2072-2078. (1993).
[10] DiCesare, D., and J. A. Simth. "Surfactant Effects on Desorption of Nonionic Compounds". Rev. Environ. Contam. Toxicol., 134, 1-29. (1994).
[11] R. P. Tiwari, P. Bala Ramudu, R. K. Srivastava, and M. K. Gupta, " Sorption and desorption studies of metallic zinc on an alluival soil", Iran. J. Environ. Health. Sci. Eng., 2007, 4(3):139-146.
[12] ImanY. El-Sherif, A. Ashmawy and S. Badr," Biosorption of Cadmium and Nickel by Nile Water Algae" Journal of Applied Sciences Research,. 4, 391-396 (2008).
[13] Beveridge, A., and Pickering, W. F., "The influence of surfactants on the adsorption of heavy metal ions by calys". Water Res., 17, 215-225. (1983).
[14] Dali N. youcef, Ouddane B., Z.Derriche., "Adsorption of zinc on natural sediment of Tafna River"., Journal of Hazardous Materials.,A137, 1263-1270 (2006).
[15] Anirudhan T.S, Radhakrishnan., "Thermodynamics and kinetics of Cu(II) from aqueous solutions on to a new cation exchanger derived from tamarind fruit shell"., J.Chem. Thermodynamics., 40, 702-709 (2008).
[16] Gomez del Rio J.A., Marando P.J., Cicerone D.S., "Natural materials for treatment of industrial effluents:comparative study of the retention of Cd,Zn, and Co by calcite and hydroxyapatite., Journal of Environmental management .,71, 169-177. (2004).
[17] Wahba M.M and Zaghloul "Adsorption Characteristics of Some Heavy Metals by Some Soil Minerals"., Journal of Applied Scieneces Research., 3, 421-426 (2007).
[18] Jain C.K., Singhal D.C., Sharma M.K." Adsorption of Zinc on bed sediment of River Hindo adsorption models and kinetics" .J. Hazard. Mater., B114, 231-239. (2004).
[19] Ho Y.S, Ofomaja A.E.," Kinetics and thermodynamics of lead ion sorption on palm kernel fibre from aqueous solution"., Process Biochem., 40, 3455-3461(2005).
[20] Xiaowu Tang, Zhenze Li, Yunmin Chen., "Adsorption behavior of Zn(II) on calcinated Chinese loess"., Journal of Hazardous Materials.,161, 824-834 (2009).
[21] Zachara J.M., Smith S.C.,Liu C., Muckinely J.P., Serne R.J., and Gassman P.L., "Sorption of Cs+2 to Micaceous Subsurface Sediments from the Hanford Site".,Geochim.Cosmochin.,66,193-211 (2002).
[22] Noeline B.F., Manohar D.M., Anirudhan T.S., "Kinetic and equilibrium modeling of lead(II) sorption from water and wastewater by polymerized banana stem in a batch reactor"., Separation and purification Technology. , 45, 131-140 (2005).
[23] Giles CH, McEwane TH, Nakhwa SN and Smith D, Studies in adsorption . Part lll. A system of Classification of solution adsorption isotherms. J .Chem . Soc., 3973-3993 (1960).
[24] Guo X.Y., Zhang S.Z., Shang X.Q., "Adsorption of metal ions on lignin".,J. Hazard. Mater.,151,134-142(2008).
[25] Unuabonah E.I., Adebowale K.O. , B.I.Olu-Owolabi., "Kinetic and Thermodynamic studies of the adsorption of lead(II) ions on to phosphate modified kaolinite clay"., Journal of Hazardous materials., 144, 386-395 (2007).
[26] Thanh H. Dao "Competitive Anion Sorption Effects on Dairy West Water Dissolved phosphorus Extraction with Zeolite-based Sorbents". Food, Agriculture & Environment., 3&4, 263-269 (2003).
[27] Fernandez Covel E., Andrade Couce M.L., Marcent Miramontes P., "Selectivity Sequence and Competitive Adsorptions of Cd, Cr, Cu, Ni, Pb and Zn by Humic Umbrisols, presented at the 7th International Conference on Biogeochemistry of Trace Elements, Uppsala, (2003). [28] Marius A.van der Gun and Hein WJR Neomagus.,"Thermodynamic and kinetic studies of copper(II) adsorption on cross linked chitosan
beads"., (2000).
[29] Gueu S., Yao B., Adouby K., Ado G., "Kinetic and thermodynamics study of lead adsorption on to activated carbons from coconut and seed hull of the palm tree"., Int.J.Environ.Sci.Tech., 4, 11-17(2007).
[30] Martina Havelcova, Jiri Mizera, Ivana Sykorova, Miloslav pekar.,"Sorption of ions on lignite and the derived humic substances"., Journal of Hazardous Materials.,161,559-564 (2005).
[31] Maather F. Sawalha, Jose R.Peralta-Videa, Blanca Sanchez-Salcido, Jorge L.Gardea-Torresdey.,"Sorption of hazardous metals from single and multi element solutions by saltbush biomass in batch and continuous mode:Interference of calcium and magnesium in batch mode"., 90,1213-1218 (2009).
[32] Y.Liu, M.C.Lam and H.H.P.Fang.,"Adsorption of heavy metals by EPS of activated sludge"., Water Science and Technology.,43,59-66 (2001).
[33] S. A. Wasay, W. Parker, P. J. Van Geel, S. Barrington and S. Tokunaga., "Arsenic Pollution of a Loam soil: Retention from and Decontamination". Journal of Soil Contamination., 9,51-64. (2000).
[34] J. Park, S.D. Comfort, P. J. Shea, and T. A. Machacek. "Remediating Munitions-Contaminated Soil with Zerovalent Iron and Cationic Surfactants". J. Environ. Qual., 33, 1305-1313(2004).