Short Report
Printed in Brazil - ©2015 Sociedade Brasileira de Química0103 - 5053 $6.00+0.00S
*e-mail: [email protected]
Selective Oxidation of Amorphous Carbon by CO
2to Produce Fe@C Nanoparticles
from Bulky Fe/C Matrices
Fernanda G. Mendonça,a José D. Ardisson,b Rochel M. Lagoa and Juliana C. Tristão*,c
aDepartamento de Química, ICEx, Universidade Federal de Minas Gerais,
31270-901 Belo Horizonte-MG, Brazil
bLaboratório de Física Aplicada, Centro de Desenvolvimento de Tecnologia Nuclear,
30123-970 Belo Horizonte-MG, Brazil
cUniversidade Federal de Viçosa, Campus Florestal, Rodovia LMG, 818-km 6,
35690-000 Florestal-MG, Brazil
In this work, a bulky Fe0/carbon matrix obtained by a low cost and simple reduction/
carbonization of Fe3+ salt with sucrose was treated with CO
2 to selectively oxidize the amorphous
carbon to release the graphite like carbon coated magnetic Fe0 particles. Scanning electron
microscopy (SEM), transmission electron microscopy (TEM), Raman, X-ray diffraction (XRD), BET, thermogravimetric analysis (TG) (in CO2) and particle size analyses showed that the treatment
with CO2 of the Fe/carbon bulky composite led to the selective oxidation of the more amorphous
carbon with the formation of 125-132 nm Fe@C nanoparticles with surface areas of 217 m2 g−1.
Keywords: Fe@C nanoparticles, activated carbon, CO2 oxidation
Introduction
Magnetic nanoparticles have been extensively investigated in the last years for different applications such as
catalyst support,1-3 emulsion formation,4 catalysts in biodiesel
production,5,6 photocatalysts7,8 and waste water treatment.9
Magnetic particles can be composed of a magnetic nuclei coated with a protective layer of different materials to improve their stability and to introduce new surface properties
and functionalities.10 One of the most promising coatings
is carbon due to its chemical stability, biocompatibility, possibility of surface modification and pore creation. Carbon coated magnetic nanoparticles can be produced by different
methods such as arc discharge plasma,11-13 pyrolysis of
metallic complexes,14 explosive reactions,15 and continuous
methods such as flame spray synthesis16 and thermal plasma
jet.17 All the processes described above are relatively complex,
expensive and demand special precursors. Different carbon coated magnetic nanoparticles have been also produced by
chemical vapor deposition (CVD).3,11,18 However, in general,
these CVD procedures demand complex preparation of
special nanostructured precursors.19
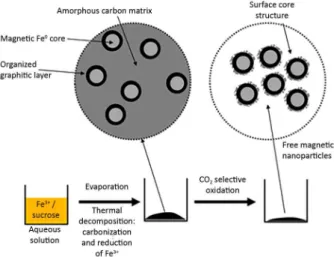
In this work, a versatile process to produce carbon coated magnetic nanoparticles based on the use of sucrose,
iron salt and CO2 is described. In this process, an aqueous
solution of Fe3+ with sucrose is dried (equation 1) and
thermally decomposed to form a solid amorphous carbon matrix containing Fe nuclei coated with a more organized graphitic carbon layer (equation 2). Sucrose can disperse
Fe3+ very well and, by a simple thermal treatment,
decomposes to form a carbon matrix which will reduce iron
to form magnetic composite based on Fe0, as described in
previous work.20 The Fe nanoparticles are coated with a
more organized graphitic carbon layer whereas the rest of
the matrix is composed mainly of amorphous carbon.21 The
isolation of these carbon coated Fe nanoparticles from the matrix was carried out by a simple selective oxidation of the
amorphous carbon with CO2 (equation 3). Figure 1 shows
schematically this process. Carbon dioxide is a well-known selective oxidant of more defective carbon and it has been
used to open carbon nanotubes22 and to physically activate
different types of coals.23-25
Fe3+
aq + sucroseaq→ Fe3+/sucrosesolid (1)
Fe3+/sucrose
solid→ (Fe@C)/Cmatrix (2)
Experimental
Materials preparation
The magnetic material was obtained from a mixture of
sucrose containing 8 wt.% of dispersed Fe3+ named as 8Fe.
Initially, a Fe(NO3)3.9H2O solution containing 8 wt.% in
iron was prepared at pH ca. 1. In a second step, the solution was heated and commercial sucrose was added slowly. The solution was evaporated to form a dark paste. This
mixture was treated at 400, 600 and 800 °C under N2 flow
in a horizontal furnace (BLUE M. Lindberg) for 1 h. After this thermal treatment, the solid was extensively washed with water to eliminate organic contaminants and soluble Fe species. The preparation of these base bulky materials
has been previously described.20 The material containing
8 wt.% of iron and treated at 800 °C, named 8Fe800, was
selectively oxidized in CO2 atmosphere.
The selective oxidation with CO2 was performed in a
horizontal furnace (BLUE M.Lindberg) under a CO2 flow of
50 mL min−1 and 250 mg of material heated at 10 °C min−1
up to 700 °C. The temperature was maintained at 700 °C to produce different burn-offs (carbon oxidation) of ca. 20, 40 and 50 wt.%.
Materials characterization
Transmission electron microscopy (TEM) analysis was done using a Tecnai G2-20 FEI equipment. TG analyses were carried out in a Shimadzu TGA-60, with
a constant heating rate of 10 °C min−1 under a dynamic
CO2 flow (50 mL min−1). Scanning electron microscopy
(SEM) analysis was done using Quanta 200 ESEM FEG equipment. Raman spectra were obtained in a Senterra
Bruker equipment, with excitation wavelength of 633 nm, a laser spot size of 20 µm with confocal imaging microscope, power of 2 mW and 30 scans with 2 seconds each at 10 different spots. The profile of light retention was recorded in a Shimadzu UV 2550 equipment, interfaced with a computer. The particle size tests were performed in a Zetasizer equipment using acetone as a dispersant in a glass container in 4 replicates for estimate the average size. The surface area was determined by nitrogen adsorption
using the BET method with a 22 cycles of N2 adsorption/
desorption in an Autosorb 1 Quantachrome instrument. Magnetization measurements were carried out in a portable magnetometer with a fixed magnetic field of 0.3 T. Hysteresis loops were obtained at room temperature in a vibrating sample magnetometer (VSM) LakeShore 7404V.
Results and Discussion
The preparation of the Fe/C bulky composite from a Fe3+
salt and sucrose by a simple process has been described in
a previous work.20 Detailed analyses of one of the obtained
composites (8Fe800: 8wt.% Fe treated at 800 °C) by TEM (Figure 2) showed the presence of a matrix composed of a more amorphous carbon with Fe particles (based on
ca. 25% Fe0 and ca. 54% Fe
3C).20 The formation of a layer
of more organized graphitic carbon coating is likely induced by the Fe surface or due to the heating on the particle surface during the reduction of the oxide. In order to produce free and isolated carbon coated Fe magnetic particles it is necessary to eliminate the amorphous carbon matrix.
As the amorphous carbon is much more reactive
compared to more organized graphitic carbon,26 it was
investigated its selective oxidation using CO2 (equation 4):
Camorphous + CO2→ 2 CO (4)
In order to determine the temperature for selective
oxidation, TG analysis in CO2 has been carried out
(Figure 3).
The TG curve for the sample 8Fe800 showed a continuous oxidation starting at 650 °C with three different processes as observed by derivative thermogravimetric analysis (DTG), Figure 1. Schematic preparation of the Fe/carbon bulky composite
followed by selective oxidation with CO2 to produce the free Fe/C
nanoparticles.
i.e., two processes in the range 650-750 °C likely due to the
oxidation of amorphous carbon and 750-900°C due to the
oxidation of more organized carbon. Based on these results,
the composite 8Fe800 was treated with CO2 at 700 °C for
different times in order to remove the amorphous carbon and
release the magnetic particles. The CO2 reaction at 700 °C
for 90, 150 and 200 min produced B.O. (burn-off, amount of carbon oxidized) of ca. 20, 40 and 50 wt.%.
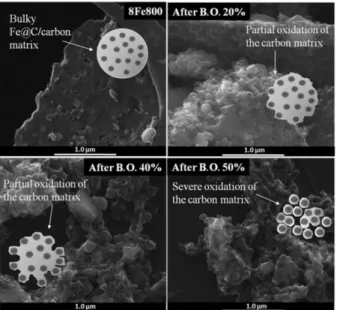
SEM images (Figure 4) showed that the bulky particles are gradually oxidized converting bulky flat surface particles into agglomerates of well defined small particles after oxidation.
Raman spectra of the samples 8Fe800 after selective
oxidation with CO2 are shown in Figure 5. Raman spectrum
of the sample 8Fe800 before oxidation is shown in the Supplementary Information (SI) section for comparison.
It can be observed that the IG/ID of 0.66 after 20%
B.O. increased after B.O. 40 and 50%, likely related to the consumption of the more amorphous defective carbon.
In order to separate different size fractions, the obtained particles of the sample 8Fe800 after 50% burn-off was dispersed in water. Figure 6 shows the suspension behavior by simple light scattering measurements at three different
wavelengths (450, 600 and 750 cm−1). It can be observed
that immediately after dispersion, the light scattering is defined 100% due to the particles in suspension.
After 30 min, the larger particles settled down, which can be clearly visualized. Separation, drying and weighting of the particles collected from the bottom of the UV-Vis cell suggested that approximately 20-30 wt.% of the particles settled in this initial period. The rest of the particles remained suspended in water with relative stability. Particle size estimation in a Zetasizer equipment suggested that after 15 min, the material obtained with burn-offs of 20,
0 10 20 30 40 50 60 70 80 90 100 110
0 100 200 300 400 500 600 700 800 900 -0.0025 -0.0020 -0.0015 -0.0010 -0.0005 0.0000
0 200 400 600 800 -100 -80 -60 -40 -20 0 20 40 DT
A / µV
Temperature / °C
M a s s / %
Temperature / °C Oxidation of more reactive
amorphous carbon
Oxidation of more organized and less reactive carbon
D
T
G
Figure 3. TG and DTG curves (in CO2) for the sample 8Fe800 (detail:
DTA curve).
0 10 20 30 40 50 60
0 20 40 60 80 100
Light retention /
%
time / min Magnetic separation
Magnet B.O. 50 wt.% Settled sample
Figure 6. Profile of light retention curve to the sample 8Fe800 in water after selective oxidation with CO2 (B.O. 50 wt.%).
500 1000 1500 2000 2500 3000
IG/ID= 0.66 IG/ID= 0.76
R a m a n in te n s it y / u .a .
Wavenumber / cm-1
After B.O. 50%
After B.O. 40%
After B.O. 20% D band
(Amorphous carbon)
G band (Graphitic carbon)
IG/ID= 0.88
Figure 5. Raman spectra of the sample 8Fe800 after selective oxidation with CO2 of 20, 40 and 50 wt.%.
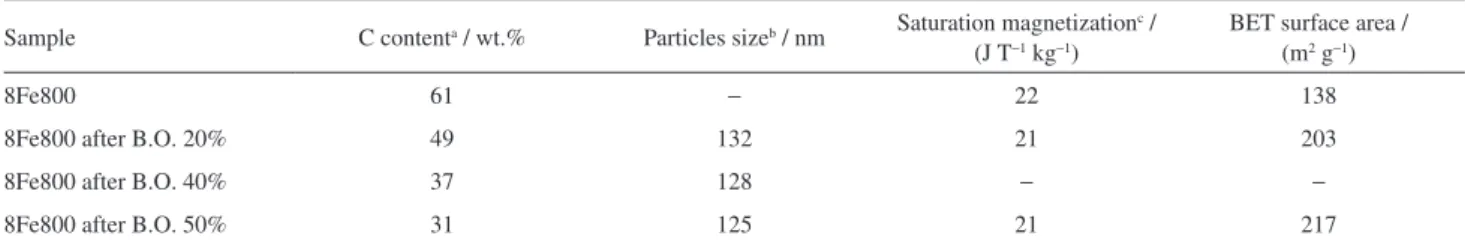
40 and 50% showed average particle sizes of 132, 128 and 125 nm, respectively (Table 1). If a magnet was placed near to the test tube with the suspension, all the particles were attracted and removed from the aqueous media showing that all the particles are magnetic.
BET N2 adsorption measurements showed that the
composite precursor 8Fe800 (before CO2 treatment)
showed surface area of 138 m2 g−1. On the other hand, the
treatment of the 8Fe800 with CO2 produced an increase of
the surface area to 217 m2 g−1 after selective oxidation of
50 wt.% with CO2.
The suspended particles of the material 8Fe800 after 50% burn-off were analyzed by TEM (Figure 7). It can be observed the presence of isolated nanoparticles with sizes smaller than 50 nm. These nanoparticles are encapsulated by a carbon layer, which suggests that selective oxidation leads to removal of a more reactive carbon (amorphous carbon), remaining a more organized carbon as graphite, which encapsulates the nanoparticles forming a protective layer.
Conclusions
A Fe/C bulky composite produced from Fe3+ and
sucrose by a simple process can be treated with CO2 at
700 °C for the selective oxidation of the more amorphous carbon to produce carbon coated magnetic Fe nanoparticles. The obtained material shows increased surface area
(217 m2 g−1) and is composed of particles with average
size of ca. 130 nm formed by a Fe metal core coated with a more organized graphitic like carbon. This synthetic route
is relatively simple and produces air/water stable versatile materials opening new and exciting application in catalysis and adsorption science. Preliminary results showed that Pd supported in these 8Fe800 materials produced excellent hydrogenation catalysts which can be easily recovered and reused for at least five times.
Supplementary Information
Supplementary information (Figures S1 and S2) is available free of charge at http://jbcs.org.br as PDF file.
Acknowledgements
The authors thank the financial support of PRPq/ UFMG, FAPEMIG, CNPq, Fundep, Petrobras and to UFMG Microscopy Center (http://www.microscopia.ufmg. br) for providing the equipment and technical support for experiments involving electronic microscopy.
References
1. Elazab, H. A.; Siamaki, A. R.; Moussa, S.; Gupton, B. F.; El-Shall, M. S.; Appl. Catal., A 2015,491, 58.
2. Dutta, B.; Omar, S.; Natour, S.; Abu-Reziq, R.; Catal. Commun.
2015,61, 31.
3. Tristão, J. C.; Oliveira, A. A. S.; Ardisson, J. D.; Dias, A.; Lago, R. M.; Mater. Res. Bull. 2011,46, 748.
4. Oliveira, A. A. S.; Teixeira, I. F.; Ribeiro, L. P.; Tristão, J. C.; Dias, A.; Lago, R. M.; J. Braz. Chem. Soc. 2010,21, 2184. 5. Alves, M. B.; Medeiros, F. C. M.; Sousa, M. H.; Rubim, J. C.;
Suarez, P. A. Z.; J. Braz. Chem. Soc. 2014,25, 2304. 6. Ngo, T. P. N.; Li, A.; Tiew, K. W.; Li, Z.; Bioresour. Technol.
2013,145, 233.
7. Rashid, J.; Barakat, M. A.; Ruzmanova, Y.; Chianese, A.;
Environ. Sci. Pollut. Res. 2015, 22, 3149.
8. Shan, G.; Fu, Y.; Chu, X.; Chang, C.; Zhu, L.; J. Colloid. Interf. Sci. 2015,444, 123.
9. Teixeira, A. P. C.; Tristão, J. C.; Araujo, M. H.; Oliveira, L. C. A.; Moura, F. C. C.; Ardisson, J. D.; Amorim, C. C.; Lago, R. M.; J. Braz. Chem. Soc. 2012,23, 1579.
Figure 7. TEM images of the sample 8Fe800 after 50% burn-off.
Table 1. Carbon content, particles size, saturation magnetization and surface area of the samples
Sample C contenta / wt.% Particles sizeb / nm Saturation magnetization c /
(J T−1 kg−1)
BET surface area / (m2 g−1)
8Fe800 61 − 22 138
8Fe800 after B.O. 20% 49 132 21 203
8Fe800 after B.O. 40% 37 128 − −
8Fe800 after B.O. 50% 31 125 21 217
10. Rossi, L. M.; Garcia, M. A. S.; Vono, L. L. R.; J. Braz. Chem. Soc. 2012,23, 1959.
11. Aguiló-Aguayo, N.; Liu, Z.; Bertran, E.; Yang, J.; J. Phys. Chem. C 2013,117, 19167.
12. Zhang, F.; Cui, L.; Lin, K.; Jin, F.; Wang, B.; Shi, S.; Yang, D.; Wang, H.; He, F.; Chen, X.; Cui, S.; J. Alloys Compd. 2013,
553, 367.
13. Kim, S.; Sergiienko, R.; Shibata, E.; Nakamura, T.; Mater. Chem. Phys. 2010, 122, 164.
14. Panchakarla, L. S.; Govindaraj, A.; Bull. Mater. Sci. 2007, 30, 23.
15. Luo, N.; Liu, K.; Liu, Z.; Li, X.; Chen, S.; Shen, Y.; Chen, T.;
Nanotechnology 2012, 23, 475603.
16. Athanassiou, E. K.; Grass, R. N.; Stark, W. J.; Nanotechnology
2006, 17, 1668.
17. Bystrzejewski, M.; Károly, Z.; Szépvölgyi, J.; Huczko, A.; Lange, H.; Mater. Res. Bull. 2011, 46, 2408.
18. Oliveira, A. A. S.; Tristão, J. C.; Ardisson, J. D.; Dias, A.; Lago, R. M.; Appl. Catal., B 2011, 105, 163.
19. Zhang, Z.; Duan, H.; Li, S.; Lin, Y.; Langmuir 2010, 26, 6676. 20. Tristão, J. C.; Mendonça, F. G.; Lago, R. M.; Ardisson, J. D.;
Environ. Sci. Pollut. Res. 2015, 22, 856.
21. Schliehe, C.; Yuan, J.; Glatzel, S.; Siemensmeyer, K.; Kiefer, K.; Giordano, C.; Chem. Mater. 2012,24, 2716.
22. Tsang, S. C.; Harris, P. J. F.; Green, M. L. H.; Nature 1993,
362, 520.
23. Wang, G.; Zhang, J.; Hou, X.; Shao, J.; Geng, W.; Bioresour. Technol. 2015, 177, 66.
24. Burhenne, L.; Aicher, T.; Fuel Process. Technol. 2014, 127, 140.
25. Li, Q.; Wang, Y.; Yu, J.; Yi, B.; Yang, J.; Xu, G.; Carbon 2013,
55, 376.
26. Jimenez, V.; Sanchez, P.; Valverde, J. L.; Romero, A.; Mater. Chem. Phys. 2010, 124, 223.
Submitted: May 12, 2015