© 2014 Sociedade Brasileira de Hemodinâmica e Cardiologia Intervencionista. Published by Elsevier Editora Ltda. All rights reserved.
Optical Coherence Tomography in the Management
of Intermediate Lesion in a Patient
with Acute Coronary Syndrome
Evandro Martins Filho, Daniel Chamié, Áurea J. Chaves, Alexandre Abizaid
ABSTRACT
Optical coherence tomography provides high-resolution to-mography imaging of the coronary microstructure, allowing for detailed characterization of atherosclerotic plaque components and morphology, in addition to an accurate determination of vascular dimensions. We report the case of a patient with an intermediate coronary lesion, presenting in the subacute phase of a myocardial infarction, in whom optical coherence tomography was used as an adjunctive diagnostic method to aid in the decision-making process and to guide the inter-ventional procedure.
DESCRIPTORS: Arteriosclerosis. Myocardial infarction. Coro-nary stenosis. Tomography, optical coherence. Percutaneous coronary intervention. Stents.
Instituto Dante Pazzanese de Cardiologia, São Paulo, SP, Brazil. Correspondence to: Daniel Chamié. Avenida Dr. Dante Pazzanese, 500 – Vila Mariana – CEP: 04012-180 – São Paulo, SP, Brazil Email: [email protected]
Received: 03/06/2014 • Accepted: 05/22/2014
RESUMO
Utilização da Tomografia de Coerência Ótica na Abordagem de Lesão Intermediária em Paciente
com Síndrome Coronariana Aguda
A tomograia de coerência ótica fornece imagens tomográicas da microestrutura coronária em alta resolução, possibilitando detalhada caracterização dos componentes e da morfologia da placa aterosclerótica, além de acurada determinação das dimensões vasculares. Relatamos aqui o caso de um paciente com lesão intermediária, na fase subaguda de um infarto do miocárdio, no qual a tomograia de coerência ótica foi utili-zada como método diagnóstico complementar para a tomada de decisão e para guiar o procedimento.
DESCRITORES: Arteriosclerose. Infarto do miocárdio. Estenose coronária. Tomograia de coerência óptica. Intervenção coro-nária percutânea. Stents.
Case Report
T
he inding of intermediate stenosis on coronary angiography in patients with ST-segment elevation acute myocardial infarction (STEMI) who underwent thrombolytic therapy is not a rare event. In this situa-tion, the decision about the need for coronary artery bypass graft (CABG) may pose a challenge. Studies of angiography, by being lumino grams, do not allow for the assessment of the components and of the mor pho l -ogy of the underlying plate. Furthermore, the invasive physiological assessment has limited role in the irst day’s post-infarct, not allowing for an accurate deter-mination of the functional signiicance of the stenosis.The present article reports a case where optical coherence tomography (OCT) was used to aid in the
diagnostic workup of a patient with moderate stenosis, identiied on the third day of his post-infarction evolution, and submitted to thrombolytic therapy with reperfusion criteria. This method allowed for the identiication of the components and morphology of the atherosclerotic plaque, as well as offered an accurate determination of stenosis severity, aiding in our decision-making process. In addition, OCT was used to guide and optimize a percutaneous coronary intervention.
CASE REPORT
Martins Filho et al. OCT in the Management of Intermediate Lesion in ACS Rev Bras Cardiol Invasiva.
2014;22(2):188-93
189
St. Jude Medical, St. Paul, United States). After adminis-tration of intracoronary nitroglycerin (200 mg), a guide wire with 0.014” diameter was advanced, crossing the stenosis and positioned in the distal bed of the right coronary artery. Then, the imaging catheter DragonFly
(St. Jude Medical, St. Paul, USA), duly calibrated with adjustment of Z-offset parameters, was positioned distal to the stenosis. An intracoronary injection of ioxaglate (Hexabrix; Guerbet, Gorinchem, The Netherlands),
using an infusion pump programmed to inject 3 mL/s for 3 seconds, was performed through the guide cath-eter, temporarily removing the intracoronary blood to acquire the images with automatic traction of the imaging catheter at a speed of 20 mm/s.
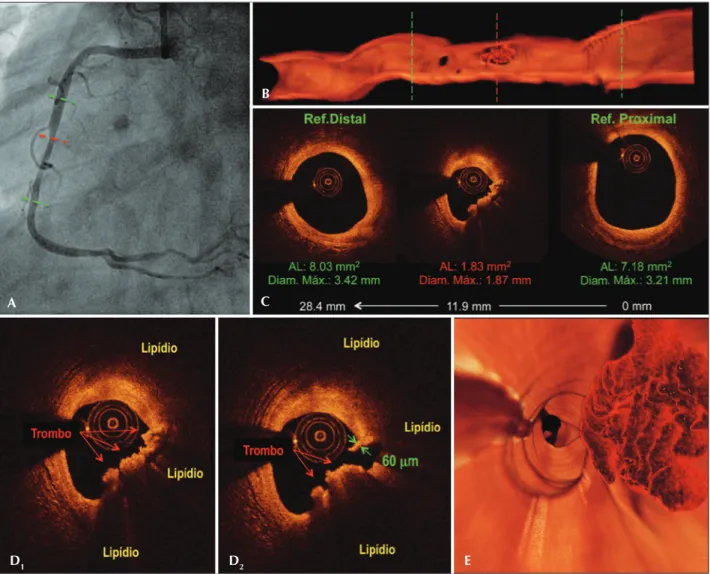
The OCT imaging evaluation revealed an extensive lesion (28.4 mm), with minimal luminal area of 1.83 mm2,
generating a stenosis area rate of 76%, compared to the average of luminal areas from normal, distal, and proximal references to the stenosis (Figure 3). From a qualitative point of view, OCT revealed a lipid-rich plaque, with indings compatible with intense macro-phage iniltration, ibrous cap rupture, and presence of a predominantly intraluminal red thrombus. At the site of rupture, the ibrous cap measured 60 µm. The started at rest. The initial electrocardiogram showed
an ST-segment elevation of 3 mm in the leads applied on the inferior wall. A pharmacological reperfusion strategy by intravenous administration of streptokinase (1,500,000 IU) was adopted, with a door-to-needle time of 20 minutes. The patient experienced improvement of symptoms and complete resolution of ST-segment eleva-tion. Then, the patient was referred to our institution to this institution for invasive stratiication on the third day post-infarction. The patient was asymptomatic since the administration of the thrombolytic agent.
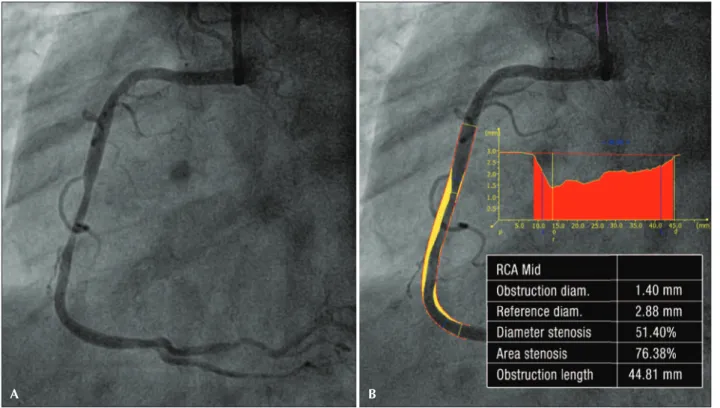
A coronary angiography was performed by the right radial route, with a6F arterial sheath. The left coronary showed slight parietal irregularities, without signiicant obstruction. The right coronary artery was dominant and showed moderate (50%) and segmental stenosis in its middle third, with preserved distal low (Thrombolysis in Myocardial Infarction [TIMI] 3). The contractile func-tion of the left ventricle was preserved (Figure 1). When an intermediate lesion in the culprit vessel, shown in two projections (Figure 2), was observed, the authors chose to perform an OCT to complement the diagnosis.
The OCT images were acquired with the com-mercially available Frequency Domain system (C7XR
;
Figure 1 – Coronary angiography. The left coronary artery showed slight parietal irregularities without signiicant obstruction (A, B, and C). The right coronary artery showed moderate segmental injury in its middle third, with preservation of distal low (D). The contractile function of the left ventricle was preserved. Left ventriculography in diastole (E); left ventriculography in systole (F).
A
D
B
E
C
combination of high lipid load with a ibrous cap thick-ness < 65 µm, and the intense macrophage iniltration characterized this plate as a thin-cap ibroatheroma.
Taking into account the above morphological indings, coupled with the severity of the stenosis, the authors chose to perform an ad hoc percutaneous coronary interven-tion. Then, the luminal measurements derived from OCT were used in the selection of the appropriate dimensions of the stent to be implanted. As shown in Figure 3, the length of the stenotic segment measured 28.4 mm of length, and the average from maximum lumen diam-eters obtained from distal and proximal references was 3.31 mm. With that in mind, it was decided to implant a zotarolimus-eluting stent with 3.0 × 30 mm, which was released with 14 atm of pressure and post-dilated with a noncompliant balloon measuring 3.5 × 15 mm, up to 16 atm in its proximal section.
The procedure was uneventful. Figure 4 presents the results according to the angiography and control OCT. The stent had a good expansion along its entire path, without areas of poor apposition of its stems and, additionally, with absence of dissection at the edges. The stent minimum area was 5.57 mm2 – only 1.4% larger than the average
reference lumen area (5.49 mm2), and 8.5% larger than
the distal reference lumen area (5.13 mm2). Next to its
proximal edge, the stent area (6.30 mm2) was only 7.5%
larger than the luminal area of the proximal reference
(5.86 mm2). These numbers indicate a proper sizing of
the stent in comparison to the dimensions of the target vessel. The patient was discharged on the day following the procedure, after an uneventful hospitalization.
DISCUSSION
The pathophysiology of acute coronary syndrome (ACS) is, in most cases, associated with the rupture of an atherosclerotic plaque, with intraluminal thrombus formation and occlusion of the coronary vessel (60 to 75%). Plaque erosion (25 to 30%) and calciied nodules (2 to 7%) are less common causes.1 Moreover, most
acute coronary occlusions occur in not hemodynami-cally signiicant plaques, or even in angiographihemodynami-cally normal regions.2,3 Although the tripod of good clinical
history, detailed analysis of the electrocardiogram, and coronary arteriography of good quality allows for the identiication of culprit lesions in most cases, in a non-negligible proportion of patients the identiication of the lesion responsible for the acute event can be quite challenging.4 It is noteworthy that coronary
angi-ography represents only a luminogram of the coronary circulation and, therefore, has obvious limitations in the identiication and characterization of the atherosclerotic process that affects the intimacy of the arterial wall. In this context, a diagnostic complementation with invasive adjunct methods can be of great value.
Figure 2 – Quantitative coronary angiography (A and B). Quantitative coronary angiography of the lesion in the middle third of the right coronary artery, conirming the presence of a moderate stenosis. The minimal luminal diameter was 1.40 mm and the diameter stenosis rate was 51.4%.
Martins Filho et al. OCT in the Management of Intermediate Lesion in ACS Rev Bras Cardiol Invasiva.
2014;22(2):188-93
191
In this case, the identiication of the culprit lesion was not a challenge – a single coronary stenosis located in the epicardial vessel, consistent with the topography of the infarct. However, there is no consensus about the subsequent management of this patient, who was asymptomatic in the subacute phase of a myocardial infarction, after a successful thrombolytic therapy, and in the presence of an intermediate coronary stenosis.
The fractional low reserve (FFR), which is considered as the method of choice to determine the functional signiicance of moderate stenoses in patients with stable coronary disease,5,6 has a limited role in a patient with
ACS. Described by Pijls et al.,7 FFR is deined as the
maximum coronary low achieved through a stenosis, compared to the maximum low that would be achieved in a hypothetical situation in the absence of stenosis and under maximal hyperemia. The basic premise on which FFR is based, that is, under maximal hyperemia, microvascular resistance is minimal and constant, does not apply in the acute phase of a STEMI, when varying degrees of transient microvascular dysfunction may exist, and the maximum hyperemic low may be underestimated in this phase. Thus, it is recommended that FFR should only be used for the investigation of
Figure 3 – Pre-procedure. Angiography of the right coronary artery (A). Longitudinal section of three-dimensional reconstruction of images obtained with optical coherence tomography. The green lines identify the proximal and distal references to the stenosis, and the red line, the minimum lu-minal area (B). Tomographic images of the cross section of the vessel. The minimum lumen area measured 1.83 mm2, with a stenosis area of 76%.
The segment length was 28.4 mm (C). Tomographic images of the cross section of the vessel at the minimum lumen area (D1 and D2). Note the presence of a large lipid plate (area with low intensity of the light signal, with poorly deined edges), rupture of the ibrous cap (D2), and a large residual thrombus load, predominantly composed of erythrocytes (red thrombus; irregular mass adhered to the vessel wall, which causes severe attenuation of the light signal, with posterior shadowing). It is also noted that in the rupture site (D2), the thickness of the remaining ibrous layer measured 60 µm. Fly-through view of the three-dimensional reconstruction, showing great thrombotic load, with an eccentric distribution, adhered to the vessel wall at the site of minimum lumen area (E).
A
D1 D2 E
B
stenoses in the culprit vessel due to an STEMI, when at least ive days have passed from the acute event,8,9
which did not apply to the present case.
Thus, it was chosen to perform an OCT, which, by means of high axial resolution images (15-20 µm),
allows for an accurate characterization of the different components of the atherosclerotic plaque, as well as different morphometric aspects. It is emphasized that OCT has high sensitivity (94%) and speciicity (92%) for detection of lipid plaques,10 and it is the only
imaging modality in vivo able to quantify accurately Figure 4 – Postprocedure. The top panel shows the right coronary angiography after implantation of a zotarolimus-eluting stent measuring 3.0 × 30 mm, with post-dilatation with a noncompliant balloon measuring 3.5 × 15 mm. The central panel shows a longitudinal image obtained from optical coherence tomography, while the bottom panel displays images of the cross section of the vessel. The green lines identify the proximal and distal references of the target vessel. The red line indicates the smaller area of the stent after the procedure, while the white lines show random regions of the stent in the distal, middle and proximal segments. Note the uniform expansion of the stent, the absence of poor apposition of its stems and of dissection of its edges. The smallest area of the stent measured 5.57 mm2, located near its distal edge – only 1.4% larger than the average
Martins Filho et al. OCT in the Management of Intermediate Lesion in ACS Rev Bras Cardiol Invasiva.
2014;22(2):188-93
193
the thickness of the ibrous cap11 and to detect the
presence of macrophage aggregates,12 fundamental
morphological aspects for the characterization of thin cap ibroatheroma – the so-called “vulnerable plaque”, the precursor that most often leads to a rupture and coronary occlusion.1,13 In comparison with angioscopy
and intravascular ultrasound, OCT demonstrated greater sensitivity in identifying different morphologies of ath-erosclerotic plaques in patients with acute myocardial infarction, such as plate rupture and erosion, presence of thin cap ibroatheromas, and intraluminal thrombi.14
The differentiation between red (red blood cell-rich) or white (platelet-rich) thrombi is also possible with OCT.15
In the present case, the decision for CABG was based on the identiication of aspects of high complexity of the atherosclerotic plaque (high lipid content, inlammation, thin ibrous cap, rupture and thrombus), combined with the severity of the stenosis. In a recent study, the best values of the measurements made by OCT to identify stenoses with FFR ≤ 0.80 were of minimal lumen area
< 1.95 mm2 (sensitivity of 82% and speciicity of 63%)
and minimal luminal diameter < 1.34 mm (sensitivity of 82% and speciicity of 67%).16 Furthermore,
retro-spective analyses of studies with thrombolytic therapy suggest that patients treated with percutaneous coronary intervention during hospitalization have a lower risk of recurrent infarction and of mortality after two years.17
Finally, the vascular dimensions determined by OCT were used for selection of the measures of the stent. A recent prospective, multicenter study demonstrated that more accurate measurements of the dimensions of the coronary lumen are obtained with OCT when compared with intravascular ultrasound and quantitative coronary angiography,18 indicating that OCT is an accurate tool
for guiding the procedure.
CONFLICTS OF INTEREST
The authors declare no conlicts of interest.
FUNDING SOURCE
None.
REFERENCES
1. Virmani R, Kolodgie FD, Burke AP, Farb A, Schwartz SM. Lessons from sudden coronary death: a comprehensive morphological classiication scheme for atherosclerotic lesions. Arterioscler Thromb Vasc Biol. 2000;20(5):1262-75.
2. Little WC, Constantinescu M, Applegate RJ, Kutcher MA, Bur-rows MT, Kahl FR, et al. Can coronary angiography predict the site of a subsequent myocardial infarction in patients with mild-to-moderate coronary artery disease? Circulation. 1988;78(5 Pt 1):1157-66.
3. Falk E, Shah PK, Fuster V. Coronary plaque disruption. Circula-tion. 1995;92(3):657-71.
4. Kerensky RA, Wade M, Deedwania P, Boden WE, Pepine CJ; Veterans Affairs Non QWISi-HTI. Revisiting the culprit le-sion in non-Q-wave myocardial infarction. Results from the
VANQWISH trial angiographic core laboratory. J Am Coll Cardiol. 2002;39(9):1456-63.
5. Wijns W, Kolh P, Danchin N, Di Mario C, Falk V, Folliguet T, et al.; Task Force on Myocardial Revascularization of the European Society of Cardiology (ESC) and the European Association for Cardio-Thoracic Surgery (EACTS); European Association for Percutaneous Cardiovascular Interventions (EAPCI). Guidelines on myocardial revascularization. Eur Heart J. 2010;31(20):2501-55.
6. Levine GN, Bates ER, Blankenship JC, Bailey SR, Bittl JA, Cercek B, et al. 2011 ACCF/AHA/SCAI Guideline for Per-cutaneous Coronary Intervention. A report of the American College of Cardiology Foundation/American Heart Association Task Force on Practice Guidelines and the Society for Cardio-vascular Angiography and Interventions. J Am Coll Cardiol. 2011;58(24):e44-122.
7. Pijls NH, van Son JA, Kirkeeide RL, De Bruyne B, Gould KL. Experimental basis of determining maximum coronary, myo-cardial, and collateral blood low by pressure measurements for assessing functional stenosis severity before and after percutaneous transluminal coronary angioplasty. Circulation. 1993;87(4):1354-67.
8. De Bruyne B, Pijls NH, Bartunek J, Kulecki K, Bech JW, De Winter H, et al. Fractional low reserve in patients with prior myocardial infarction. Circulation. 2001;104(2):157-62. 9. Kern MJ, Samady H. Current concepts of integrated coronary
physiology in the catheterization laboratory. J Am Coll Cardiol. 2010;55(3):173-85.
10. Yabushita H, Bouma BE, Houser SL, Aretz HT, Jang IK, Schlendorf KH, et al. Characterization of human atherosclerosis by optical coherence tomography. Circulation. 2002;106(13):1640-5. 11. Kume T, Akasaka T, Kawamoto T, Okura H, Watanabe N, Toyota
E, et al. Measurement of the thickness of the ibrous cap by optical coherence tomography. Am Heart J. 2006;152(4):755. e1-4.
12. Tearney GJ, Yabushita H, Houser S, Aretz HT, Jang IK, Schlendorf KH, et al. Quantiication of macrophage content in atherosclerotic plaques by optical coherence tomography. Circulation. 2003;107(1):113-9.
13. Virmani R, Burke AP, Farb A, Kolodgie FD. Pathology of the unstable plaque. Prog Cardiovasc Dis. 2002;44(5):349-56. 14. Kubo T, Imanishi T, Takarada S, Kuroi A, Ueno S, Yamano T, et
al. Assessment of culprit lesion morphology in acute myocardial infarction: ability of optical coherence tomography compared with intravascular ultrasound and coronary angioscopy. J Am Coll Cardiol. 2007;50(10):933-9.
15. Kume T, Akasaka T, Kawamoto T, Ogasawara Y, Watanabe N, Toyota E, et al. Assessment of coronary arterial thrombus by optical coherence tomography. Am J Cardiol. 2006;97(12): 1713-7.
16. Gonzalo N, Escaned J, Alfonso F, Nolte C, Rodriguez V, Jimenez-Quevedo P, et al. Morphometric assessment of coro-nary stenosis relevance with optical coherence tomography: a comparison with fractional low reserve and intravascular ultrasound. J Am Coll Cardiol. 2012;59(12):1080-9.
17. O’Gara PT, Kushner FG, Ascheim DD, Casey DE Jr., Chung MK, Lemos JA, et al. 2013 ACCF/AHA guideline for the management of ST-elevation myocardial infarction: a report of the American College of Cardiology Foundation/American Heart Association Task Force on Practice Guidelines. J Am Coll Cardiol. 2013;61(4):e78-140.