S
CIENTIFIC
A
RTICLES
Revista Brasileira de FisioterapiaDidactic software for modeling heating
patterns in tissues irradiated by
therapeutic ultrasound
Software didático para modelagem do padrão de aquecimento dos tecidos
irradiados por ultra-som fisioterapêutico
Maggi LE1,2, Omena TP2, von Krüger MA2, Pereira WCA2
Abstract
Introduction:Ultrasound is a resource commonly used in Physical Therapy. However, its inadequate application may produce insufficient heating or cause damage to biological tissues. Therefore, the knowledge on the optimum parameters for achieving the appropriate temperature, within safe limits, is necessary. Heat generation depends on equipment parameters and the physical properties of tissues. This study presented a software that simulates the energy and temperature variation in tissues over time, thus allowing users to view the heating patterns in tissues as a function of these parameters. Methods: The software was implemented based on the bioheat transfer equation for four layers (skin, fat, muscle and bone), in which the user can change the thickness and thermal or acoustic properties of these tissues. The intensity, frequency and time of application can also be chosen. Graphs showing the percentage energy absorption in relation to depth and the respective temperature variation per millimeter of tissue are presented. Results: Simulations were produced to give examples of situations of interest for therapy, by varying the time of application, thickness and ultrasound frequency. Differences in heating patterns are seen, especially at the interfaces.
Conclusions: The software made it possible to study the heating of biological tissues by ultrasound and can be used both for teaching purposes and for planning heating doses for continuous waves. In the future, the software will be adapted, in order to estimate which dose should be regulated in the apparatus to maintain the desired temperature for the time chosen. Software available in: http://www.peb.ufrj.br/lus.htm.
Key words: physical therapy; education; ultrasound; thermal field.
Resumo
Introdução: O ultra-som é um recurso bastante utilizado em Fisioterapia. Entretanto, a aplicação inadequada pode promover
aquecimento insuficiente ou causar danos aos tecidos biológicos. Por isso, é importante que se conheçam os parâmetros ótimos para atingir a temperatura adequada, dentro dos limites seguros. A geração de calor é função dos parâmetros do equipamento e das propriedades físicas dos tecidos. Este trabalho apresentou um software que simula a variação da energia e da temperatura nos tecidos ao longo do tempo, permitindo ao usuário visualizar o padrão de aquecimento nos tecidos em função dos parâmetros.
Materiais e métodos:O software foi implementado com base na equação biotérmica, supondo quatro camadas (pele, gordura, músculo
e osso), das quais o usuário pode alterar espessura e propriedades acústicas e térmicas. Pode-se também escolher intensidade, freqüência e tempo de aplicação. São apresentados gráficos com o percentual de energia absorvida ao longo da profundidade e a respectiva variação de temperatura por cada milímetro de tecido.Resultados:Foram realizadas simulações exemplificando situações de interesse para a terapia, variando tempo de aplicação, espessura e freqüência do ultra-som. Podem ser observadas as diferenças do padrão de aquecimento, em especial nas fronteiras das interfaces. Conclusões:O software permitiu o estudo do aquecimento de tecidos biológicos por ultra-som e pode ser usado tanto para fins didáticos como para planejamento de doses de aquecimento, para ondas contínuas. Numa próxima etapa, pretende-se adequá-lo para estimar qual dose deve ser regulada no aparelho, para manter a temperatura desejada pelo tempo escolhido. Software disponível em: http://www.peb.ufrj.br/lus.htm.
Palavras-chave: fisioterapia; ensino; ultra-som; campo térmico.
Received: 04/07/2007 – Revised: 03/12/2007 – Accepted: 25/04/2008
1Universidade Estadual de Goiás (UEG) – Goiânia (GO), Brazil
2Biomedical Engineering Program (COPPE), Universidade Federal do Rio de Janeiro (UFF) – Rio de Janeiro (RJ), Brazil
Correspondence to: Luís Eduardo Maggi, Programa de Engenharia Biomédica, COPPE, Universidade Federal do Rio de Janeiro, Caixa Postal 68.510, CEP 21941-972, Rio de Janeiro (RJ), Brazil, e-mail: [email protected]
Parts of this work has been previously published at the Proceedings of the Brazilian Congress of Biomedical Engineering 2006 (see reference 12) and an abstract has been presented at the III International Congress of Physical Therapy, 2007 (see reference 13).
205
Introduction
In Physical herapy, thermotherapy treatments are usually classiied as deep or supericial, and in both cases heat transfer to the tissues may occur in three diferent ways: by conduction, convection or radiation1. In the case of deep thermotherapy treatments, in which tools (ultrasound, microwave, and short waves) are capable of heating internal tissues with little inl u-) are capable of heating internal tissues with little inl u-are capable of heating internal tissues with little inl u-capable of heating internal tissues with little inl u-capable of heating internal tissues with little inl u-of heating internal tissues with little inl u-of heating internal tissues with little inl u-heating internal tissues with little inl u-heating internal tissues with little inl u-internal tissues with little inl u-internal tissues with little inl u-tissues with little inl u-tissues with little inl u-with little inl u-with little inlu-ence on supericial tissues, the main form of heat transfer is radiation (diathermy)2.
The physiological alterations produced by therapeutic ultrasound (TUS) on biological tissues are traditionally grouped into two categories: thermal and mechanical (non-thermal) effects. Both occur on the body, but their rate and magnitude depend on the supply cycle and on the output intensity3.
Since its development in the 1950s, TUS has been used to promote heating in the treatment of musculoskeletal disorders. When tissues reach a temperature range of 40 to 45°C for approximately five minutes, the following bio-logical effects are triggered increased metabolism, pain relief, reduced joint stiffness and increased blood flow4. Temperatures above this threshold may cause cell damage, whereas lower temperatures are unlikely to promote the desired effects.
Ultrasound heating results from the interaction between the acoustic and thermal properties of the tissues and the irradiated wave. In order to use TUS safely and efficiently, the physical therapist must know the number, sequence, and thickness of the tissue layers to be irradiated, besides the following physical properties of each tissue: acoustic im-pedance, absorption coefficient, specific heat, and thermal conductivity. As for the source of irradiation (TUS equip-ment), the professional must define wave frequency (1 or 3MHz), mode of emission (continuous or pulsed), intensity, and length of treatment.
In clinical practice, the physical therapist usually selects the dosage (intensity and length of treatment) based on the information contained in the equipment’s instruction manuals, which simply recommend dosage tables accord-ing to each pathology with no adequate reference to the scientific literature5. Electrotherapy textbooks only provide general knowledge of ultrasound and its effects on bio-logical tissues3,6, leaving the physical therapist to learn the method empirically. It should be noted at this point that the latest studies have shown a systematic procedural error in TUS application that has a deeper cause, namely the lack of theoretical development and of controlled experiments to evaluate and even to quantify the efficiency of ultrasound in physical therapy7-10.
Several mathematical models have been implemented to aid the understanding of energy and temperature behavior in continuous ultrasound beams11,12. Nevertheless, the ap-plication of these methods frequently requires advanced mathematical knowledge and complex software that is not accessible to health professionals and comes with pre-es-tablished, hard to manipulate and often unalterable physi-cal parameters.
Given this scenario, this paper puts forward an educa-tional software that simulates the ultrasound heating pat-tern of tissue, based on a simplified mathematical model of the biothermal equation (Bioheat Transfer, BHT)13. This equation describes the behavior of temperature in tissues over time, at different depths. The simulator contains ad-justable acoustic as well as thermal parameters, and allows the operator to visualize the evolution of energy and tem-perature distribution to the tissues (skin, fat, muscle, and bone) during the ultrasound propagation. The purpose of this software is to provide physical therapists with a tool to educate them about the basic physical phenomena involved in ultrasound heating, thus improving their ability to evalu-ate the dosages suggested for each case.
Materials and methods
his section consists of two parts. In the irst part, the model used to create the software is briely described for the beneit of readers interested in the mathematical formulation of the problem. In the second part, the simulator interface is introduced, showing the four layers of tissue in diferent types of graphs and the user-deined parameters.
Mathematical modeling
he implemented model was obtained from the equation that describes the temperature variation of a body according to the amount of heat transferred14, and its detailed description can be seen in the reference section.
he model stems from the principle that the amount of energy responsible for the heating is related to the ultrasound intensity I(x) supplied to the tissue along its depth x (mm), which is described by equation (1).
(1)
where Io is the initial intensity, given in W.cm-2,e is the neperian base, D is the coeicient of tissue attenuation (Np.mm-1), and f is the ultrasound frequency (MHz). he amount of energy'I(x)
206
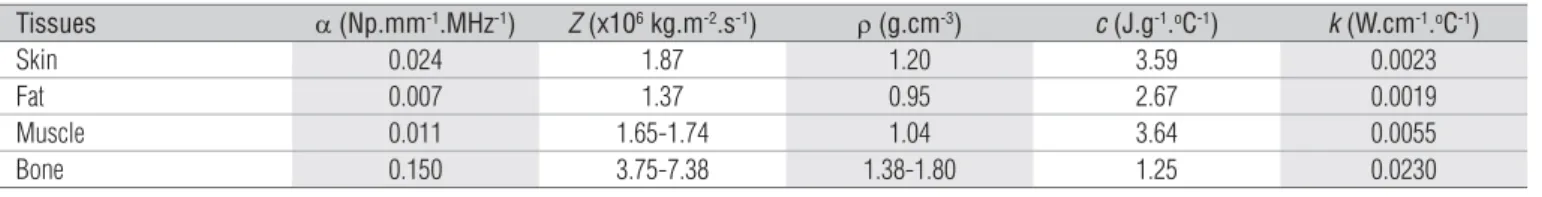
Table 1. Thermal and Acoustic Tissue Properties.
Tissues D (Np.mm-1.MHz-1) Z (x106 kg.m-2.s-1) U (g.cm-3) c (J.g-1.oC-1) k (W.cm-1.oC-1)
Skin 0.024 1.87 1.20 3.59 0.0023
Fat 0.007 1.37 0.95 2.67 0.0019
Muscle 0.011 1.65-1.74 1.04 3.64 0.0055
Bone 0.150 3.75-7.38 1.38-1.80 1.25 0.0230
intensity that goes into and the intensity that comes out of that layer, according to equation (2)15.
(2)
hus, we have a one-dimensional, simpliied version of the biothermal equation (BHT), commonly used to simulate ultrasound heating, which may be seen in equation (3). For the sake of simplicity, it does not take into account the loss by blood perfusion, and the temperature variation per space unit is considered equal to the temperature variation per time unit, which may be applied to thin mediums (measured in millimeters)16,17.
(3)
where, Tf is the final temperature, after t seconds of heat-ing. The Uparameter is the tissue density (g.cm-3),c is the specific heat ( J.g-1.oC-1),k is the coefficient of thermal con-ductivity (W.cm-1.oC-1) and T
ois the initial temperature of the human body.
he equations were used to simulate TUS application to an area of the body with four tissue layers, throughout its depth (with 1mm increments) and time (with 1s increments), assuming a ixed (head) transducer is used. It is important to note that, given the way equation (3) was implemented, one can simulate thicker tissues, and the software itself internally subdivides each layer in consecutive 1mm thick slices before applying the equation in question. his procedure is transpa-rent to the user.
The simulation software
When the physical therapy ultrasound is applied, its beam reaches up to four layers of tissue: skin, hypoderm ( fat), muscle, and bone18. The software was developed with the use of LabVIEW 7.1 (National Instruments), imple-menting these layers (according to tissue properties, as in Table 119,20), and simulating the passage of a flat wave ac-cording to the equations previously described. The software allows the user to define the following parameters of each layer: thickness (x), attenuation coefficient (D), acoustic im-pedance (Z), density (U), specific heat (c), and thermal con-ductivity (k). Thus, in order to simulate other tissues (dense
connective tissue, such as tendons), organs (liver, spleen), or even prosthetic material such as metal (titanium), the user simply needs to have the properties requested by the software in relation to the simulated layer.
The software allows the user to define the values se-lected in the equipment in order to carry out the therapy: transducer frequency (f), initial applied intensity (Io), and time of application (t). The initial temperature of the tis-sue (To) is standardized at 36ºC, the average human body temperature, but it can also be altered in the simulation, ac-cording to user needs. The software displays a screen with 12 graphs distributed on a 3x4 matrix (Figure 1). In the first row are the graphics for intensity variation by tissue depth
I(x) (as in equation (1)), which in addition to representing the percentage loss of ultrasound intensity during its pas-sage (continuous line) also show the amount of energy (If) that arrives at each interface. The dashed line represents the percentage loss of intensity, after suffering one reflec-tion. The Et(%) parameter indicates the total percentage of energy that remained in the tissue layer, after the passage of the ultrasound (including one reflection).
In the second row of graphs, the gray scale (in the software the scale is in color) represents the variation of the amount of energy'I(x) which remains in each 'x of 1mm thick tissue, after the passage of the ultrasound (according to equation (2)). he colors vary from black (minimum) to white (maximum), covering diferent hues of blue, depending on the intensity of energy deposited in each millimeter of each layer.
In the third row of graphs, there is a representation in gray (the software shows it in color scale) of the inal Tf tempera-ture in each millimeter of xthickness, after the irradiation for t
207
Figure 1. Software screen with the simulation of four tissue layers with TUS of 1 MHz and 3 W/cm2, during 180 seconds. The superior graphs show the intensity curve in each tissue layer. The middle graphs represent the energy distribution in each tissue layer, due to the ultra-sound absorption (in the software, the scale is in color). The lower graphs demonstrate the temperature maps generated due to the energy applied in each tissue layer (in the software, the scale is in color). The parameters for each layer are: Di (absorption coefficient); x
i (thickness); Zi (impedance); Ui (density); ci
(specific heat); k
i (thermal conductivity); To (oC) is the initial temperature and t(s) tissue exposition time to ultra sound.
he loss of intensity along the tissue is not constant; it decreases exponentially (as seen in equation (1)). Hence, the four intermedi-ate graphs represent the distribution of percentage energy'I(x)
absorbed by each layer having a 'x thickness, along the tissues. his energy is used in equation (3) to calculate the inal temperature of each 1mm 'x slice in the tissue and to show the temperature distri-bution over time (four bottom graphs in Figure 1).
Results
Below are examples of four simulations of interest to phy-sical therapy professionals, showing the potentiality of the sof-tware to communicate the inluence of the physical properties of the tissue and of the ultrasound wave.
First simulation: influence of bone density
variation on tissue heating
According to the literature18, acoustic impedance depends on the density and speed of the wave in the medium (Z=U.c). Because bone tissue varies in density from 1.38 to 1.81g.
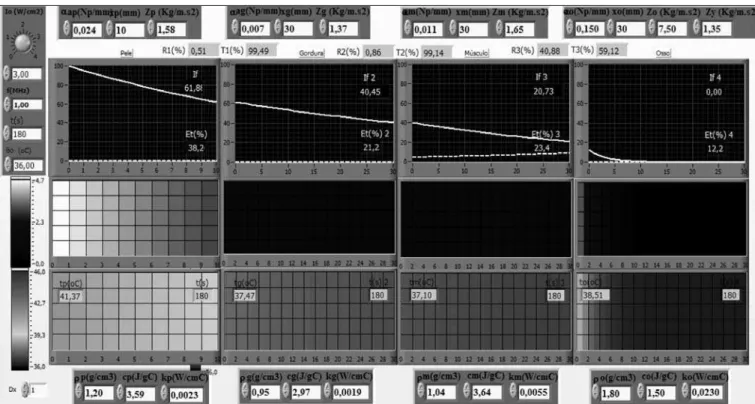
cm-3) and in acoustic impedance from 3.75 to 7.40kg.m-1s-2, it is important to know the inluence of the variations of these properties on tissue heating. To do so, two simulations were conducted, using the four consecutive tissue layers, the skin being 4mm thick, and the other tissues, 10 mm thick. hey were all irradiated for 180 seconds, with an intensity of 2.0W. cm-2 at a frequency of 1MHz. In the irst simulation (Figure 2), bone density (Uwas 1.38g.cm-3 and acoustic impedance (Z) was 3.75kg.m-1s-2.
In the second simulation (Figure 3), bone density was 1.80g. cm-3 and impedance 7.4kg.m-1s-2. he inluence of density and, consequently, acoustic impedance on the inal temperature can be clearly seen. When these values were minimal, bone temperature reached a limit value of 43.25ºC; when values were maximal, the temperature rose to 40.63ºC. hat shows the inluence of density on acoustic impedance and consequently on the relection of the energy (15.12% for minimal values, and 40.37% for maximal values) in the muscle-bone interface.
208
Figure 2. Software simulations with minimum values for bone density and acoustic impedance
209
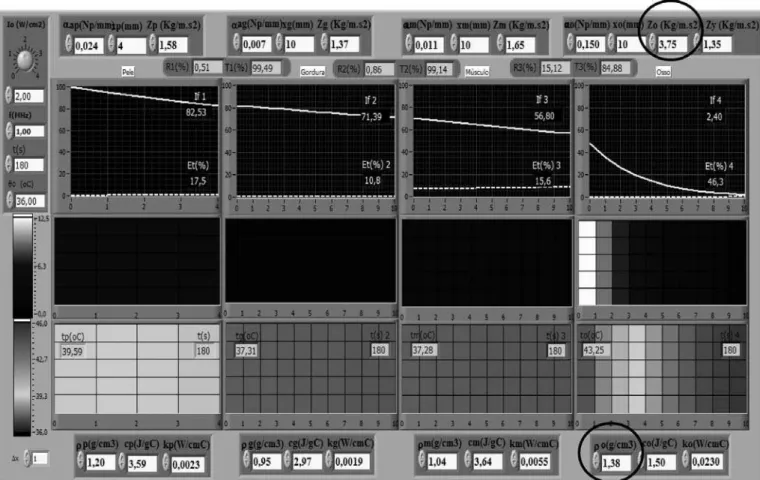
Uo 1.38 g/cm3 Zo 3.75 kg/ms2
minimum values
35 36 37 38 39 40 41 42 43 44
0 20 40 60 80 100 120 140 160 180 200
Temperature
(ºc)
Time (S)
Skin Fet Muscle Bone
Figure 4. Graphs on the temperature time variation in the first millimeter of the skin, fat, muscle and bone layers for the minimum values for bone density and acoustic impedance.
Second simulation: influence of muscle thickness
on heating
In this case, heat was applied for 180 seconds to skin 4mm, fat and bone 10mm, and muscle 30mm. he remaining values were kept according to the previous simulation, with maximal bone density and acoustic impedance values. It is common for the physical therapist to assume that the tissue that absorbs the highest amount of energy will heat the most. However in this simulation we found that, although the muscle absorbed 41.3% of energy and fat absorbed 10.8%, the inal temperature in the outermost layer of these tissues was similar (Figure 6).
A temperature vs. time curve graph was used to verify the thermal behavior of these tissues (Figure 7). It is relevant to point out that the time of ultrasound application determines which of the tissues will heat more in relation to the other. When heating lasted 60 seconds, the inal temperature of the bone layer (37.66ºC) was greater than that of the skin (37.27ºC). However, when the time of application was 160 se-conds, the initial part of the skin layer heated more (39.22ºC) than that of the bone (38.84ºC). his phenomenon can also occur between fat and muscle, although this diference may be less signiicant.
Third simulation: influence of fat thickness on the
heating of the other tissues
In order to compare the inluence of fat thickness on the energy absorbed by the other tissues, its thickness was tripled in relation to the previous simulation, and the remaining parame-ters were kept constant. It is often claimed that the thickness of fat has little inluence on the heating of other tissues because of its low absorption coeicient. he percentages of energy located in the muscle and in the bone had a signiicant reduction, whe-reas fat thickness incwhe-reased to 30 mm (Figure 8). In the irst case (Figure 6), the muscle and the bone absorbed 41.3% and 21.2% of the total energy respectively. However, when the fat layer was thicker (Figure 8), these percentages fell to 31.2% and 16% res-pectively. Nonetheless, the reduction of the inal temperature in the most supericial layer of the muscle was 0.32ºC ( from 37.29ºC to 36.97ºC), and in the bone, 0.73ºC ( from 38.98ºC to 38.25ºC), which characterizes a light to moderate reduction.
Fourth simulation: influence of frequency on heating
210
Figure 6. Software simulations with skin (4mm), fat (10mm), bone (10mm) and muscle (30 mm) thickness, during 180 seconds and 2.0 W/cm2.
Uo 1.8 g/cm3 Zo 7.4 kg/ms2
Maximum values
35 36 37 38 39 40 41 42 43 44
0 20 40 60 80 100 120 140 160 180 200
Temperature (º
c)
Time (S)
Skin Fet Muscle Bone
211 Skin=4mm fet=10mm muscle=30mm bone=10mm
35.5 36 36.5 37 37.5 38 38.5 39 39.5 40
0 20 40 60 80 100 120 140 160 180 200
Temperature
(ºc
)
Time (S)
Skin Fet Muscle Bone
Figure 7. Temperature graphs at the first millimeter in the skin (4mm), fat (10mm), bone (10mm) and muscle (30 mm) thickness, during 180 seconds and 2.0 W/cm2.
transducer (1MHz, in this case). herefore, if a supericial tre-atment is required, the transducer should be used at higher frequencies (e.g. 3 MHz)1. For this simulation, the following parameters were used: 4mm for skin and fat, 30mm for muscle and 10mm for bone during 180 seconds at 3MHz. here was increased ultrasound energy absorption by the skin, and there-fore greater heating (the inal temperature was 46ºC) (Figure 9) when compared to the results obtained with a 1MHz frequency (Figure 8). hat occurs because the coeicient of absorption in-creases with frequency2 and with the amount of energy deposi-ted in each centimeter of the most supericial tissues, possibly resulting in serious injury.
Discussion
We developed a software capable of simulating a biologi-cal environment with four layers of tissue. Its main purpose is to create conditions for physical therapists to develop their knowledge of the physical phenomena involved in ultrasound propagation and heating of biological tissue. This will allow these professionals to choose more suitable
dosages and educate them about the evolution of the sug-gested treatment.
he implemented mathematical model takes into account the heat loss by conduction to the adjacent tissues but it still does not consider cooling due to blood perfusion. herefore, the inal temperature values may be overestimated, which does not invalidate the qualitative results obtained. Another limitation of the model is that the biothermal equation (BHT) has not been solved analytically, however we proposed an approximate solution by ininitesimal increments. In addi-tion to that, the model does not predict the mobility of the transducer, as this form of application is diicult to be mo-deled given the various head shapes and movement speeds. However, these results with the ixed head allow the physical therapist to predict with certainty how long the ultrasound can be applied to the same treatment area to reach the desi-red temperature level.
212
Figure 8. Software simulations with skin (4mm), fat (30mm), bone (10mm) and muscle (30 mm) thickness, during 180 seconds at a frequency of 1MHz.
213
relection coeicient tripled, causing a reduction of approxi-mately 2ºC in the supericial layer of the bone tissue.
In the second simulation, the tissue that absorbed the highest amount of energy did not necessarily heat the most. That is due to the fact that temperature variation in the me-dium does not depend solely on the absorption coefficient, but also on the amount of heat loss (thermal conductivity) and on the amount of energy it needs to elevate its tempe-rature by 1ºC (specific heat). This simulation also showed that the tissue that heats the most is not always the same, but that this depends on the time of application. This shows that the heating produced by ultrasound propagation in the biological tissues is a complex phenomenon, and that the rules commonly found in instruction manuals to aid the professionals may be oversimplified and devoid of effective practical value.
In the third simulation, we analyzed the inluence of the thickness of the fat layer on heating. When fat thickness was tripled, the temperature variation in the muscle was almost ir-relevant, but in the bone it was moderate, which indicates that the thickness of the fat layer should also be evaluated, contrary to what is commonly claimed in this ield.
In the last simulation, we studied the efects of change of frequency and found that, at 1MHz, the inal temperature was higher in the skin and bone tissues, and that at 3MHz it was higher in the skin and fat tissues. According to the literature4, there is signiicant heating in the most supericial tissues (skin and fat), however no attention is given to the fact that besides being more supericial, this heating is also more intense than it would be if the application was made using a lower frequency, with the same intensity. Because the attenuation is greater at
higher frequencies, the percentage drop in energy in relation to depth is more signiicant. hat causes the energy delta to be greater in the initial centimeters of the tissues, which in turn promotes a more pronounced temperature increase that may surpass 46ºC and cause protein denaturation. In short, for the same intensity and length of exposure, the heating is greater at 3MHz than at 1MHz.
In conclusion, the proposed simulation software was use-ful for the study of intensity and temperature distribution in biological tissues and may be useful for educational purposes such as regular Biophysics and Electrothermotherapy courses aimed at physical therapists. hough simple, the implemented model was capable of reproducing situations of interest to the professional who works with TUS.
he next steps are to develop the equation to include the losses by perfusion and to provide the simulator with the abi-lity to calculate the necessary dosage (intensity and frequency) to produce a speciic heating temperature at a given depth for a ixed period of time. his feature would allow the professional to prepare treatment protocols for testing.
We expect to produce an executable version of the sof-tware using the resources available in LabVIEW. In future, it should be available to potential users online by accessing the Ultrasound Laboratory website of the Biomedical Engineering Program at COPPE (UFRJ).
Acknowledgements
To Brazilian Grant Agencies CNPq and Capes for the inan-cial support.
References
1. Prentice WE. Modalidades terapêuticas em medicina esportiva. 4ª ed. São Paulo: Manole; 2002.
2. Low J, Reed A. Eletroterapia explicada: princípios e prática. 3a ed. São
Paulo: Manole; 2001.
3. Starkey C. Recursos terapêuticos em Fisioterapia. 2ª ed. São Paulo: Manole; 2001.
4. Kitchen S. Eletroterapia: Prática baseada em evidências. 11ª ed. São Paulo: Manole; 2003.
5. Sá JNB, Bunn OS, Pereira WCA. Análise dos fundamentos das dosagens indicadas para a aplicação do ultra-som em Fisioterapia. In: XX Congresso Brasileiro de Engenharia Biomédica, 2006, São Pedro. Anais do XX Congresso Brasileiro de Engenharia Biomédica. São Paulo: SBEB, 2006. v. 1. p.815-8.
6. Bazin S, Kitchen S. Eletroterapia de Clayton. 10ª ed. São Paulo: Manole; 1998.
214
8. Baker kG, Robertson VJ, Duck FA. A review of therapeutic ultrasound: biophysical effects. Phys Ther. 2001;81(7);1351-8.
9. Busse JW, Bhandari M, Kulkarni AV, Tunks E. The effect of low-intensity pulsed ultrasound therapy on time to fracture healing: a meta-analysis. CMAJ. 2002;166(4):437-41.
10. Baker KG, Robertson VJ, Duck FA. A review of therapeutic ultrasound: effectiveness studies. Phys Ther. 2001;81(7):1339-50.
11. Felonenko EA, Khokhlova VA. Effect of acoustic nonlinearity on heating of biological tissue by high-intensity focused ultrasound. Acoustical Physics. 2001;47(4):468-75.
12. Makov YN. Thermal fields and thermal doses in ultrasonic surgery: a model of a gaussian focused beam. Acoustical Physics. 2001;47(3):333-40.
13. Deng, ZS, Liu J. Analytical study on bioheat transfer problems with spatial or transient heating on skin surface or inside biological bodies. J Biomech Eng. 2002 Dec;124(6):638-49.
14. Zemansky MW. Calor e termodinâmica. Rio de Janeiro: Guanabara Dois; 1978.
15. Pierce, A.D. Acoustics: an Introduction to Its Physical Principles and Applications, New York, Ed. McGraw-Hill. 1981.
16. Maggi LE, Omena TP, Pereira WCA, von Krüger MA. Modelagem do padrão de aquecimento dos tecidos irradiados por ultra-som fisioterápico. In: XX Congresso Brasileiro de Engenharia Biomédica, 2006, São Pedro. Anais do XX Congresso Brasileiro de Engenharia Biomédica. São Paulo: SBEB, 2006.
17. Maggi LE, Omena TP, von Kürger MA, Pereira WCA. Software de simulação do aquecimento dos tecidos irradiados por ultra-som fisioterapêutico. In: III Congresso Internacional de Fisioterapia, 2007, Salvador. Anais do III Congresso Internacional de Fisioterapia. Bahia: SBEB, 2007.
18. Hedrick WR, Hykes DL, Starchman DE. Ultrasound physics and
instrumentation. 3rd ed. Sant Louis Missouri: Mosby; 1995.
19. Goss, S.A., Johnston, R.L., Dunn, F. Compilation of Empirical Ultrasonic Properties of Mammalian Tissue II, Journal of Acoustic Soc Am. 1980; 68 (1): 93-108.