Commercially Important Traits in Swiss Large White
Boars
Doreen Becker1, Klaus Wimmers2, Henning Luther3, Andreas Hofer3, Tosso Leeb1*
1Institute of Genetics, Vetsuisse Faculty, University of Bern, Bern, Switzerland,2Leibniz Institute for Farm Animal Biology, Dummerstorf, Germany,3SUISAG, Sempach, Switzerland
Abstract
The improvement of meat quality and production traits has high priority in the pork industry. Many of these traits show a low to moderate heritability and are difficult and expensive to measure. Their improvement by targeted breeding programs is challenging and requires knowledge of the genetic and molecular background. For this study we genotyped 192 artificial insemination boars of a commercial line derived from the Swiss Large White breed using the PorcineSNP60 BeadChip with 62,163 evenly spaced SNPs across the pig genome. We obtained 26 estimated breeding values (EBVs) for various traits including exterior, meat quality, reproduction, and production. The subsequent genome-wide association analysis allowed us to identify four QTL with suggestive significance for three of these traits (p-values ranging from 4.9961026 to 2.7361025). Single QTL for the EBVs pH one hour post mortem (pH1) and carcass length were on pig chromosome (SSC) 14 and SSC 2, respectively. Two QTL for the EBV rear view hind legs were on SSC 10 and SSC 16.
Citation:Becker D, Wimmers K, Luther H, Hofer A, Leeb T (2013) A Genome-Wide Association Study to Detect QTL for Commercially Important Traits in Swiss Large White Boars. PLoS ONE 8(2): e55951. doi:10.1371/journal.pone.0055951
Editor:Stephen Moore, University of Queensland, Australia
ReceivedAugust 10, 2012;AcceptedJanuary 4, 2013;PublishedFebruary 5, 2013
Copyright:ß2013 Becker et al. This is an open-access article distributed under the terms of the Creative Commons Attribution License, which permits unrestricted use, distribution, and reproduction in any medium, provided the original author and source are credited.
Funding:This study was funded by a grant from the German Research Council (DFG LE 1032/23-1). The funder had no role in study design, data collection and analysis, decision to publish, or preparation of the manuscript.
Competing Interests:Henning Luther and Andreas Hofer are employed by SUISAG, the company who also provided tissue samples and estimated breeding values of the animals. This does not alter the authors’ adherence to all the PLOS ONE policies on sharing data and materials.
* E-mail: [email protected]
Introduction
One of the most challenging tasks in pork production is the improvement of traits with low heritability [1–3]. Most commer-cially important traits are complex and influenced by multiple interacting factors including genetics and environment. The observed albeit low heritabilities suggest that these traits could be successfully improved by selection. However, the cost and difficulty to obtain direct measurements are limiting the improve-ments of these traits. In addition, the estimation of many breeding values relies only on the phenotypes of relatives, which limits their accuracy. Therefore, these traits are ideal candidates for the application of molecular genetic tools in future breeding programs. The identification of genes and polymorphisms associated with commercially important traits can provide useful markers for the selection of genetically superior animals. Knowledge of the genetic and molecular background is required to accelerate the genetic improvement.
Since the first QTL genome scan in pigs was reported [4] numerous QTL analyses have been conducted to identify QTL for various traits in pig production. For example Karlskov-Mortensen et al. reported QTL on chromosomes SSC 1, 4, 9, 10, 13 and 16 affecting fat deposition and lean meat content [5]. For various growth traits QTL were detected on SSC 1, 4, 7 and 8 by de Koning et al. [6]. Several QTL for pH at 45 minutes post mortem have been shown to be located on SSC3, 4, 5, 6, 8, 11, 13 and 17 [7]. Identification of multiple loci associated with one trait suggests an underlying complex genetic architecture. Originally, QTL
scans have been mainly performed on experimental crosses between a domestic breed and wild boar or Meishan [8–10]. Over the last decade, a number of QTL scans have been carried out on commercial pig line crosses, including Large White, Pie´train, Berkshire and Yorkshire [11,12].
So far, over 6,800 QTL for 585 different traits have been identified in pigs (PigQTLdb, http://www.animalgenome.org/ cgi-bin/QTLdb/SS/index), more than in any other livestock species. The reported QTL were shown to influence meat quality, health, production, reproduction and exterior traits. However, only a few have been further investigated and led to discovery of associated or even causative mutations. These include a single base pair substitution in a non-coding region ofIGF2on SSC 2 that explains variation in muscle mass and back fat thickness and a nonconservative substitution in the PRKAG3 gene on SSC 15 having an effect on meat quality [13,14]. Since most loci explain just a small fraction of the phenotypic variation, the identification of the causative genetic variations underlying QTL remains challenging [15].
months several GWAS investigating various traits of commercial or scientific interest in different pig populations were published [21–28]. The aim of this study was to identify QTL affecting economically important traits in a Swiss commercial boar line using the PorcineSNP60 BeadChip.
Results
We used 26 estimated breeding values (EBVs) rather than raw phenotypes for our GWAS. Breeding values have the advantage that they are free of systematic environmental effects on measured phenotypes, as these effects are considered in the statistical model used for the estimation of EBVs. Additionally, they reflect the genetic makeup more accurately because they do not solely rely on own records but include information from all measured relatives. The analyzed traits with available EBVs and key figures of their distribution are shown in Table S1. The EBVs are expressed as a deviation from the mean of a defined group of animals. Therefore the median is close to zero.
We genotyped 192 artificial insemination boars of a commercial line derived from the Swiss Large White breed for 62,163 SNP markers with an average distance of 49 kb. The average call rate per individual was 96.02%. We removed non-informative markers and markers with low call rate. After these quality control steps 186 individuals and 47,045 SNPs remained for the final analysis. We calculated genome-wide pairwise identity-by-state distances and quantified the population stratification (Figure S1). Depending on the analyzed trait the calculated genomic inflation factor varied between 1.15 and 2 indicating that our material was highly stratified. Performing association studies with stratified samples can lead to false positive results, i.e. detected associations can be due to the underlying structure of the population instead of a biologically meaningful association with one or several genes. Therefore, we corrected for the population stratification in our association analysis using the egscore function implemented in GenABEL and by calculating stratified associations within clusters. These corrections in addition to genomic control reduced the genomic inflation factor to reasonable values between 1.00 and 1.01 in all analyses (Figure 1).
We set the p-value thresholds for moderately significant and highly significant associations at 561025and 561027, respective-ly. We did not detect any highly significant associations in our material. However, we detected four QTL with moderately significant associations (Table 1).
For the EBV pH1 we detected a QTL on SSC 14. We determined the positions of the associated markers in the Sscrofa 10.2 assembly of the pig genome. We observed two additional SNPs that are associated with EBV pH1, which are no longer contained in the Sscrofa 10.2 assembly. In the previous Sscrofa 9.2 assembly one of these two SNPs resided on SSC 11, while the other was on SSC 3, and may thus represent potential additional QTL for the EBV pH1.
For the EBV carcass length we observed two closely spaced associated SNPs on SSC 2 (Table 1). The highest significance in our study was observed for a QTL for the EBV rear view hind legs with a p-value after correction for population stratification of 4.9961026. We observed two QTL supported by multiple closely spaced SNPs for this trait on SSC 10 and SSC 16, respectively (Table 1).
We grouped the animals according to genotype at the best-associated SNPs for the four detected QTL and analyzed their phenotype distribution (Figure 2). The QTL for EBV pH1 showed a largely additive effect. In contrast, the genotypes at the QTL for the EBV carcass length and the QTL on SSC 10 for EBV rear
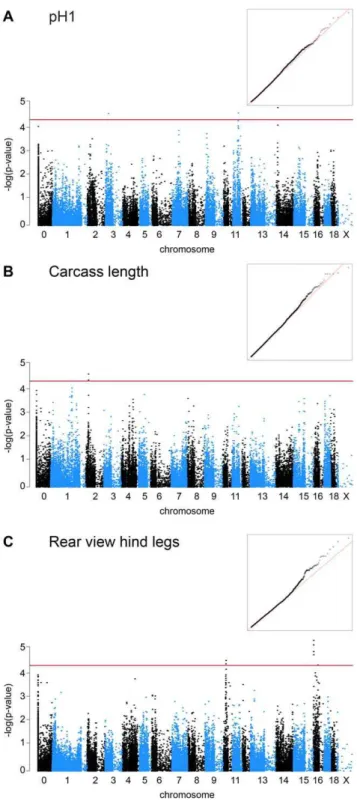
Figure 1. Manhattan plots of genome-wide association studies for EBVs of commercially important traits in pigs.The red lines indicate the significance threshold for moderately significant associa-tions (p = 561025
). ‘‘Chromosome 0’’ harbors SNP markers that have not yet been mapped to the pig reference genome. The inserted quantile-quantile (QQ) plots show the observed versus expected log p-values. The straight line in the QQ plots indicates the distribution of SNP markers under the null hypothesis and the skew at the right edge indicate that these markers are stronger associated with the traits than it would be expected by chance. Please note that in Figure 1A there are appear to be associated SNPs on SSC 3, 11, and 14. The two associated SNPs on SSC 3 and 11 mapped to these chromosomes in the Sscrofa 9.2 assembly, but are no longer placed on any chromosome in the Sscrofa 10.2 assembly.
view hind legs indicated a recessive effect of the variant allele. Finally, at the QTL on SSC 16 for EBV rear view hind legs, heterozygous animals showed EBVs that are outside of the range of animals with the two alternative homozygous genotypes (overdominance).
Discussion
In this study we identified four QTL with moderate significance in a Swiss commercial pig population. We think that the relatively low number of detected QTL is primarily due to the small number of animals used in this study. The population substructure with different subclusters in our animal cohort (Figure S1) required Table 1.Top allelic association hits in the GWAS for QTL affecting commercially important traits.
Trait Marker Chromosome
Position (Sscrofa build
10.2)b Alleles MAF prawa
pH1 ASGA0061594 14 14,730,418 C/T 0.49 1.5761025
H3GA0032045 n.d.b n.d.b A/C 0.35 2.59
61025
ASGA0105130 n.d.b n.d.b C/T 0.49 2.74
61025
carcass length ASGA0010032 2 42,938,876 A/G 0.38 2.7361025
H3GA0006598 2 42,886,909 C/T 0.23 4.7661025
rear view hind legs H3GA0045902 16 6,289,550 T/G 0.50 4.9961026
ASGA0072056 16 6,198,618 A/G 0.44 7.6861026
H3GA0045917 16 6,343,134 C/T 0.40 1.4261025
H3GA0045908 16 6,312,026 T/C 0.41 1.9661025
ALGA0058443 10 40,670,821 C/A 0.37 3.3561025
ALGA0058422 10 39,424,934 A/G 0.44 4.5661025
MARC0010334 10 39,538,944 T/C 0.44 4.5661025
ALGA0058431 10 39,626,717 C/T 0.44 4.5661025
DRGA0010453 10 39,667,084 C/T 0.44 4.5661025
ap-values were calculated using
x2 tests in an allelic association study.
bThe positions of the associated SNPs on the latest version of the pig reference genome were determined by BLAST searches with the flanking sequences of the SNPs as
provided by illumina with respect to the Sscrofa 10.2 assembly. Some of the flanking sequences did not give a significant BLAST hit with respect to this genome reference sequence.
doi:10.1371/journal.pone.0055951.t001
Figure 2. Genotype-phenotype correlations.The animals were grouped according to genotype at the best associated SNPs of each of the four detected QTL. Animal numbers are indicated at the bottom. The call rates for these SNPs were.98.9%. For each of the four QTL the homozygous alternative genotype classes have different phenotypic distributions (p,0.05, Welch’s t-test). (A) EBV pH1 distributions with respect to genotype at SNP ASGA0061594 on SSC 14. (B) EBV carcass length in boars with respect to genotype at SNP ASGA0010032 on SSC 2. (C) EBV rear view hind legs distributions in Swiss Large White boars with respect to genotype at SNP ALGA0058443 on SSC 10. (D) EBV rear view hind legs distributions in Swiss Large White boars with respect to genotype at SNP H3GA0045902 on SSC 16.
correction of the p-values for the effects of the population stratification, which also negatively affected the power of the GWAS. The limited power of our study design is reflected by the fact that we only found QTL with very even allele distributions. The best-associated SNPs at the four detected QTL had MAFs between 0.37 and 0.50. Considering all associated SNPs, the lowest MAF was 0.23 at marker H3GA0006598 on SSC 2. The detection of QTL caused by rare alleles of the same effect size would have required larger animal numbers.
For three of the four detected QTL, similar QTL have previously been identified at roughly the same locations in other pig populations. Lee et al. reported a QTL for carcass length in an experimental Meishan6wild boar family on SSC 2 at 20.8 cM [29]. Additionally, Evans et al. identified a QTL for carcass length on SSC 2 in the region of 0–10 cM in a Landrace population [30]. A QTL for ‘‘rear upright legs’’, which might be a correlated trait to the rear view hind leg score of our analysis, was identified at 43 Mb on SSC 10 [31] This QTL was identified by genome-wide association study in commercial pigs from Large White or Large White6Landrace crosses. Another study identified a QTL for rear leg score in a Japanese Landrace population at 82 cM on SSC 10 [32]. Finally, Lee et al. reported QTLs for the trait ‘‘back legs’’ in a Large White6Meishan crossbred population on SSC 10 and SSC 16 at 126 cM and 10 cM, respectively [33]. It is very difficult to evaluate whether these reported QTL are really the same QTL that we found as QTL from linkage analyses were typically mapped with very low resolution and have very large confidence intervals. If QTL are independently discovered in different populations, this suggests that they may indeed be due to a biologically relevant genetic variation rather than to confounding effects such as e.g. population stratification artifacts.
So far, we have no knowledge of a study concerning the trait pH one hour post mortem. There are several studies about the pH 45 minutes post mortem which closely correlates with the trait used in our analysis (PigQTLdb, http://www.animalgenome.org/cgi-bin/ QTLdb/SS/index). However, a QTL for pH 45 minutes post mortem has not been reported on SSC 14. Given the moderate significance of our QTL, a replication study with independent animals would be desirable to confirm the results. Nonetheless, our findings offer a chance to unravel new QTL that contribute to the meat maturation.
The QTL for EBV pH1 detected in our study shows a largely additive effect (Fig. 2A) whereas the QTL for EBV carcass length and EBV rear view hind legs on SSC 10 indicate a recessive effect of the variant allele (Fig. 2B & C). This could be either due to coding variants or to regulatory variants that change the quantitative expression levels of the causative genes. On the other hand, the QTL for EBV rear view hind legs on SSC 16 does not show a simple additive effect (Fig. 2D). For this QTL, animals being heterozygous at the best associated SNP show more extreme phenotypic levels than animals with either homozygous genotype. It seems unlikely that such an overdominance effect can be caused by simple quantitative differences in mRNA expression of the underlying genes. One possible explanation would be provided by non-synonymous variants in genes encoding oligomeric proteins. In such a scenario, it is feasible that oligomers of truly identical proteins (in homozygous animals) have very different properties than oligomers of allelic variants (in heterozygous animals).
Our study provides another example of the usefulness of the PorcineSNP60 BeadChip for genome-wide association studies in pigs. This tool allows the detection of QTL for commercially important traits in pigs. However, it must also be noted that due to the imperfect pig reference genome assembly, the exact genome positions of many markers on this tool are not clear. We observed
very significant shifts of some associated markers between the Sscrofa9.2 and the Sscrofa10.2 assembly. Consequently, the marker spacing may also be expected to be somewhat irregular. Thus, it is quite possible that some real QTL might have been missed due to insufficient marker coverage of the PorcineSNP60 BeadChip. With rapidly increasing genomic resources for the pig, it may be expected that improved genotyping tools will soon become available.
In conclusion, we have mapped four QTL by genome-wide association mapping in Swiss commercial pigs. Three of these QTL coincide with previously detected QTL for similar traits in other independent pig populations while the QTL for EBV pH1 on SSC 14 is described for the first time.
Materials and Methods
Animals and phenotypic data
We obtained previously archived tissue samples of 192 artificial insemination boars from the commercial PremoH line, which is derived from the Swiss Large White breed. The animals were from the breeding company SUISAG (www.suisag.ch) and born between 2004 and 2009. All animals underwent a performance and progeny test according to the test scheme of SUISAG [34]. We obtained 26 corresponding estimated breeding values (EBV) for different pig production traits and used them as phenotypes in our analysis (Table S1). The EBVs were routinely estimated by SUISAG in 3 separate analyses using multiple trait animal models and BLUP [35]. For exterior traits linear description scores by trained technicians on animals tested in the central testing station Sempach and on-farm tested selection candidates were considered. The trait rear view hind legs describes the hind legs from an extreme X- (score 1) to an extreme O- form (score 7). Carcass length was measured in centimeters from the cranial edge of the first cervical vertebra to the cranial edge of the pelvic bone 24 h post mortem in all station tested pigs. The estimation for production traits of field tested crossbred progeny of artificial insemination sires were included in addition to the animals scored for exterior traits. pH1 was measured 1 hour post mortem at the musculus longissimus dorsiin all station tested pigs. Mating and litter records obtained from herdbook farms were used for the estimation of breeding values for reproduction traits. There were less animals with EBVs on reproduction traits, as artificial insemination sires need litter records of daughters to reach an acceptable accuracy.
SNP array genotyping
We isolated genomic DNA from tissue samples with the Nucleon Bacc2 kit (GE Healthcare) according to the manufactur-er’s protocol. DNA samples with a ratio of A260/280 higher than 1.8 and a concentration of approximately 50 ng/ml were genotyped at the Leibniz Institute for Farm Animal Biology, Dummerstorf, Germany using the Illumina Porcine60SNP BeadChip containing 62,163 markers. We used BLASTN to determine the positions of the markers in the Sscrofa 10.2 genome reference assembly of the pig.
Quality control and genome-wide association analyses
these quality control steps 186 individuals and 47,045 SNPs remained for the analysis.
We calculated genome-wide pairwise identity-by-state (IBS) distances to measure population stratification as we used samples of animals with expected diverse genetics. Based on genetic distances between individuals projected into two-dimensional space using multidimensional scaling we grouped the animals into three subpopulations. Additionally, the procedure egscore which uses principal component analysis [37] was used to correct for population stratification in the dataset. We performed allelic genome-wide association analyses for all 26 EBVs. We considered p-values,561027as indicative for strong evidence of association and p-values between 561025 and 561027 as indicative for moderate evidence of association according to the recommenda-tion of the Wellcome Trust Case Control Consortium [38].
Supporting Information
Figure S1 Multidimensional scaling (MDS) plot showing the genomic kinship between the analyzed animals.This plot visualizes the overall genetic distances between the boars
based on 2,000 markers randomly selected out of the total of 47,045 SNP markers. We grouped the animals into three subpopulations based on genetic distances between individuals. (PDF)
Table S1 Estimated breeding values of genotyped material with their median and distribution.
(PDF)
Acknowledgments
The authors are grateful to Brigitta Colomb for expert technical assistance. We thank Marcin Kierczak for helpful discussions regarding R and GWAS methodology.
Author Contributions
Conceived and designed the experiments: DB KW HL AH TL. Performed the experiments: DB KW HL AH. Analyzed the data: DB HL AH TL. Contributed reagents/materials/analysis tools: HL AH. Wrote the paper: DB TL.
References
1. Sonesson AK, de Greef KH, Meuwissen THE (1998) Genetic parameters and trends of meat quality, carcass composition and performance traits in two selected lines of large white pigs. Livest Prod Sci 57: 23–32.
2. van Wijk HJ, Arts DJ, Matthews JO, Webster M, Ducro BJ, et al. (2005) Genetic parameters for carcass composition and pork quality estimated in a commercial production chain. J Anim Sci 83: 324–333.
3. Hermesch S, Luxford BG, Graser HU (2000) Genetic Parameters for lean meat yield, meat quality, reproduction and feed efficiency traits for Australian pigs I. Description of traits and heritability estimates. Livest Prod Sci 65: 239–248. 4. Andersson L, Haley CS, Ellegren H, Knott SA, Johansson M, et al. (1994)
Genetic-mapping of quantitative trait loci for growth and fatness in pigs. Science 263: 1771–1774.
5. Karlskov-Mortensen P, Bruun CS, Braunschweig MH, Sawera M, Markljung E, et al. (2006) Genome-wide identification of quantitative trait loci in a cross between Hampshire and Landrace I: carcass traits. Anim Genet 37: 156–162. 6. de Koning DJ, Rattink AP, Harlizius B, Groenen MAM, Brascamp EW, et al.
(2001) Detection and characterization of quantitative trait loci for growth and reproduction traits in pigs. Livest Prod Sci 72: 185–198.
7. Rohrer GA, Keele JW (1998) Identification of quantitative trait loci affecting carcass composition in swine: II. Muscling and wholesale product yield traits. J Anim Sci 76: 2255–2262.
8. Andersson-Eklund L, Marklund L, Lundstro¨m K, Haley CS, Andersson K, et al. (1998) Mapping Quantitative Trait Loci for carcass and meat quality traits in a Wild Boar6Large White intercross. J Anim Sci 76: 694–700.
9. Geldermann H, Mu¨ller E, Moser G, Reiner G, Bartenschlager H, et al. (2003) Genome-wide linkage and QTL mapping in porcine F2 families generated from Pietrain, Meishan and Wild boar crosses. J Anim Breed Genet 120: 363–393. 10. Knott SA, Marklund L, Haley CS, Andersson K, Davies W, et al. (1998)
Multiple marker mapping of quantitative trait loci in a cross between outbred wild boar and large white pigs. Genetics 149: 1069–1080.
11. Nezer C, Moreau L, Wagenaar D, Georges M (2002) Results of a whole genome scan targeting QTL for growth and carcass traits in a Pietrain6Large White intercross. Genet Sel Evol 34: 371–387.
12. Malek M, Dekkers JCM, Lee HK, Baas TJ, Rothschild MF (2001) A molecular genome scan analysis to identify chromosomal regions influencing economic traits in the pig. I. Growth and body composition. Mamm Genome 12: 630–636. 13. van Laere AS, Nguyen M, Braunschweig M, Nezer C, Colette C, et al. (2003) A regulatory mutation in IGF2 causes a major QTL effect on muscle growth in the pig. Nature 425: 832–836.
14. Milan D, Jeon JT, Looft C, Amarger V, Robic A, et al. (2000) A mutation in PRKAG3 associated with excess glycogen content in pig skeletal muscle. Science 288: 1248–1251.
15. Glazier AM, Nadeau JH, Aitman TJ (2002) Finding genes that underlie complex traits. Science 298: 2345–2349.
16. Ramos AM, Crooijmans RPMA, Affara NA, Amaral AJ, Archibald AL, et al. (2009) Design of a High Density SNP Genotyping Assay in the Pig Using SNPs Identified and Characterized by Next Generation Sequencing Technology. PLoS ONE 4: e6524.
17. Potkin SG, Guffanti G, Lakatos A, Turner JA, Kruggel F, et al. (2009) Hippocampal Atrophy as a Quantitative Trait in a Genome-Wide Association Study Identifying Novel Susceptibility Genes for Alzheimer’s Disease. PLoS ONE 4: e6501.
18. Estrada K, Krawczak M, Schreiber S, van Duijn K, Stolk L, et al. (2009) A genome-wide association study of northwestern Europeans involves the C-type natriuretic peptide signaling pathway in the etiology of human height variation. Hum Mol Genet 18: 3516–3524.
19. Sutter NB, Bustamante CD, Chase K, Gray MM, Zhao K, et al. (2007) A single IGF1 allele is a major determinant of small size in dogs. Science 316: 112–115. 20. Bolormaa S, Porto Neto LR, Zhang YD, Bunch RJ, Harrison BE, et al. (2011) A genome-wide association study of meat and carcass traits in Australian cattle. J Anim Sci 89: 2297–2309.
21. Onteru SK, Fan B, Du Z-Q, Garrick DJ, Stalder KJ, et al. (2011) A whole-genome association study for pig reproductive traits. Anim Genet 43: 18–26. 22. Duijvesteijn N, Knol EF, Merks JW, Crooijmans RP, Groenen MA, et al. (2010)
A genome-wide association study on androstenone levels in pigs reveals a cluster of candidate genes on chromosome 6. BMC Genet 11: 42.
23. Uimari P, Sironen A, Sevo´n-Aimonen M-L (2011) Whole-genome SNP association analysis of reproduction traits in the Finnish Landrace pig breed. Genet Sel Evol 43: 42.
24. Gregersen VR, Conley LN, Sørensen KK, Guldbrandtsen B, Velander IH, et al. (2012) Genome-wide association scan and phased haplotype construction for quantitative trait loci affecting boar taint in three pig breeds. BMC Genomics 13: 22.
25. Wang JY, Luo YR, Fu WX, Lu X, Zhou JP, et al. (2012) Genome-wide association studies for hematological traits in swine. Anim Genet doi: 10.1111/j. 1365-2052.2012.02366.x.
26. Schneider JF, Rempel LA, Snelling WM, Wiedmann RT, Nonneman DJ, et al. (2012) Genome-wide association study of swine farrowing traits. Part II: Bayesian analysis of marker data. J Anim Sci 90: 3360–3367.
27. Wilson K, Zanella R, Ventura C, Johansen HL, Framstad T, et al. (2012) Identification of chromosomal locations associated with tail biting and being a victim of tail-biting behaviour in the domestic pig (Sus scrofa domesticus). J Appl Genet 53: 449–456.
28. Fontanesi L, Schiavo G, Galimberti G, Calo` DG, Scotti E, et al. (2012) A genome wide association study for backfat thickness in Italian Large White pigs highlights new regions affecting fat deposition including neuronal genes. BMC Genomics 13: 583.
29. Lee SS, Chen Y, Moran C, Cepica S, Reiner G, et al. (2003) Linkage and QTL mapping for Sus scrofa chromosome 2. J Anim Breed Genet 120: 11–19. 30. Evans GJ, Giuffra E, Sanchez A, Kerje S, Davalos G, et al. (2003) Identification
of Quantitative Trait Loci for Production Traits in Commercial Pig Populations. Genetics 164: 621–627.
31. Fan B, Onteru SK, Du Z-Q, Garrick DJ, Stalder KJ, et al. (2011) Genome-wide association study identifies loci for body composition and structural soundness traits in pigs. PLoS One 6: e14726.
32. Uemoto Y, Sato S, Ohnishi C, Hirose K, Kameyama K, et al. (2010) Quantitative trait loci for leg weakness traits in a Landrace purebred population. Anim Sci J 81: 28–33.
33. Lee GJ, Archibald AL, Garth GB, Law AS, Nicholson D, et al. (2003) Detection of quantitative trait loci for locomotion and osteochondrosis-related traits in Large White6Meishan pigs. Anim Sci 76: 155–165.
35. Henderson CR (1975) Best linear unbiased Estimation and Prediction under a selection model. Biometrics 31: 423–447.
36. Aulchenko YS, Ripke S, Isaacs A, van Duijn CM (2007) GenABEL: an R library for genome-wide association analysis. Bioinformatics 23: 1294–1296.
37. Price AL, Patterson NJ, Plenge RM, Weinblatt ME, Shadick NA, et al. (2006) Principal component analysis corrects for stratification in genome-wide association studies. Nat Genet 38: 904–909.