Accurate Encoding and Decoding by Single
Cells: Amplitude Versus Frequency
Modulation
Gabriele Micali1,2,3, Gerardo Aquino1,2, David M. Richards1,2, Robert G. Endres1,2*
1Department of Life Sciences, Imperial College, London, United Kingdom,2Centre for Integrative Systems Biology and Bioinformatics, Imperial College, London, United Kingdom,3Dipartimento di Fisica, Università degli Studi di Milano, Milano, Italy
Abstract
Cells sense external concentrations and, via biochemical signaling, respond by regulating the expression of target proteins. Both in signaling networks and gene regulation there are two main mechanisms by which the concentration can be encoded internally: amplitude modulation (AM), where the absolute concentration of an internal signaling molecule en-codes the stimulus, and frequency modulation (FM), where the period between successive bursts represents the stimulus. Although both mechanisms have been observed in biologi-cal systems, the question of when it is beneficial for cells to use either AM or FM is largely unanswered. Here, we first consider a simple model for a single receptor (or ion channel), which can either signal continuously whenever a ligand is bound, or produce a burst in sig-naling molecule upon receptor binding. We find that bursty sigsig-naling is more accurate than continuous signaling only for sufficiently fast dynamics. This suggests that modulation based on bursts may be more common in signaling networks than in gene regulation. We then extend our model to multiple receptors, where continuous and bursty signaling are equivalent to AM and FM respectively, finding that AM is always more accurate. This implies that the reason some cells use FM is related to factors other than accuracy, such as the ability to coordinate expression of multiple genes or to implement threshold crossing mechanisms.
Author Summary
Signals, and hence information, can generally be transmitted either by amplitude (AM) or frequency (FM) modulation, as used, for example, in the transmission of radio waves since the 1930s. Both types of modulation are known to play a role in biology with AM conven-tionally associated with signaling and gene expression, and FM used to reliably transmit electrical signals over large distances between neurons. Surprisingly, FM was recently also observed in gene regulation, making their roles less distinct than previously thought. Al-though the engineering advantages and disadvantages of AM and FM are well understood, a11111
OPEN ACCESS
Citation:Micali G, Aquino G, Richards DM, Endres RG (2015) Accurate Encoding and Decoding by Single Cells: Amplitude Versus Frequency Modulation. PLoS Comput Biol 11(6): e1004222. doi:10.1371/journal.pcbi.1004222
Editor:Jorg Stelling, ETH Zurich, SWITZERLAND
Received:September 16, 2014
Accepted:March 3, 2015
Published:June 1, 2015
Copyright:© 2015 Micali et al. This is an open access article distributed under the terms of the
Creative Commons Attribution License, which permits unrestricted use, distribution, and reproduction in any medium, provided the original author and source are credited.
Data Availability Statement:All relevant data are within the paper and its Supporting Information files.
Funding:GM acknowledges funding from ERC Starting-Grant N. 280492-PPHPI. GA was supported by Leverhulme-Trust grant N. RPG-181, and DMR was supported by BBSRC grant N. BB/I019987/1. RGE was supported by all three. The funders had no role in study design, data collection and analysis, decision to publish, or preparation of the manuscript.
the equivalent question in biological systems is still largely unsolved. Here, we propose a simple model of signaling by receptors (or ion channels) with subsequent gene regulation, thus implementing both AM and FM in different types of biological pathways. We then compare the accuracy in the production of target proteins. We find that FM can be more accurate than AM only for a single receptor with fast signaling, whereas AM is more accu-rate in slow gene regulation and with signaling by multiple receptors. Finally, we propose possible reasons that cells use FM despite the potential decrease in accuracy.
Introduction
Cells are exposed to changing environmental conditions and need to respond to external sti-muli with high accuracy, e.g. to utilize nutrients and to avoid lethal stresses [1,2]. To represent (encode) chemicals in the environment, either ligand-bound receptors trigger chemical signals or ion channels allow entry of secondary messengers. These in turn activate transcription fac-tors (TFs), which then regulate target-protein production (decoding). In eukaryotic cells, the conventional view is that the level of signaling within the cell directly encodes the external sti-muli, with consequent gradual changes in the nuclear TF concentrations. This is effectively an amplitude modulation (AM) mechanism [3–10]. However, recent single-cell experiments also show pulsating signals [3,11–14] and bursty entry of TFs into the nucleus [3,10,15–17], in close analogy to frequency modulation (FM). (Note that, although there is no modulation of an underlying carrier wave as in radio broadcasting [18], the AM/FM terminology is commonly used in quantitative biology [10,15].) Although several hypotheses have been put forward, the benefits and detrimental effects of either type of response remain largely unclear.
There is experimental evidence that both types of modulation occur in gene regulation. For example, take the budding yeastSaccharomyces cerevisiae. Under oxidative stress the nuclear concentration of transcription factor Msn2 is proportional to the H2O2concentration, suggest-ing an AM mechanism (Fig1Aand1B) [10]. However, in response to a calcium stimulus, Crz1, which is normally cytoplasmic, enters the nucleus in unsynchronized bursts, regulating at least a hundred target genes (Fig 1C) [15]. The level of stimulus affects only the frequency of bursts, not their amplitude and duration, which implies FM (Fig 1Dand inset) [15,19]. Simi-larly, Msn2 and its homologue Msn4 exhibit FM under glucose limitation [10]. Bursty FM is also found in bacteria and mammals, indicating that this is a general modulation scheme across different cell types. For example, during energy-depletion stress, the bacteriumBacillus subtilis activates the alternative sigma factorσBin discrete stochastic pulses, regulating around 150 downstream genes [20]. In addition, isoform NFAT4 in activated T-cells shows similar behav-ior [21].
multiple genes need to be up or down regulated, FM can provide greater coordination and reli-ability (Fig2Cand2D) [15,19].
Mora and Wingreen considered a model for a single receptor embedded in a cell membrane and compared the noise in the output for two signaling mechanisms: continuous (CM) and bursty (BM) modulation [23]. In CM, the receptor signals continuously whenever a ligand is bound, whereas in BM the receptor signals for a short, fixed-sized burst only upon binding of a ligand. As we explain below, for multiple receptors these mechanisms become equivalent to
Fig 1. Experimental evidence for amplitude and frequency modulation.(A and B) Example data showing amplitude modulation from [10]. (A) Single-cell nuclear localization of Msn2 transcription factor in response to H2O2stress as a function of time. The stimulus profile (input) is a step change applied att= 0 (inset) which applies to all figure panels. (B) Average time trace for different concentrations of H2O2stress. (C and D) Example data showing frequency modulation from [15]. (C) Single-cell nuclear localization of Crz1 in response to calcium stress as a function of time, showing bursts of Crz1. (D) The average frequency of bursts against calcium concentration, showing an increased frequency with increased concentration. (Inset) Burst duration distribution for low (blue bars) and high (red bars) concentration. Both histograms are well described by the Gamma distributionhðtÞ ¼tet=tb, withτ
b= 70s (black solid line), demonstrating that pulse duration is independent of calcium concentration. Experimental data in arbitrary units (AU) of fluorescence.
AM and FM, respectively. By considering integral feedback control, a common network for sensing concentration ramps and precise adaptation [25–27], it was found that, for fast binding and unbinding, the noise in CM can be twice that from BM, suggesting that FM leads to greater accuracy. Despite this unexpected result, there are two key points that need further clarifica-tion. First, the response was only calculated to lowest order in the small-ramp parameter, thus neglecting any time dependence of the noise. Second, the derivation solely relied on the small-noise approximation, which might work well for fast signaling, but could be inadequate for slow gene regulation.
Similarly, Tostevinet al. found biologically relevant parameter regimes of promoter switch-ing in gene regulation in which an oscillatswitch-ing input can produce a more constant and hence
Fig 2. Advantages and disadvantages of amplitude and frequency modulation.AM may be less noisy than FM (A,B), but FM may allow coordinated expression of many genes (C,D) [15,19]. (A) In AM, low/high stimuli result in low/high levels of transcription factor (TF) inside the nucleus. (B) In AM, different nuclear TF concentrations (blue and red curves) lead to gene expression of proteins A and B (see orange and green promoter functions respectively) with variable ratios (order of dot and square changes). (C) In FM, the stimulus strength only affects the frequency of bursts, not their amplitude. (Inset) Schematic of TF (purple dots) binding promoterPAof geneA(orange) and promoterPBof geneB(green) with different binding strengths. (D) In FM, the nuclear TF concentration is always the same during a burst, only the frequency of occurrence changes. As a consequence, the protein ratio stays constant.
less noisy protein output level than a constant input with noise [24]. Although interesting, this model is restricted to decoding and linear pathways, and requires fine-tuning. Its general appli-cability remains unclear, such as whether an oscillatory input signal can be replaced by random bursts and still remain more accurate than a constant input. In fact, oscillating signals are well-known to maximize target responsiveness while bypassing desensitization from constant sig-nals [28]. They also globally entrain with its period robust to noise [29]. Such oscillators are found in circadian clocks, segmentation clocks, cell cycle, p53 DNA repair pathways, as well as nuclear factor NF-κB, epidermal growth factor ERK, cAMP and Ca2+signaling [17,30–39]. This leaves the question of the relative benefits of AM and FM (with respect to random bursts) largely unanswered.
Here, we aim to investigate the advantages and disadvantages of CM and BM (AM and FM) for encoding and decoding of constant concentrations and ramps. To build intuition, we start with a single receptor/ion channel (CM and BM). We consider concentration sensing by a line-ar pathway, allowing us to gain exact results for different temporal regimes (as suitable for fast signaling and slow gene regulation). To provide analytical results, we extend the single-receptor model for ramp sensing by Mora and Wingreen. First, we introduce an alternative mechanism to integral feedback, the incoherent feedforward loop (another common pathway motif for ramp sensing and precise adaptation [40–42]). This allows us to generalize the model to more than one pathway. Second, by explicitly including the time-dependence of signaling noise, we are able to provide first-order analytical results for the accuracy of ramp sensing. Taken togeth-er, a general principle emerges, favoring BM for fast signaling and CM for slow gene regulation. Finally, we generalize to many receptors and ion channels, a far more realistic situation for bio-logical systems, allowing us to make connection with AM and FM. While we found that AM is generally more accurate than FM, we speculate why cells may still utilize FM in certain cases of gene regulation.
Results
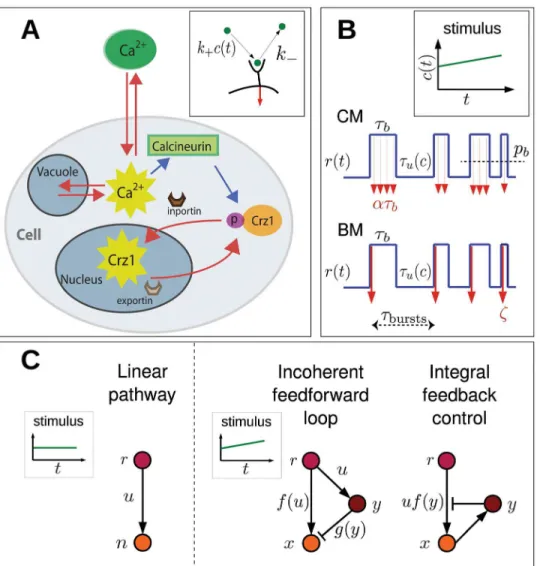
Cells sense external stimuli with cell-surface receptors and/or ion channels, which ultimately lead to changes in the concentration and dynamics of active transcription factors (TFs) inside the nu-cleus. Cells control the response at two different levels. Firstly, cell-surface receptors signal to reg-ulate the activity of TFs in the cytoplasm. Secondly, inportin and exportin regreg-ulate the entry of active TFs into the nucleus, thereby regulating transcription (Fig 3A). Here, we build a theoretical model that encodes information from an extra-cellular environment in an intra-cellular repre-sentation. We distinguish two ways of encoding this information: continuous modulation (CM) and bursty modulation (BM). Once the information is encoded, various proteins can act together to implement a response (decoding), involving regulatory networks. To provide a general analysis for arbitrary noise we first address concentration sensing in a simple linear pathway using the master equation. However, to derive analytical results for ramp sensing and pathways with feed-back we apply the small-noise approximation. We finally extend these models to implement am-plitude (AM) and frequency modulation (FM) for many receptors or ion channels. Accuracy is assessed by comparing the protein output noise for the different modulation schemes, assuming that the signal is decoded by the average concentration.
Single-receptor/ion-channel model
receptor only once, the receptor can be in either of two uncorrelated states:onwhen bound andoffwhen unbound. This allows the receptor activity,r(t), to be written mathematically as a binary response, which takes value 1 in theonstate and 0 in theoffstate. The extra-cellular concentrationcaffects the unbound time intervalsτu, such that the binding rate is given by
hτui−1=k+c(t), wherek+is the binding rate constant. In contrast, the bound time intervals,τb,
are exponentially distributed random numbers with averagehτbi−1=k−, wherek−is the
un-binding rate constant, which is independent of the extra-cellular stimulus concentration (inset
Fig 3. Schematic view of signaling and gene regulation.(A) Cartoon ofS. cerevisiaein presence of extracellular calcium, considered a paradigm of bursty frequency modulation. Calcium enters through plasma-membrane ion channels and can be stored (released) in (from) vacuoles. Intracellular calcium activates calcineurin, which dephosphorylates Crz1p. Once dephosphorylated, Crz1 binds inporting Nmd5p and enters the nucleus. Exportin Msn5p subsequently removes Crz1 from the nucleus. Cytoplasmic calcium pulses may correspond to Crz1 bursts in the nucleus [15]. Red arrows indicate movement while blue arrows stand for chemical signaling. (B) Single receptor/ion channel activity,r(t) (blue line), depends on the concentration of extra-cellular stimulusc. The signaling rateudiffers between continuous (CM) and bursty modulation (BM). In CM,uis constant rateαduring bound intervals, withpbthe probability of being bound. In BM,ζmolecules are realized at the time of binding withτburststhe duration between consecutive bursts (binding events). (C) Different regulatory networks. Linear pathway used for concentration sensing. Incoherent feedforward loop and integral feedback control allow chemical ramps to be sensed.
inFig 3A). As for ion channels, some are ligand-gated or regulated by receptors, while others are voltage-gated and hence dependent on action potentials [43]. In all these cases the stimulus affects the opening or closing times. In CM downstream proteins are produced with a constant rateαduring eachontime interval, which leads to a signaling rateuCM=αr(t), while in BM z¼ak1
molecules are produced instantly at the moment of binding with rate
uBM¼z
P
dðttþ
i Þ, wheret
þ
i are the binding times (Fig 3B). This choice forzallows a
mean-ingful comparison of CM and BM as both produce, on average, the same amount of intracellular species.
General approach to concentration sensing exhibits two regimes of
accuracy
In order to provide a general result for arbitrary input fluctuations, we write down the chemical master equation. For simplicity, we only consider concentration sensing withc(t) =c0, but the model can also be applied to ramps. Furthermore, we assume a linear pathway in which the re-ceptor/ion channel activityrdirectly regulates an output species with copy numbern(with production rateuand degradation rateγ) (Fig 3C, left). Since the receptor/ion channel activity is a two-state system (on/off), there are two resulting master equations for CM (one for each state) describing the probability of being in theonandoffstates, i.e.pon(n,t) andpoff(n,t):
dponðn;tÞ
dt ¼gðnþ1Þponðnþ1;tÞ þaponðn1;tÞ þkþcpoffðn;tÞ ðgnþaþkÞponðn;tÞ; ð1aÞ
dpoffðn;tÞ
dt ¼gðnþ1Þpoffðnþ1;tÞ þkponðn;tÞ ðgnþkþcÞpoffðn;tÞ: ð1bÞ
Note thatαk−, so molecules are generally produced in theonstate. In BM, instead, the
mas-ter equations which describe the probabilitiespon(n,t) andpoff(n,t) of havingnproteins at
timet, are given respectively by
dponðn;tÞ
dt ¼gðnþ1Þponðnþ1;tÞ þkþcpoffðnz;tÞ ðgnþkÞponðn;tÞ; ð2aÞ
dpoffðn;tÞ
dt ¼gðnþ1Þpoffðnþ1;tÞ þkponðn;tÞ ðgnþkþcÞpoffðn;tÞ; ð2bÞ
with burst sizeza positive integer. We solve Eqs (1a) and (1b) with generating functions and simulate Eqs (2a) and (2b) with the Gillespie algorithm (seeMaterials and Methods).
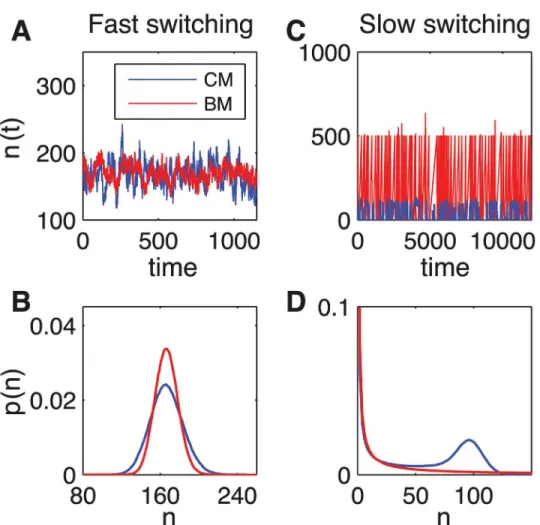
Simulations via the Gillespie algorithm show different outcomes for fast (small-noise ap-proximation limit, Fig4Aand4B) and slow (Fig4Cand4D) dynamics of the receptor. For fast switching (k+c0,k−γ), for both CM and BM, the probability has an unimodal distribution
(Fig 4B). On the other hand, in the slow switching regime (k+c,k−γ), the probability
distri-bution becomes bimodal for CM and unimodal with a long tail for BM, leading to drastically increased noise (Fig 4D). The unimodal distribution for BM, which is simply due to the use of infinitely short pulses, would become bimodal for finite width pulses.
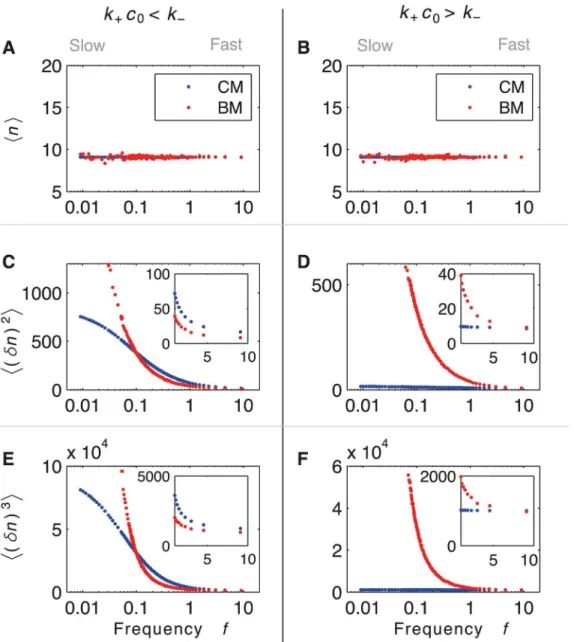
In order to classify the different dynamics and to compare CM and BM for arbitrary noise, we require information on the probability distribution ofnoutput proteins. In particular, we study the average, variance and skewness (the latter is encoded in the third moment) of the dis-tribution for both CM and BM. Constraining the average output of CM and BM to be the same (Fig5Aand5B), we identify two regimes for fast dynamics:k+c0<k−(Fig 5C) andk+c0>k−
more accurate whenk+c0>k−(Fig 5D, inset), except for minimal burst size (z= 1). However,
for slow dynamics (and hence large noise), CM is always more accurate than BM. The study of the third moment shows that, for slow switching and hence bimodality, BM has large asymme-try (Fig5Eand5F).
These observations can be explained as follows, using the fact that the receptor/ion channel can only detect information from the extra-cellular environment during unbound (off) time in-tervals, as the extra-cellular stimulus only affects the binding rate (Fig 3). For fast dynamics, the two regimes can be understood by comparison with maximum-likelihood estimation (MLE), the most accurate strategy for encoding [44]. MLE estimates the ligand concentration cML¼k
1
þhtui
1
from the average unbound time intervalhτui. The bound time intervals are
dis-carded as they only contribute noise [44]. BM, which produces fixed-size bursts at the times of binding, approaches MLE when the bound intervals are shorter than the unbound intervals. In
Fig 4. The two regimes in the linear pathway model based on the master equation.(A-B) fast (k+c0= 20s−1,k
−= 100s −1,
γ= 0.1s−1,
α= 100s−1,ζ= 1) and (C-D) slow (k
+c0= 0.01s−1,k−= 0.05s −1,
γ= 1s−1,
α=
25s−1,ζ= 500) switching. (A,C) Protein number as a function of time from Gillespie simulations for CM (blue lines) and BM (red lines). (B) The probability distribution forntarget proteins is unimodal for both AM (blue) and FM (red). (D) The probability distribution is bimodal for AM (blue) and remains unimodal for BM (red) but with a long tail in the slow switching regime.
this case, the times of the bursts effectively estimate the unbound time intervals (Fig 3B, bot-tom) and BM is more accurate than CM. However, when the bound intervals are longer than the unbound intervals, BM cannot estimate the unbound time intervals anymore and becomes less accurate than CM. Since CM produces protein during the bound intervals, it signals ac-cording to the average receptor activitypb=hτbi/(hτbi+hτui) (Fig 3B, top). Hence, CM
effec-tively contains information on both bound and unbound intervals, and thus can still provide a
Fig 5. First three moments of the protein distribution in concentration sensing from the master equation.Averages (A,B), variance (C,D), and skewness (E,F) as a function of the frequency of binding events,f=k+c0/(1+k+c0/k−). (Insets) Magnification of small-noise approximation region (fast switching). Analytical results for CM (blue) and numerical results for BM (red) as function of the frequency of binding events (logarithmic scale). Two regimes are shown:k−= 10k+c0(α= 100s
−1,γ= 1s−1,ζfrom 1000 to 1) (left column) andk
−= 0.1k+c0(α= 10s
−1,γ= 1s−1,ζfrom 1000 to 1) (right column). Averages from CM and BM are constrained to be equal,i.e.ζ¼ak1
. Variances of CM and BM exhibit two different regimes for fast switching: fork+c0<k−BM is more accurate than CM (inset in C), while fork+c0>k−CM is generally more accurate (inset in D), except forζ= 1. Third moments show that, for large noise, the probability distributions become asymmetric.
reasonable estimate of unbound time intervals. An interesting exception isak1
¼z¼1, for which BM becomes slightly more accurate than CM. In the latter case, since the rate of protein production during a bound interval in CM is very low, there is uncertainty as to whether CM actually produces protein or not, which reduces its accuracy. In contrast, for slow switching the burst size needs to increase since BM produces the same level of protein as CM. Hence, BM is always less accurate than CM, independent of whether bound or unbound time intervals are longer. While we analytically demonstrate the connection with MLE for fast dynamics in the next section, an extended discussion without comparison to MLE can be found inS1 Textand S1–S3Figs.
Small-noise approximation to ramp sensing confirms two regimes for
fast dynamics
To further investigate fast dynamics, we extend an analytical model for ramp sensing in the small-noise approximation [23]. Considering the single-receptor described in Fig3Aand3B, we linearize the system by averaging over a time much larger than the binding and unbinding times. We further assume exponential distributions forτbandτuso thathðdtbÞ
2
i ¼ htbi2¼k2
andh(δτu)2i=hτui2= (k+c(t))−2, wherec(t) increases only very slowly with time (see below). Hence, signaling noise arises in CM due to variable bound time intervals (ignoring stochastic production of protein during bound intervals), while in BM the binding times (bursting times) vary. Without loss of generality, we setα=k−, which is equivalent toz= 1. Hence, as we show
inS1 Text, for averaging time much longer thank1
and (k+c(t))−1, the average and autocorre-lation (variance) ofu(t) are given by [23]
huðtÞi ¼ kþcðtÞ
1þkþcðtÞ=k; ð3Þ
hduðtÞduðt0Þi ¼g kþcðtÞ
ð1þk
þcðtÞ=kÞ
3 dðtt
0Þ;
ð4Þ
withhδu(t)i= 0 and
g¼
(1þ hðdt bÞ
2
i=htbi2 ¼2 CM
1þ hðdt bÞ
2
i=hðdtuÞ2i ¼1þ ½k
þcðtÞ=k
2
BM:
ð5Þ
Note that only the variance differs between CM and BM. In particular, inEq (5)the ratiok+c (t)/k−determines whethergis larger in BM or CM, which ultimately determines which scheme
leads to the least noise. BM has the lower noise only whenk+c(t)<k−,i.e.whenhτbi<hτui. In
particular, in the limit of fast unbinding (k+c(t)k−), the signaling noise for CM is twice as
large as for BM.
Sensing temporal ramps,i.e.the change of concentration with time, is crucial for locating nutrients and avoiding toxins. We start by considering a stimulus whose concentration is con-stant fort<0 and increases linearly and slowly in time aftert= 0:
cðtÞ ¼
(c
0 t<0
c0þc1t t0;
for constantsc0andc1withc1tc0. By applyingEq (6)to Eqs (3–5), the signaling rate can be rewritten tofirst order as
uðtÞ ’
(u
0þu1tþdu t0
u0þdu t<0;
ð7Þ
whereu0,u1are functions ofc0andc1, andδuis the noise described byhδu(t)δu(t0)i(given in S1 Text). The conditionc1tc0is necessary so thatubehaves linearly in time withu1tu0. Under this condition, the factorgBMofEq (5)becomes
gBM’1þ
k2
þc
2 0 k2
|fflfflfflffl{zfflfflfflffl} gBM
þ2k 2
þc0c1 k2
t;
ð8Þ
wheregBMis given bygBMfor a constant external concentration. We now assume that the extra-cellular stimulus is encoded in the signaling rateuwhich affects the production of two output proteins with concentrationsxandy. Specifically, we compare the output noise ofxand ybetween CM and BM using the incoherent feedforward (Fig 3C, middle) and integral feed-back (Fig 3C, right) loops.
Incoherent feedforward loop. The incoherent feedforward loop is a network motif in whichudirectly affects two outputsxandy, whileyinhibitsx(Fig 3C, middle). The loop pro-vides precise adaptation to a step-change in stimulus and can also be used for ramp sensing. Mathematically, we use the following two coupled stochastic differential equations,
dx
dt ¼kx
fðuÞ gðyÞx
; ð9Þ
dy
dt ¼ukyy; ð10Þ
wherekxis the rate constant for production and degradation ofx, whilekyis the rate constant
for degradation ofy, andf(u) andg(y) are specified functions. In order to have adaptation the variableyneeds to evolve slower thanx, which requireskx>ky. Here we choosef(u) =ebuand
g(y) =ebkyy, where constantbhas units of time. This allows us to obtain an analytic solution (seeS1 Textfor details).
Integral feedback loop. The integral feedback loop [23] is another network motif for pre-cise adaptation and ramp sensing. Here,uaffectsxonly (the main output), whilexactivatesy andyinhibitsx(Fig 3C, right). The general equations for this model are given by
dx
dt ¼ufðyÞ kxx; ð11Þ
dy
dt ¼kyðx1Þ; ð12Þ
wherekxis the rate constant for degradation ofx,kyis the rate constant for production and
degradation ofysatisfyingkx>ky, andf(y) is a monotonically decreasing function ofy. Specifi
-cally, we choosef(y) =e−by, wherebis a dimensionless constant. This again produces an analyt-ic solution (seeS1 Textfor details).
equations within the small-noise approximation, and assume that we are in the fast-switching regime. This allows us to find analytic solutions in a particular time window and under certain conditions which we define inS1 Text. Specifically, for the incoherent feedforward loop in the small-ramp regime, the average values ofhu(t)i,hx(t)iandhy(t)iare determined by the differ-ential equations Eqs (9and10). Although there are no steady states for ramps,hx(t)iandhy(t)i show time-dependent stable solutions
hxðtÞi ¼e bu1
ky ; ð13aÞ
hyðtÞi ¼u0 ky
u1 k2
y
þu1t ky
: ð13bÞ
Introducingx=hxi+δxandy=hyi+δyinto Eqs (9) and (10) with subsequent linearization the variance of the target-protein copy numbers can be derived (seeMaterials and Methods). Tofirst order in small-ramp parameters the variances ofxfor both types of modulation are
hðdxðtÞÞ2
iCM¼D gCMu0
12c0kþ=k
kxþky
u1þgCMð12kþc0=kÞu1t
" #
; ð14aÞ
hðdxðtÞÞ2
iBM¼D g
BMu0
12c
0kþ=kþ3c
2 0k
2
þ=k
2
2k y
u1þ 12kþc0=kþ3k
2
þc
2 0=k
2
u1t
" #
;ð14bÞ
whereD¼ b2k2xe 2bu1
ky
2ðkxþkyÞð1þkþc0=kÞ
2, andgCMandgBM are parameters discussed in Eqs (5) and (8). The
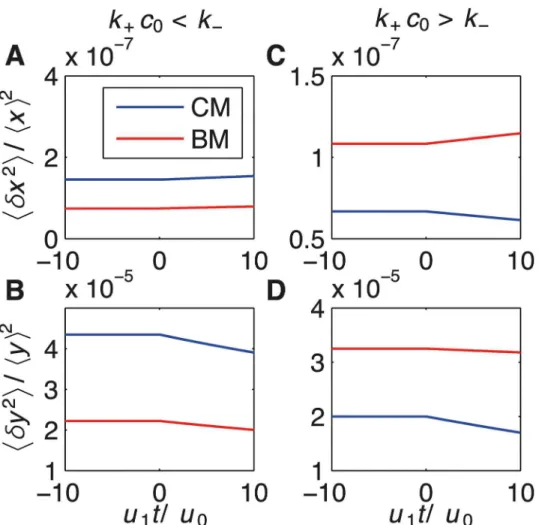
corresponding results for speciesyare provided in Eqs. (S56) and (S58), and plots for speciesx andyare shown in Fig6Band6D.
Consistent with the master equation, these results show again two regimes: ramp sensing is more accurate for BM ifk+c0<k−, while CM is more accurate otherwise. For a constant
envi-ronment (zeroth-order withc1=u1= 0) the regime is largely determined by the factorg. Ifk+ c0<k−,gBM= 1+h(δτb)
2i/hδ(
τu)2i<2 (seeEq (5)), and BM is more accurate than CM with
gCM= 1+h(δτb)2i/hτbi2= 2 (Fig6Aand6B). This is because the variability of the bound
inter-valsh(δτb)2ican be eliminated in BM (but not in CM), and the unbound intervals are well
ap-proximated by the duration between bursts (τburstsinFig 3). Fork+c0k−, BM effectively
implements MLE. In contrast, CM is more accurate fork+c0>k−, wheregCM= 2 andgBM>2
(Fig6Cand6D). This is because BM contains no information on unbound time intervals, while CM still contains some information through the probability of being bound (pbinFig
3B). These results also apply to ramp sensing since the accuracy of the downstream proteins (decoding) relates again to the factorgand hence to the ratio between the bound and unbound time intervals. The integral feedback loop in Eqs (11) and (12) shows very similar behavior (provided inS1 Text). The validity of our analytical results are confirmed by simulations of the stochastic differential equation for both pathways inS4andS5Figs.
AM is more accurate than FM for multiple receptors/ion channels
contrast, the experimentally observed sporadic bursts of nuclear translocation [10,23] and hence FM might be explained by synchronized receptors that individually operate with BM.
ForNunsynchronized (us) receptors, the resulting average and variance of the signaling rate arehuðtÞiusN ¼NhuðtÞi1andhduðtÞduðt0Þius
N ¼NhduðtÞduðt
0Þi1in terms of the
single-re-ceptor quantities. Consequently, the relative variance, given by the variance divided by the av-erage-squared, scales with the inverse of the number of receptors (N). On the other hand, forN synchronized (s) receptors, the average and variance of the signaling rate are given respectively byhuðtÞisN ¼NhuðtÞi1andhduðtÞduðt0Þis
N ¼N
2
hduðtÞduðt0Þi1. The relative variance is now in-dependent ofN. Hence, unsynchronized receptors (AM) have a reduction of noise by a factor Ncompared to synchronized receptors (FM).
For slow dynamics, or fast dynamics withk+c>k−, CM is generally more accurate than
BM (at least forz>1), and withNreceptors, AM is more accurate than FM by an even larger margin. In contrast, for fast dynamics withk+c<k−, BM is more accurate than CM by at most Fig 6. Two regimes in incoherent feedforward loop based on the small-noise approximation.Output noise,i.e.relative variance ofx(top) andy(bottom), as function of the non-dimensional ramp timeu1t/u0for
k+c0<k−i.e.hτbi<hτui(left) andk+c0>k−i.e.hτbi>hτui(right). CM and BM are shown by blue and red lines respectively. (A,B) BM is more accurate than AM fork+c0= 107s−1andk−= 6.7 × 10
7s−1. (C,D) CM is more accurate then BM fork+c0= 107s−1andk−= 6.7 × 10
6s−1. Remaining parameters:k
+c1= 105s−2,kx= 5s−1 andky= 10s−1.
a factor of 2 (Eq (5)). But since AM isNtimes more accurate than CM, AM becomes more ac-curate for encoding than FM for more than two receptors. Since our results from the previous sections show that larger signaling noise leads to larger output noise, the same rule emerges for decoding.
From a physical point of view, how can receptors act in a synchronized fashion? Receptors may be coupled by adaptor proteins or elastic membrane deformations, allowing them to act cooperatively [45,46]. In conclusion, while for fast dynamics (small-noise approximation) BM can be more accurate than CM up to a factor of two, two receptors/ion channels are sufficient for AM to become more accurate than FM. Since cells have thousands of receptors and ion channels, AM becomes the most accurate modulation scheme.
Discussion
Cellular responses to extra-cellular stimuli involve both encoding the external stimuli by inter-nal siginter-nals (which is normally fast) and subsequently decoding via the regulation of protein lev-els (which is normally much slower). The internal representation of the external signal falls into two broad categories: continuous/amplitude modulation (CM/AM), where bound recep-tors continually signal and the internal concentration itself encodes the external signal, and bursty/frequency modulation (BM/FM), where receptors only signal when first bound and the signal is encoded in the frequency of peaks. Here, we compared the output noise for both types of modulation in the presence of a constant and a linearly increasing (in time) external concen-tration. Besides considering a linear pathway, we compared two nonlinear network motifs: the incoherent feedforward loop and the integral feedback loop. These loops are ubiquitous in bio-logical systems. For example, the incoherent feedforward loop is found in chemotactic adapta-tion of eukaryotes [40] and transcription networks in bacteria [41], and the integral feedback loop is found in chemotactic adaptation of bacteria [25,47] and in eukaryotic olfactory and phototransduction pathways [27].
We found that, for a single receptor or ion channel, BM can be more accurate than CM for fast dynamics. This situation can occur when the average duration of the activeonstate is shorter than the average duration of the inactiveoffstate (Figs5and6). In this case, BM effec-tively implements maximum-likelihood estimation, the most accurate mechanism of sensing [44]. If instead more time is spent in theonstate, then CM is generally more accurate (except when the burst size is minimal, i.e one). The reason behind this effect, which we analytically prove within the small-noise approximation, is that CM has information about both theon andoffstates, whereas BM only knows when a switch fromofftoonoccurs. As such, CM effec-tively implements Berg and Purcell’s classic result of estimating ligand concentration by time averaging [48] (see alsoDiscussionin [44]). In addition, we found that for slow dynamics CM is always more accurate than BM, independent of whether more time is spent in theonoroff states, due to increased burst sizes (Fig 5). Taken together our results suggest that BM should be more common in signaling pathways than in gene regulation.
genes are controlled by a single transcription factor, such as during stress response [49–51]. Secondly, FM can enhance co-localization of proteins inside the nucleus, providing another way to improve coordination of gene expression [52]. Thirdly, as with oscillatory signals, bursts can be used to activate transcription by threshold crossing [32] while avoiding desensitization [28]. This may then push the cell to differentiate into a new state (such as under starvation to initiate competence) [53,54]. It is also worth noting that by using seemingly redundant iso-forms (such as NFAT1 and NFAT4 during an immune response), AM and FM can be com-bined to enhance temporal information processing [21].
While providing intuitive insights, it is clear that our models are highly oversimplified ver-sions of signaling and gene regulation in actual cells. One of the main reasons for this is that we used idealized delta-functions as pulses in BM (and hence in FM). However, for example, in the calcium stress-response pathway inSaccharomyces cerevisiae(Fig 3A) nuclear bursts of Crz1p are on average two minutes long (Fig 1D, inset). Most likely cytoplasmic calcium spikes determine the nuclear bursts (Elowitz, personal communication), but since the mechanism of calcium spiking remains poorly understood, such bursts are difficult to model. A further limita-tion of our models is that bursts only relate to translocalimita-tion, whereas addilimita-tional bursts may occur further downstream during transcription [55] (e.g. due to promoter switching [24]) and translation [56]. Future models may need to include these details.
Our models suggest further experimental investigation in multiple areas. Firstly, the distri-bution of burst duration affects factorg(Eq (5)), so thatg= 2 in equilibrium for a single-step process and potentiallyg<2 for an irreversible binding cycle dominated by energy dissipation [23,57]. These irreversible cycles are present in some ligand-gated ion channels, such as the cystic fibrosis transmembrane conductance regulator (CFTR) channels and N-Methyl-D-as-partate (NMDA) receptors. These exhibit peaked opening distributions, which can be inter-preted as evidence of broken reversibility and energy consumption [58,59]. Such cases and their possible connection with accuracy need further investigation. In fact, most cellular pro-cesses rely heavily on energy consumption, including nuclear shuttling and chromosome re-modeling, limiting the applicability of our equilibrium CM-receptor model. Secondly,
coordination of gene expression during stress or cell-fate decisions might be another reason for implementing FM rather than AM. More quantitative experiments are needed to better under-stand this mechanism. Thirdly, closer inspection of Ca2+-independent transcription factors (as well as Ca2+-dependent co-regulated genes) are warranted in order to verify coordination of multiple genes [15]. Finally, to see if bursts help jump start new cellular programs (i.e. transi-tion into a new“attractor”), global changes in gene regulation can be monitored.
A general understanding of FM may help prevent developmental defects and human dis-eases. Indeed, several biomedically relevant transcription factors, such as NF-κB, p53, NFAT and ERK, show oscillatory pulsing or random bursting [16,17,33–36,54]. In fact, the destabili-zation of regulatory circuits can underlie human diseases: studies suggest that the coordination of gene expression could be critical in maintaining the proper functioning of key nodes in such circuits. For example, the NFATc circuit is cooperatively destabilized by a 1.5-fold increase in the DSCR1 and DYRK1A genes, which reduce NFATc activity leading to characteristics of Down’s syndrome [16,60]. However, ERK pulses are regulated by both AM and FM with the same dose dependence, and it remains unclear how they affect cell proliferation and the rele-vance to cancer [36].
global understanding of cells. We believe that future work that combines single-cell experi-ments with ideas of collective behavior and engineering principles is most likely to
be successful.
Materials and Methods
Master-equation model for concentration sensing
The master equations for continuous modulation (CM), Eqs (1a) and (1b), can be solved at steady state using generating functions. In particular, we derive the first three moments of the probability distribution using the general model in [62]. When the system is in theon/offstate, the production rate of speciesxisαon/off. The degradation rateγis independent of the state of
the system. The probability distribution ofntarget proteins at timetis then described by
dpsðn;tÞ
dt ¼gðnþ1Þpsðnþ1;tÞ þaspsðn1;tÞ þkspsðn;tÞ ðgnþasþksÞpsðn;tÞ; ð15Þ
wheres¼offðonÞwhens= on (off). By defining the generating functions
GsðzÞ ¼ X1
n¼0 psðnÞz
n; ð
16Þ
and usingEq (15), a solution forGs(z) can be found, which then readily gives the moments ofp
(n,t). In particular, the variance and skewness are given by
hdn2i ¼X
s
ð@zz@zGsðzÞÞjz¼1 hni 2
; ð17Þ
hn3i ¼X
s
½@zz@zz@zGsðzÞjz¼1: ð18Þ
Full details are given inS1 Text.
In order to solve the master equation for bursty modulation (BM), Eqs (2a) and (2b), we use the Gillespie algorithm [63]. If the system is in theonstate withnproteins at timet, it can ei-ther switch to theoffstate with transition rate given byk−/(k−+γn) or else remain in theon
state and lose a protein by degradation. If instead the system is in theoffstate withnproteins at timet, it can either switch to theonstate with switching ratek+c0/(k+c0+γn) and, via a burst, increase its number of proteins ton+z, or again remain in the same state and loose a protein by degradation. The time step between reactions,δt, is chosen from an exponential probability distributionλe−λδt, withλequal to the total rate that at least one reaction occurs.
ODE models for ramp sensing
The following method applies to both the incoherent feedforward and the integral feedback loop. To solve the ordinary differential Eqs (9–12) we linearize around stable solutions,x(t) = hx(t)i+δxandy(t) =hy(t)i+δy, and assume that smallδuleads to smallδxandδy. Note that when sensing a gradually changing ramp,hx(t)iandhy(t)iare not steady states. DefiningX= [x(t)y(t)]Twe can rewrite these equations as
dXðtÞ
dt þMXðtÞ ¼
w du
z du
" #
; ð19Þ
only available whenMis time-independent. As shown inS1 Text,Eq (19)can be solved and written as an integral, which can then be evaluated with, for example, Wolfram Mathematica 8.
Supporting Information
S1 Text. Details of analytical calculations.
(PDF)
S1 Fig. First three moments of the protein distribution in concentration sensing from the master equation.Averages (A,B), variance (C,D), and skewness (E,F) as a function of the fre-quency of binding events,f=k+c0/(1+k+c0/k−). (Insets) Magnification of small-noise
approxi-mation region (fast switching). Analytical results for CM (blue) and numerical results for BM (red) and intermediate modulation IM (green) as function of the frequency of binding events (logarithmic scale). Note that this figure is similar toFig 5in main text with the addition of IM. Two regimes are shown:k−= 10k+c0(α= 100s
−1,γ= 1s−1,zfrom 1000 to 1) (left column) and
k−= 0.1k+c0(α= 10s
−1,γ= 1s−1,zfrom 1000 to 1) (right column). Averages from CM, BM
and IM are constrained to be equal,i.e.z(BM)¼ak1
(CM) =α
0
τb(IM). Variances of CM,
BM and IM exhibit two different regimes for fast switching: fork+c0<k−BM is the most
accu-rate mechanism and CM the worst (inset in C) while fork+c0>k−CM is generally the most
accurate (except forz= 1) and IM the worst (inset in D). Third moments show that, for large noise, the probability distributions become asymmetric.
(EPS)
S2 Fig. Examples of time traces of receptor activity and protein copy numbers for different regimes.(Top) Regimek+c0<k−withk+c= 0.1k−(α= 100s
−1,γ= 1s−1). (Bottom) Regimek
+ c0>k−withk+c= 10k−(α= 10s
−1,γ= 1s−1). (Left) Slow switching withz= 400. (Right) Fast
switching withz= 7. Receptor activityrand protein copy numbersn(t) for CM, BM and IM are shown in black, blue, red and green, respectively.
(EPS)
S3 Fig. Investigating accuracy based on accumulative signaling (without protein produc-tion and degradaproduc-tion).(A) Regimek+c0<k−withk+c= 0.1k−(α= 100s
−1,γ= 1s−1andz=
7). (Left) ODE model. (Right) Stochastic protein production duringτbin CM and IM. (Top)
Examples of time traces. (Bottom) Histograms of number of proteins produced after 100s with standard deviation in legend based on 1000 simulations. (B) Analogous to (A) but for regime k+c>k−withk+c= 10k−(α= 100s
−1,γ= 1s−1andz= 7). CM, BM and IM are shown in blue,
red and green, respectively. (EPS)
S4 Fig. Incoherent feedforward loop: Comparison of analytical results with simulations of the stochastic differential equations.(A) Averages of signaling rateu(left), speciesyfrom Eq. (S42) (middle) and speciesxfrom (S41) (right) as a function of time. Analytic solutions Eqs. (S32), (S43) and (12) are shown for BM in red, while a (time averaged) time-trace from a stochastic simulation using the Euler method is shown in orange (CM is almost identical and hence is not shown). (B) Corresponding variances as a function of time fork+c0>k−(k−=
6.7 × 10⁵s−1,k
+c0= 106s−1). Analytic results are shown in blue for CM and in red for BM; av-erage over time (1s) from numerical simulations are shown in light blue for CM and in orange for BM. (C) Corresponding variances as a function of time fork+c0<k−(k−= 6.7 × 10
6s−1,k
+ c0= 106s−1). Colors same as in (B). Remaining parameters:k+c1= 104s−2,kx= 10s−1andky=
50s−1.
S5 Fig. Integral feedback loop: Comparison of analytical results with simulations of the sto-chastic differential equations.(A) Averages of signaling rateu(left), speciesyfrom Eq. (S60) (middle) and speciesxfrom (S59) (right) as a function of time. Analytic solutions Eqs. (S32), (S66) and (S65) are shown for BM in red, while a (time averaged) time-trace from a stochastic simulation using the Euler method is shown in orange (CM is almost identical and hence is not shown). (B) Corresponding variances as a function of time fork+c0>k−(k−= 6.7 × 10
5s−1,k
+ c0= 106s−1). Analytic results are shown in blue for CM and in red for BM; numerical simula-tions are shown in light blue for CM and in orange for BM. (C) Corresponding variances as a function of time fork+c0<k−(k−= 6.7 × 10
6s−1,k
+c0= 106s−1). Colors same as in (B). Re-maining parameters:k+c1= 104s−2,kx= 10s−1andky= 50s−1.
(EPS)
S6 Fig. From CM (BM) to AM (FM) for multiple receptors/ion channels.(A-D) Schematic of receptor activity in time. (A) AM emerges fromNunsynchronized receptors or ion channels in CM mode. (B)Nsynchronized CM receptors lead to a hybrid mechanism with information encoded in the frequency of broad bursts of variable duration. (C)Nunsynchronized BM re-ceptors provide a dense series of bursts. For largeN, bursts may start overlapping, leading to variable amplitudes. (D) FM emerges fromNsynchronized receptors in BM mode. (E) Relative variance for a system of 8 receptors withρNsynchronized and (1−ρ)Nunsynchronized
recep-tors, plotted for fast dynamics in thek+c<k−regime (CM in blue and BM in red). Letters
refer to panel labels (A-D). Dotted red line indicates uncertainty from FM for comparison. (Inset) Same for a system of two receptors only.
(PDF)
Acknowledgments
We thank Guido Tiana for helpful discussions, and Michael Elowitz for providing details on his data.
Author Contributions
Wrote the paper: GM GA DMR RGE. Designed the research: RGE. Performed the research: GM GA DMR.
References
1. Perkins TJ, Swain PS. Strategies for cellular decision-making. Mol Syst Biol. 2009 Nov; 5:326. doi:10. 1038/msb.2009.83PMID:19920811
2. Kussell E, Leibler S. Phenotypic diversity, population growth, and information in fluctuating environ-ments. Science. 2005 Sep; 309(5743):2075–2078. PMID:16123265
3. Behar M, Hoffmann A. Understanding the temporal codes of intra-cellular signals. Curr Opin Genet Dev. 2010 Dec; 20(6):684–693. doi:10.1016/j.gde.2010.09.007PMID:20956081
4. Black JW, Le P. Operational models of pharmacological agonism. Proc R Soc Lond B Biol Sci. 1983 Dec; 220(1219):141–162. PMID:6141562
5. Mackeigan JP, Murphy LO, Dimitri CA, Blenis J. Graded mitogen-activated protein kinase activity pre-cedes switch-like c-Fos induction in mammalian cells. Mol Cell Biol. 2005 Jun; 25(11):4676–4682. doi: 10.1128/MCB.25.11.4676-4682.2005PMID:15899869
6. Yu RC, Pesce CG, Colman-Lerner A, Lok L, Pincus D, Serra E, et al. Negative feedback that improves information transmission in yeast signalling. Nature. 2008 Dec; 456(7223):755–761. doi:10.1038/ nature07513PMID:19079053
7. Bosisio D, Marazzi I, Agresti A, Shimizu N, Bianchi ME, Natoli G. A hyper-dynamic equilibrium between promoter-bound and nucleoplasmic dimers controls NF-κB-dependent gene activity. EMBO J. 2006
8. Werner SL, Kearns JD, Zadorozhnaya V, Lynch C, O’Dea E, Boldin MP, et al. Encoding NF-κB
tempo-ral control in response to TNF: distinct roles for the negative regulators IκBαand A20. Genes Dev.
2008 Aug; 22(15):2093–2101. doi:10.1101/gad.1680708PMID:18676814
9. Giorgetti L, Siggers T, Tiana G, Caprara G, Notarbartolo S, Corona T, et al. Noncooperative interactions between transcription factors and clustered DNA binding sites enable graded transcriptional responses to environmental inputs. Mol Cell. 2010 Feb; 37(3):418–428. PMID:20159560
10. Hao N, O’Shea EK. Signal-dependent dynamics of transcription factor translocation controls gene ex-pression. Nat Struct Mol Biol. 2012 Jan; 19(1):31–39.
11. Paszek P, Jackson DA, White MR. Oscillatory control of signalling molecules. Curr Opin Genet Dev. 2010 Dec; 20(6):670–676. PMID:20850963
12. D’Andrea P, Codazzi F, Zacchetti D, Meldolesi J, Grohovaz F. Oscillations of cytosolic calcium in rat chroma n cells: dual modulation in frequency and amplitude. Biochem Biophys Res Commun. 1994 Dec; 205(2):1264–1269. PMID:7528499
13. Berridge MJ. The AM and FM of calcium signalling. Nature. 1997 Apr; 386:759–760. PMID:9126727 14. Berridge MJ, Galione A. Cytosolic calcium oscillators. FASEB J. 1988 Dec; 2(15):3074–3082. PMID:
2847949
15. Cai L, Dalal CK, Elowitz MB. Frequency-modulated nuclear localization bursts coordinate gene regula-tion. Nature. 2008 Sep; 455(7212):485–490. doi:10.1038/nature07292PMID:18818649
16. Crabtree GR, Graef IA. Bursting into the nucleus. Sci Signal. 2008 Dec; 1(51):pe54. doi:10.1126/ scisignal.151pe54PMID:19109237
17. Levine JH, Lin Y, Elowitz MB. Functional roles of pulsing in genetic circuits. Science. 2013 Dec; 342 (6163):1193–1200. doi:10.1126/science.1239999PMID:24311681
18. Connor FR. Introductory topics in electronics and telecommunication: modulation. The Universities Press, Belfast; 1973.
19. Eldar A, Elowitz MB. Functional roles for noise in genetic circuits. Nature. 2010 Sep; 467(7312):167–
173. doi:10.1038/nature09326PMID:20829787
20. Locke JC, Young JW, Fontes M, Hernändez Jimënez MJ, Elowitz MB. Stochastic pulse regulation in bacterial stress response. Science. 2011 Oct; 334(6054):366–369. doi:10.1126/science.1208144 PMID:21979936
21. Yissachar N, Sharar Fischler T, Cohen AA, Reich-Zeliger S, Russ D, Shifrut E, et al. Dynamic response diversity of NFAT isoforms in individual living cells. Mol Cell. 2013 Jan; 49(2):322–330. PMID: 23219532
22. Lisman JE. Bursts as a unit of neural information: making unreliable synapses reliable. Trends Neu-rosci. 1997 Jan; 20(1):38–43. PMID:9004418
23. Mora T, Wingreen NS. Limits of sensing temporal concentration changes by single cells. Phys Rev Lett. 2010 Jun; 104(24):248101–248101. PMID:20867338
24. Tostevin F, de Ronde W, ten Wolde PR. Reliability of frequency and amplitude decoding in gene regu-lation. Phys Rev Lett. 2012 Mar; 108(10):108104–108104. PMID:22463459
25. Yi TM, Huang Y, Simon MI, Doyle J. Robust perfect adaptation in bacterial chemotaxis through integral feedback control. Proc Natl Acad Sci U S A. 2000 Apr; 97(9):4649–4653. PMID:10781070
26. Barkai N, Leibler S. Robustness in simple biochemical networks. Nature. 1997 Jun; 387(6636):913–
917. PMID:9202124
27. De Palo G, Facchetti G, Mazzolini M, Menini A, Torre V, Altafini C. Common dynamical features of sen-sory adaptation in photoreceptors and olfactory sensen-sory neurons. Sci Rep. 2013 Feb; 3:1251. doi:10. 1038/srep01251PMID:23409242
28. Li Y, Goldbeter A. Pulsatile signaling in intercellular communication. Periodic stimuli are more efficient than random or chaotic signals in a model based on receptor desensitization. Biophys J. 1992 Jan; 61 (1):161–171. doi:10.1016/S0006-3495(92)81824-6PMID:1311610
29. Rapp PE, Mees AI, Sparrow CT. Frequency encoded biochemical regulation is more accurate than am-plitude dependent control. J Theor Biol. 1981 Jun; 90(4):531–544. PMID:6272030
30. Tyson JJ, Novak B. Cell cycle: who turns the crank? Curr Biol. 2011 Mar; 21(5):185–187.
31. McWatters H, Dunlap JC, Millar AJ. Circadian biology: clocks for the real world. Curr Biol. 1999 Sep; 9 (17):633–635.
32. Dolmetsch RE, Xu K, Lewis RS. Calcium oscillations increase the efficiency and specificity of gene ex-pression. Nature. 1998 Apr; 392(6679):933–936. PMID:9582075
34. Ashall L, Horton CA, Nelson DE, Paszek P, Harper CV, Sillitoe K, et al. Pulsatile stimulation determines timing and specificity of NF-κB-dependent transcription. Science. 2009 Apr; 324(5924):242–246. doi: 10.1126/science.1164860PMID:19359585
35. Tay S, Hughey JJ, Lee TK, Lipniacki T, Quake SR, Covert MW. Single-cell NF-κB dynamics reveal
digi-tal activation and analogue information processing. Nature. 2010 Jul; 466(7303):267–271. doi:10. 1038/nature09145PMID:20581820
36. Albeck JG, Mills GB, Brugge JS. Frequency-modulated pulses of ERK activity transmit quantitative pro-liferation signals. Mol Cell. 2013 Jan; 49(2):249–261. doi:10.1016/j.molcel.2012.11.002PMID: 23219535
37. Cai H, Katoh-Kurasawa M, Muramoto T, Santhanam B, Long Y, Li L, et al. Nucleocytoplasmic shuttling of a GATA transcription factor functions as a development timer. Science (New York, NY). 2014 Mar; 343(6177):1249531.
38. Gregor T, Fujimoto K, Masaki N, Sawai S. The onset of collective behavior in social amoebae. Science. 2010 May; 328(5981):1021–1025. doi:10.1126/science.1183415PMID:20413456
39. Goldbeter A, Gërard C, Gonze D, Leloup JC, Dupont G. Systems biology of cellular rhythms. FEBS Lett. 2012 Aug; 586(18):2955–2965. PMID:22841722
40. Takeda K, Shao D, Adler M, Charest PG, Loomis WF, Levine H, et al. Incoherent feedforward control governs adaptation of activated ras in a eukaryotic chemotaxis pathway. Sci Signal. 2012 Jan; 5(205). doi:10.1126/scisignal.2002413PMID:22215733
41. Shen-Orr SS, Milo R, Mangan S, Alon U. Network motifs in the transcriptional regulation network of
Escherichia coli. Nat Genet. 2002 May; 31(1):64–68. PMID:11967538
42. Goentoro L, Shoval O, Kirschner MW, Alon U. The incoherent feedforward loop can provide fold-change detection in gene regulation. Mol Cell. 2009 Dec; 36(5):894–899. doi:10.1016/j.molcel.2009. 11.018PMID:20005851
43. Hille B. Ion channels of excitable membranes. 3rd ed. Sinauer Associates Inc 2001–07; 2001. 44. Endres RG, Wingreen NS. Maximum likelihood and the single receptor. Phys Rev Lett. 2009 Oct; 103
(15):158101–158101. PMID:19905667
45. Endres RG. Polar chemoreceptor clustering by coupled trimers of dimers. Biophys J. 2009 Jan; 96 (2):453–463. doi:10.1016/j.bpj.2008.10.021PMID:19167296
46. Wiggins P, Phillips R. Membrane-protein interactions in mechanosensitive channels. Biophys J. 2005 Feb; 88(2):880–902. doi:10.1529/biophysj.104.047431PMID:15542561
47. Alon U, Surette MG, Barkai N, Leibler S. Robustness in bacterial chemotaxis. Nature. 1999 Jan; 397 (6715):168–171. PMID:9923680
48. Berg H, Purcell E. Physics of chemoreception. Biophysical Journal. 1977 Nov; 20(2):193–219. doi:10. 1016/S0006-3495(77)85544-6PMID:911982
49. Yoshimoto H, Saltsman K, Gasch AP, Li HX, Ogawa N, Botstein D, et al. Genome-wide analysis of gene expression regulated by the calcineurin/Crz1p signaling pathway inSaccharomyces cerevisiae. J Biol Chem. 2002 Aug; 277(34):31079–31088. PMID:12058033
50. Hoffmann A, Baltimore D. Circuitry of nuclear factor B signaling. Immunol Rev. 2006 Apr; 210:171–186. 51. Schmitt AP, McEntee K. Msn2p, a zinc finger DNA-binding protein, is the transcriptional activator of the
multistress response in Saccharomyces cerevisiae. Proc Natl Acad Sci U S A. 1996 Jun; 93(12):5777–
5782. PMID:8650168
52. Kang J, Xu B, Yao Y, Lin W, Hennessy C, Fraser P, et al. A dynamical model reveals gene co-localiza-tions in nucleus. PLoS Comput Biol. 2011 Jul; 7(7). doi:10.1371/journal.pcbi.1002094PMID: 21760760
53. Ferrell JE. Bistability, bifurcations, and Waddington’s epigenetic landscape. Curr Biol. 2012 Jun; 22 (11):458–466.
54. Purvis JE, Karhohs KW, Mock C, Batchelor E, Loewer A, G L. p53 dynamics control cell fate. Science. 2012 Jun; 336:1440–1444. doi:10.1126/science.1218351PMID:22700930
55. Muramoto T, Cannon D, Gierlinski M, Corrigan A, Barton GJ, Chubb JR. Live imaging of nascent RNA dynamics reveals distinct types of transcriptional pulse regulation. Proc Natl Acad Sci U S A. 2012 May; 109(19):7350–7355. doi:10.1073/pnas.1117603109PMID:22529358
56. Thattai M, van Oudenaarden A. Intrinsic noise in gene regulatory networks. Proc Natl Acad Sci U S A. 2001 Jul; 98(15):8614–8619. doi:10.1073/pnas.151588598PMID:11438714
58. Csanädy L, Vergani P, Gadsby DC. Strict coupling between CFTR’s catalytic cycle and gating of its Cl-ion pore revealed by distributCl-ions of open channel burst duratCl-ions. Proc Natl Acad Sci U S A. 2010 Jan; 107(3):1241–1246. doi:10.1073/pnas.0911061107PMID:19966305
59. Schneggenburger R, Ascher P. Coupling of permeation and gating in an NMDA-channel pore mutant. Neuron. 1997 Jan; 18(1):167–177. PMID:9010214
60. Arron JR, Winslow MM, Polleri A, Chang CP, Wu H, Gao X, et al. NFAT dysregulation by increased dos-age of DSCR1 and DYRK1A on chromosome 21. Nature. 2006 Jun; 441(7093):595–600. PMID: 16554754
61. Anderson PW. More is different. Science. 1972 Aug; 177(4044):393–6. PMID:17796623
62. Mehta P, Schwab DJ. Energetic costs of cellular computation. Proc Natl Acad Sci U S A. 2012 Oct; 109 (44):17978–17982. doi:10.1073/pnas.1207814109PMID:23045633
![Fig 1. Experimental evidence for amplitude and frequency modulation. (A and B) Example data showing amplitude modulation from [10]](https://thumb-eu.123doks.com/thumbv2/123dok_br/18328447.350575/3.918.57.696.112.753/experimental-evidence-amplitude-frequency-modulation-example-amplitude-modulation.webp)
![Fig 2. Advantages and disadvantages of amplitude and frequency modulation. AM may be less noisy than FM (A,B), but FM may allow coordinated expression of many genes (C,D) [15, 19]](https://thumb-eu.123doks.com/thumbv2/123dok_br/18328447.350575/4.918.61.693.115.718/advantages-disadvantages-amplitude-frequency-modulation-noisy-coordinated-expression.webp)