ACPD
3, 5061–5098, 2003Horizontal and vertical transports of
biomass fire emissions
G. S. Jenkins and J.-H. Ryu
Title Page
Abstract Introduction
Conclusions References
Tables Figures
◭ ◮
◭ ◮
Back Close
Full Screen / Esc
Print Version
Interactive Discussion
Atmos. Chem. Phys. Discuss., 3, 5061–5098, 2003 www.atmos-chem-phys.org/acpd/3/5061/
© European Geosciences Union 2003
Atmospheric Chemistry and Physics Discussions
Linking horizontal and vertical transports
of biomass fire emissions to the Tropical
Atlantic Ozone Paradox during the
Northern Hemisphere winter season:
climatology
G. S. Jenkins and J.-H. Ryu
Department of Meteorology, Penn State University, 503 Walker Building, University Park, Pennsylvania, USA
ACPD
3, 5061–5098, 2003Horizontal and vertical transports of
biomass fire emissions
G. S. Jenkins and J.-H. Ryu
Title Page
Abstract Introduction
Conclusions References
Tables Figures
◭ ◮
◭ ◮
Back Close
Full Screen / Esc
Print Version
Interactive Discussion
Abstract
During the Northern hemisphere winter season, biomass burning is widespread in
West Africa, yet the total tropospheric column ozone values (<30 DU) over much of
the Tropical Atlantic Ocean (15◦N–5◦S) are relatively low. At the same time, the
tro-pospheric column ozone values in the Southern Tropical Atlantic are higher than those
5
in the Northern Hemisphere (ozone paradox). We examine the causes for low tro-pospheric column ozone values by considering the horizontal and vertical transport of biomass fire emissions in West Africa during November through March, using observed data which characterizes fires, aerosols, horizontal winds, precipitation, lightning and outgoing longwave radiation. We have found that easterly winds prevail in the lower
10
troposphere but transition to westerly winds at pressure levels lower than 500 hPa. A persistent anticyclone over West Africa at 700 hPa is responsible for strong easterly winds, which causes a net outflow of ozone/ozone precursors from biomass burning in West Africa across the Atlantic Ocean towards South America. The lowest outgoing longwave radiation (OLR) and highest precipitation rates are generally found over the
15
central Atlantic, some distance downstream of fires in West Africa making the vertical transport of ozone and ozone precursors less likely and ozone destruction more likely. However, lightning over land areas in Central Africa and South America can lead to enhanced ozone levels in the upper troposphere especially over the Southern tropical Atlantic during the Northern Hemisphere winter season.
20
1. Introduction
Biomass burning in the tropics serves as a primary source for atmospheric pollutants on an annual basis. In the early 1990s, it was estimated that the global annual biomass burning represented 1.8 of the 4.7 GT of carbon burned and released to the atmo-sphere, with the savanna fires being the dominant component (1–1.6 GT of carbon
25
esti-ACPD
3, 5061–5098, 2003Horizontal and vertical transports of
biomass fire emissions
G. S. Jenkins and J.-H. Ryu
Title Page
Abstract Introduction
Conclusions References
Tables Figures
◭ ◮
◭ ◮
Back Close
Full Screen / Esc
Print Version
Interactive Discussion
mated to account for 30% of the global biomass burning emissions of trace gas and aerosols (Lacaux et al., 1993). The source of savanna fires in Africa are not centrally located in one area but can be found in the Northern and Southern Hemisphere dur-ing various times of the year. In addition, savanna fires can be found in both western and eastern parts of Africa (Jenkins et al., 1997). The majority of fires are
associ-5
ated with clearing of forest, agricultural use, control of weeds and brush and nutrient regeneration in grazing and crop-lands (Andreae, 1991).
Biomass burning is a source of carbon monoxide oxidation which in the presence
of nitrogen oxide (>4 pptv) can lead to ozone production in the tropics. Marufu et
al. (2000) estimate that biomass burning emissions contribute 9% to the production of
10
global tropospheric ozone on annual time-scales. Africa represents the largest contri-bution to the production of tropospheric ozone accounting for approximately 35% of the
total. In addition to being a pollutant in the planetary boundary layer (PBL), O3 in the
troposphere acts as a greenhouse gas, increasing the longwave forcing directed to-wards the surface. The formation of ozone near the source of the fires in the planetary
15
boundary layer (PBL) can influence the health of individuals near the fires but is quickly destroyed through deposition and photolysis. However, if ozone and its precursors (CO, NO) can be vertically transported above the PBL, then the lifetime of ozone can increase from days to weeks. Satellite estimates of tropospheric column ozone (TCO) values associated with biomass burning show the highest levels over the Tropical
At-20
lantic during the months of August through November (Fishman et al., 1991). Field experiments with measurements over the Tropical Atlantic and adjacent land areas in South America (TRACE-A) and Southern Africa (SAFARI) have been carried out in or-der to unor-derstand the relationship between biomass burning and elevated tropospheric ozone (Fishman et al., 1996; Lindesay et al., 1996).
25
During the Northern Hemisphere winter season, biomass burning is found north of
the Equator (∼5–15◦N) (Gr ´egoire et al., 1999). However, satellite and ozonesonde
ACPD
3, 5061–5098, 2003Horizontal and vertical transports of
biomass fire emissions
G. S. Jenkins and J.-H. Ryu
Title Page
Abstract Introduction
Conclusions References
Tables Figures
◭ ◮
◭ ◮
Back Close
Full Screen / Esc
Print Version
Interactive Discussion
Paradox” (Weller et al., 1996; Thompson et al., 2000). This suggests there might be several processes at work with respect to reduced tropospheric columnar ozone in the Northern Hemisphere: (1) Ozone is produced near areas of biomass burning but
limited to the PBL and destroyed in time (<1 week) by deposition and photolysis. (2)
An important O3precursor is not found in sufficient quantities for the production of O3.
5
The most likely O3precursor that would limit O3production is NO. In such a case HO2
could lead to the destruction of O3. However, measurements in TROPOZ I and II show
that NO is produced in sufficient quantities near areas of biomass burning contributing
to the production of O3 (Jonquieres et al., 1998). (3) O3 is produced in the PBL and
vertically transported into the free troposphere. It is then transported horizontally to
10
other regions by mean winds in the middle or upper troposphere.
Measurements from aircraft, ship, and ozonesondes show elevated ozone mixing ratios in the lower troposphere (3–5 km) over the Tropical Atlantic Ocean downstream of biomass burning in West Africa (Jonquieres et al., 1998; Thompson, et al., 2000).
Jonquieres et al. (1998) suggests that O3 is produced over West Africa and is
trans-15
ported at low altitudes (3–5 km above the surface) by easterly winds towards South America. Both TROPOZ and AEROSOLS99 also found elevated levels of ozone in the middle and upper troposphere over the Southern Tropical Atlantic. Thompson et al. (2000) suggest that these elevated levels of ozone in the middle/upper troposphere were due to either a mid-latitude source or lightning, depending on the latitude.
Ed-20
wards et al. (2003) have reached a similar conclusion to Thompson et al. (2000) from their satellite study during January, 2001. However, these studies covered relatively short periods of time (several weeks). In this study, observational data sets are aver-aged over numerous seasons in order to produce a climatology.
Meteorological conditions during the winter and spring seasons, which are important
25
ACPD
3, 5061–5098, 2003Horizontal and vertical transports of
biomass fire emissions
G. S. Jenkins and J.-H. Ryu
Title Page
Abstract Introduction
Conclusions References
Tables Figures
◭ ◮
◭ ◮
Back Close
Full Screen / Esc
Print Version
Interactive Discussion
of West Africa. If vertical transport were to occur it should be due to the convection (shallow or deep). Jonquieres et al. (1998) suggest that dry Harmattan winds carry
O3 and O3 precursors above the Monsoon layer as seen through cross sections of
equivalent potential temperature between 5◦S and 5◦N.
The objectives of this study are to examine: (1) the horizontal transport of biomass
5
fire emissions from West Africa during the Northern Hemisphere winter season. (2) Examine mechanisms for the vertical transport of biomass fire emissions. (3) Exam-ine lightning over the contExam-inental outflow of South America and Central Africa during Northern Hemisphere winter. (4) To relate biomass emission, transport and lightning to the satellite observations of relatively low (high) tropospheric column ozone levels
10
over the Northern (Southern) Tropical Atlantic during the Northern Hemisphere winter (“ozone paradox”).
2. Data description
Ozone, wind, precipitation and OLR are averaged for the period of 1979–1992 in order to establish climatological conditions near West Africa. The National Center for
En-15
vironmental Prediction (NCEP) reanalysis (Kalnay et al., 1996) averaged for January
1979–1992 are used at a horizontal resolution of 2.5◦×2.5◦. The rain rates are derived
from a merged data set using satellite and rain gauge data and produced at a
horizon-tal resolution of 2.5◦×2.5◦ (Xie and Arkin, 1997). The ozone climatology (1979–1992)
produced from the total ozone mapping spectrometer (TOMS) is produced at a
hor-20
izontal resolution of 1◦
×2◦ (Hudson and Thompson, 1998; Thompson and Hudson,
1999). Additional data associated with the production of ozone (fire counts, aerosols and lightning) are also used here but do not overlap with the meteorological and ozone data. The ozone vertical profiles from Southern Hemisphere Additional Ozonesondes (SHADOZ) stations are also used for 1998–2000 (Thompson et al., 2003). The fire
25
ACPD
3, 5061–5098, 2003Horizontal and vertical transports of
biomass fire emissions
G. S. Jenkins and J.-H. Ryu
Title Page
Abstract Introduction
Conclusions References
Tables Figures
◭ ◮
◭ ◮
Back Close
Full Screen / Esc
Print Version
Interactive Discussion
512 km. Fires are identified at a fixed threshold of 312◦K (Arino and Melinotte, 1995).
Fires tend to be underestimated by the ATSR instrument because of its relatively poor temporal resolution with the satellite visiting a site once every three days in equatorial regions (Buongiorno et al., 1997). The 1996–1999 monthly aerosol index is produced
on a 1◦
×1.25◦grid with a minimum of 20 days necessary to produce a monthly average
5
(Herman et al., 1997; Torres et al., 1998). The Lightning Imaging Sensor (LIS)/Optical
Transient Detector (OTD) 2.5◦ low-resolution annual climatology is used for lightning
data. This climatology is a combination of the 5-yr OTD (April 1995–March 2000) and 3-yr LIS (December 1997–November 2000) data and has been averaged for 2 months to reduced the bias due to undersampling (Williams et al., 2000; Christian et al., 2003).
10
Non-gridded monthly Lightning flashes from daily LIS overpasses are also used in this study.
3. Results
3.1. Fire counts and aerosol indices
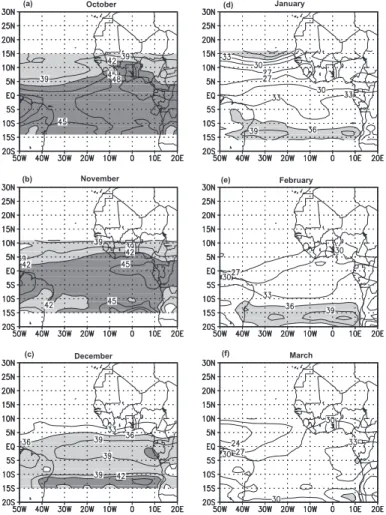
Figure 1 shows the time-averaged 1979–1992 tropospheric column ozone values for
15
October through March over West Africa and the adjacent Tropical Atlantic Ocean.
High tropospheric ozone columnar values (>42 DU) can be found during October and
November in association with the Tropical Atlantic ozone maximum (Fishman et al.,
1991). Thereafter, smaller ozone values (<30 DU) are found over the tropical Atlantic
and adjacent West Africa. During January and February, less than 36 DU can be
20
found over much of the tropical Atlantic, especially those areas adjacent to West Africa.
Higher values of ozone are found between 10◦S to 15◦S during January and February.
A similar pattern of low tropospheric columnar ozone values is found using the cloud-slicing method of Ziemke et al. (2001) (http://code916.gsfc.nasa.gov/Data services/ cloud-slice/gif/clim79-01seas.gif). January ship measurements of Weller et al. (1996),
25
ACPD
3, 5061–5098, 2003Horizontal and vertical transports of
biomass fire emissions
G. S. Jenkins and J.-H. Ryu
Title Page
Abstract Introduction
Conclusions References
Tables Figures
◭ ◮
◭ ◮
Back Close
Full Screen / Esc
Print Version
Interactive Discussion
show that the highest ozone mixing ratios are found lower troposphere. However, Kim et al. (2001) suggest that TOMS can underestimate the tropospheric column ozone if high ozone mixing ratios are found in the lower troposphere. Martin et al. (2002) suggest that TOMS tropospheric column ozone values are underestimated by 3–5 DU during DJF over areas of biomass burning in West Africa because biomass burning is
5
confined to the lower troposphere.
The low tropospheric column ozone values in Fig. 1 occur during the period (January, February) when the number of fires and aerosol indices in West Africa obtain their
highest values (Fig. 2). The fire count in West Africa (5–15◦N, 15◦W–25◦E) is averaged
from 1996 to December 1999. Monthly geographic distributions of biomass burning
10
can be obtained from (http://shark1.esrin.esa.it/ionia/FIRE/AF/ATSR.). The fires occur primarily during Northern Hemispheric winter increasing after the month of November, peaking in January and declining thereafter (Fig. 2a). Figure 2b shows the aerosol
index over a large portion of West Africa (5–15◦N, 15◦W–25◦E). The aerosol index
also has a maximum during winter and high values persist for several months after the
15
highest frequency of detected fires. High aerosol indices are found during March and April when the fire counts have fallen considerably. This suggests that aerosols can remain suspended over West Africa even when fire counts are lower.
In the examination of aerosol indices for ocean areas adjacent to West Africa, the highest aerosol indices are found from January through March. There are two
no-20
table areas where high aerosol index values are found: to the west of the continent in
the latitudes of 5–10◦N (Fig. 3a) and just to the south of land areas over the Gulf of
Guinea, between 2◦S and 5◦N (Fig. 3b). The result suggests that two exit regions for
constituents from biomass burning – to the west and to the south. Figure 3a shows the
aerosol index averaged over the ocean (5–10◦N, 45◦W–15◦W). The aerosol indices
25
here are approximately 1/2 of the land values due to scavenging by precipitation and gravity (Fig. 2b) and possess a similar temporal pattern. Figure 3b shows that the
high-est ocean aerosol indices occur just south of the Whigh-est African land mass (2◦S–5◦N,
ACPD
3, 5061–5098, 2003Horizontal and vertical transports of
biomass fire emissions
G. S. Jenkins and J.-H. Ryu
Title Page
Abstract Introduction
Conclusions References
Tables Figures
◭ ◮
◭ ◮
Back Close
Full Screen / Esc
Print Version
Interactive Discussion
land areas (Fig. 2b) implying constituents from biomass burning are transported into this region from land. To areas just north and south of the Equator and located further downstream, the highest aerosol indices occur during December, January and Febru-ary but the values are considerably reduced relative to land values and ocean areas closer to the West African land mass (Figs. 3c, 3d).
5
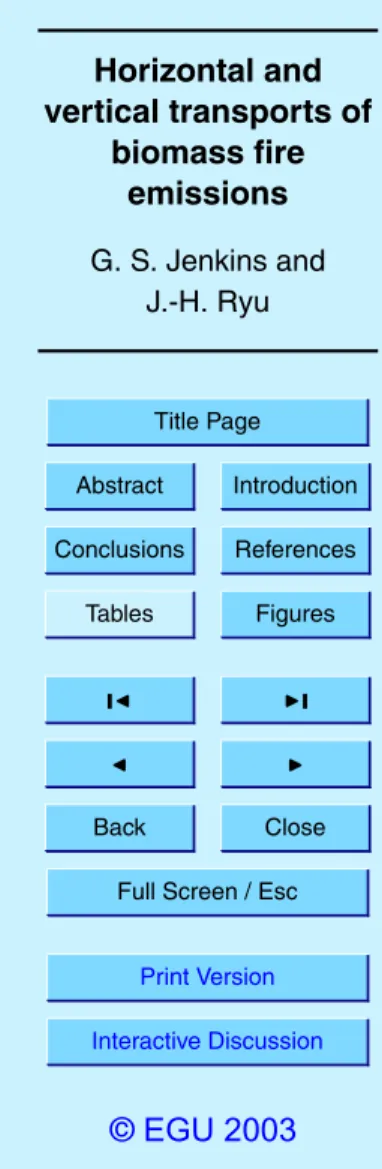
Figures 4a–f show the spatial distribution of aerosols for November through March and June averaged from 1996 to 1999. The aerosols can be seen in several isolated regions in November. It is during December, January and February when the fires
occur in West Africa that high index values can be seen in the latitudes of 5–10◦N,
extending over ocean areas due south and west of land areas. The highest indices over
10
the ocean are confined to areas just north of the Equator and to the east of 30◦W. The
location of the high aerosol index values corresponds to areas of fires, implying that the detected aerosols are due to biomass burning and not Saharan dust. During the month of March, high aerosol indices are found even when the fire count is substantially lower (Fig. 4e). The high aerosol indices could be due to a combination of mineral dust and
15
carbonaceous aerosols from smoldering fires that have not been detected by satellite. March marks the end of the dry season in extreme southern parts of West Africa as precipitation begins to return. However by June, when the detected fire counts are low, high aerosol indices are due to Saharan dust, where high values are found to stretch
across the Atlantic Ocean poleward of 10◦N (Fig. 4f).
20
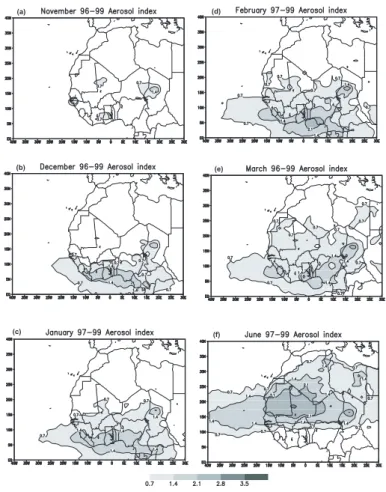
3.2. Horizontal transport processes
Figures 5–8 show the November through February time-averaged 1979–1992 zonal wind and streamlines at 925 hPa, 700 hPa, 500 hPa and 200 hPa levels over West Africa and the adjacent Atlantic Ocean. At 925 hPa, winds are directed from the
northeast and converge with southerly flow at approximately 5◦N during November
25
and February but converge at slightly lower latitudes during December and January
(Figs. 5a, 6a, 7a, 8a). Hence, O3, O3 precursors and aerosols associated with
ACPD
3, 5061–5098, 2003Horizontal and vertical transports of
biomass fire emissions
G. S. Jenkins and J.-H. Ryu
Title Page
Abstract Introduction
Conclusions References
Tables Figures
◭ ◮
◭ ◮
Back Close
Full Screen / Esc
Print Version
Interactive Discussion
these months as noted by Jonquieres et al. (1998). Over the Atlantic Ocean, the east-erly winds are dominant during this period. A characteristic feature at 700 hPa is an
anticyclone centered near 15◦N in the longitude range of 20◦W–10◦W which persists
from November through February (Figs. 5b, 6b, 7b, 8b). Westerly winds can be found to the north of the anticyclone and easterly winds to the south of it. The strongest
5
easterly winds are found over the Eastern Atlantic between the Equator and 5◦N and
longitudes of 15–30◦W. This is not the West African Easterly Jet (AEJ) as suggested
by Jonquieres et al. (1998) that owes its existence primarily to the meridional temper-ature gradient over land areas of West Africa (Cooke, 1999). The AEJ is found during the months of May through October and extends from Lake Chad out to the Eastern
10
Atlantic Ocean. Finally, the AEJ is generally found between 8◦N and 16◦N while the
strong easterly winds identified by Jonquieres et al. (1998) are found at lower latitudes and located further west during January.
Anti-cyclonic circulation is also found at 500 hPa with the axis of the anticyclone
found in the latitudes of 5–15◦N during the period (Figs. 5c, 6c, 7c, 8c). To the south
15
of the axis, easterly winds are found to extend as far north as 10◦N during November
but are confined to lower latitudes during December, January and February. The winds at 500 hPa are weaker than those at 700 hPa during the time period. This circulation at 500 hPa is persistent through February and westerly winds intensify over Northern Africa. A transition to westerly winds occurs at approximately 300 hPa and prevailing
20
winds are from the west or southwest directions throughout the tropics at 200 hPa
throughout the period (Figs. 5d, 6d, 7d, 8d). The strongest westerly winds (>24 m/s)
over West Africa are found during January and February.
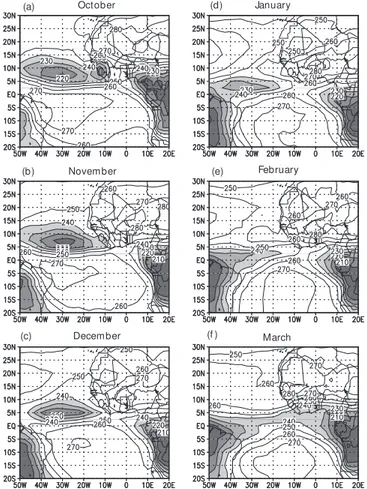
A north-south vertical profile of zonal winds at 10◦W from October through March
(Figs. 9a–f) shows that easterly winds are found throughout the lower and middle
tro-25
posphere. The core of easterly winds is centered at near 700 hPa from October through
March and its latitudinal position is located between 5◦S–15◦N. There is a transition,
however, from easterly to westerly winds at approximately 500 hPa at 10◦N.
ACPD
3, 5061–5098, 2003Horizontal and vertical transports of
biomass fire emissions
G. S. Jenkins and J.-H. Ryu
Title Page
Abstract Introduction
Conclusions References
Tables Figures
◭ ◮
◭ ◮
Back Close
Full Screen / Esc
Print Version
Interactive Discussion
but poleward of 10◦N this transition occurs at higher pressure levels (lower altitudes)
between 600–700 hPa. This zonal wind profile implies that convection would not ex-tend to very high altitudes and would be confined to the middle troposphere where the convective systems would be embedded in the easterly flow. Organized convective systems would encounter a significant amount of vertical shear in areas to the north
5
of 10◦N and therefore would not be long-lived systems. But organized convective
sys-tems are a rarity poleward of 10◦N from November through March as the “dry season”
has commenced in West Africa.
3.3. Vertical transport processes
Low OLR fluxes in the tropics are a proxy for deep convection. Figure 10 shows the
10
October through March 1979–1992 OLR values. The lowest OLR values over land areas in West Africa occur during the months of October and March. Between the months of November and February, the lowest OLR values are displaced westward
over the Tropical Atlantic. Typical OLR values of 250–270 W-m−2are found over land
areas in West Africa from November through February (Fig. 10b–e). Consequently, in
15
order to transport biomass constituents to the middle or upper troposphere, horizontal transport towards the central Atlantic is necessary. Figure 11 shows the precipitation rates over West Africa and the adjacent Atlantic from October through March. Most areas associated with high precipitation rates tend to correspond to those of low OLR values, implying that the precipitation events in the Central Atlantic are associated with
20
deep convection. The high precipitation rate over Tropical Atlantic Ocean in October shifts to the southwest from October through March.
Low precipitation rates are found over land in southern parts of West Africa from October through November followed by even lower precipitation rates from December through February. Higher precipitation rates are found just equatorward of West Africa
25
tro-ACPD
3, 5061–5098, 2003Horizontal and vertical transports of
biomass fire emissions
G. S. Jenkins and J.-H. Ryu
Title Page
Abstract Introduction
Conclusions References
Tables Figures
◭ ◮
◭ ◮
Back Close
Full Screen / Esc
Print Version
Interactive Discussion
posphere by deep convection. Thus, ozone mixing ratios in the lower troposphere can be reduced through photolysis, deposition or may be horizontally transported towards the south or west by low level winds.
If ozone is transported equatorward or to the west by low level winds it could reach the free troposphere over the ocean through adiabatic lifting. In Figs. 12 a–c, the
5
time-averaged 1979–1992 north-south cross-sections of potential temperature at 10◦W
shows that equatorward moving parcels in West Africa near the surface would rise above the marine boundary layer from December through February. Consequently, higher ozone mixing ratios should be found between 950 hPa and 800 hPa in the ab-sence of deep convection over ocean areas due to the equatorward advection of
con-10
tinental air from West Africa. In Figs. 12d–f, the time-averaged 1979–1992 east-west
cross-sections of potential temperature at 8◦N shows that westward moving parcels
in West Africa near the surface would rise above the marine boundary layer from De-cember through February. Consequently, higher ozone mixing ratios should be found between 950 hPa and 800 hPa in the absence of deep convection over ocean areas
15
due to the westward advection of continental air from West Africa. These results are in agreement with the equivalent potential temperatures found by Jonquieres et al. (1998)
and the CO and O3 mixing ratios found during flights 10 and 12 during the TROPOZ
campaign (CF Plates 1 and 2, Jonquieres et al., 1998). The MOSAIC commercial air-craft measurements also find that that highest ozone mixing ratios near 800 hPa during
20
January of 1997–2000 (Martin et al. 2002).
Lightning can also increase ozone levels through the formation of the ozone
precur-sor, NOx. Aircraft measurements during TRACE-A show elevated NOx levels in the
vicinity of deep convection/lightning (Pickering et al., 1996; Jacob et al., 1996; Smyth
et al., 1996). Figure 13 shows the combined OTD-LIS flash rate (fl/km−2/dy) for
2-25
month averages from November through February. The lightning distribution shows a strong land bias compared to the OLR distribution (Fig. 10). The high lightning flash rate corresponds to the low OLR over land, while the flash rate is very small over the
spa-ACPD
3, 5061–5098, 2003Horizontal and vertical transports of
biomass fire emissions
G. S. Jenkins and J.-H. Ryu
Title Page
Abstract Introduction
Conclusions References
Tables Figures
◭ ◮
◭ ◮
Back Close
Full Screen / Esc
Print Version
Interactive Discussion
tial distribution of flash rates between tropical oceans and tropical landmasses has been studied by Boccippio et al. (2001), Nesbitt et al. (2000), and Toracinta and Zipser
(2001). Their studies suggest that land/ocean lightning differences are associated with
land versus ocean convective intensity, i.e. the updraft velocity and the cloud optical depth. Warm clouds over the ocean have weaker updrafts and less supercooled
liq-5
uid water than clouds over land. The weak updrafts reduce the loft of large particles, such as supercooled liquid water, into the mixed phase region causing few ice particle collisions and leading to less charge separation, i.e. less cloud electrification.
High lightning flash rates are found over the continents of Central Africa and South America. Near the coastline of West Africa, lightning is observed during October and
10
November, but the flash rate is reduced December through February. This feature was also shown in Toracinta and Zipser (2001). The lightning frequently occurred over a wide range of the South America continent during October and November and de-creases from December through March. The frequent occurrence of the lightning over the two continents during November through February is likely linked to the elevation
15
of tropospheric column ozone over the Tropical Atlantic Ocean when considering the upper troposphere streamline distribution. During December, an anticyclone whose
center is found between 15–20◦S and near 25◦E develops and persists through March
producing easterly winds and outflow from Central Africa at 200 hPa. At the same time, westerly winds are associated with continental outflow from South America at 200 hPa
20
and cyclonic flow over the extreme Western Atlantic. This is essentially a Walker type circulation with rising motions over land and sinking motions over the Tropical Atlantic (not shown). Since both of these regions (Central Africa and South America) are as-sociated with high flash rates, ozone produced by lightning in the upper troposphere would get transported horizontally into the Central Atlantic Ocean producing relatively
25
high ozone values in the latitude band between 10◦S and 15◦S during January and
ACPD
3, 5061–5098, 2003Horizontal and vertical transports of
biomass fire emissions
G. S. Jenkins and J.-H. Ryu
Title Page
Abstract Introduction
Conclusions References
Tables Figures
◭ ◮
◭ ◮
Back Close
Full Screen / Esc
Print Version
Interactive Discussion
4. Conclusions
During Northern Hemisphere autumn, high tropospheric column ozone values
(>42 DU) can be found over the Southern Tropical Atlantic Ocean from September
through November. During Northern Hemisphere winter (DJF), the highest tropo-spheric column ozone values are still found over the Southern Tropical Atlantic Ocean
5
and not the Northern Tropical Atlantic Ocean, which is located just downstream of biomass burning in West Africa (Ozone Paradox).
Our analysis suggests that there are four possible processes that can enhance tro-pospheric ozone levels during N. H. winter over the Tropical Atlantic Ocean.
– Air is transported westward or equatorward from areas of biomass burning near
10
the surface in West Africa is lifted above the marine boundary layer through adi-abatic motions even in the absence of moist processes. In this case, the highest concentrations of pollutants should be found between 950 and 800 hPa over the Eastern and Central Atlantic Ocean. Elevated ozone mixing ratios were found in TROPOZ I, II, RV Polarstern and Aerosol99 campaign (Jonquieres et al., 1998;
15
Weller et al., 1996; Thompson et al., 2000).
– Ozone and/or its precursors from biomass burning in West Africa are transported
equatorward or westward over the Tropical Atlantic Ocean after it has been ver-tically transported to the lower/middle troposphere by convection. This process would take place primarily in the Gulf of Guinea where lower OLR and higher
pre-20
cipitation rates are found during the Northern Hemisphere winter season. Even if this process were to occur OLR and precipitation rates do not suggest deep convection and hence ozone or ozone precursors would be detrained in the lower
or middle troposphere (>500 hPa) and transported westward over the Tropical
Atlantic. At lower pressures (<500 hPa), ozone or ozone precursors would be
25
transported eastward by westerly winds.
ACPD
3, 5061–5098, 2003Horizontal and vertical transports of
biomass fire emissions
G. S. Jenkins and J.-H. Ryu
Title Page
Abstract Introduction
Conclusions References
Tables Figures
◭ ◮
◭ ◮
Back Close
Full Screen / Esc
Print Version
Interactive Discussion
columnar levels (Weller et al., 1996). In the tropics, such exchanges would most likely occur with deep convection that penetrates the lower stratosphere (Jenkins et al., 1997). These deep convective systems would be associated with strong vertical updrafts and lightning. The only regions that could be associated with stratosphere/troposphere exchanges would be over Central Africa and parts of
5
South America based on low OLR values and lightning distributions during Jan-uary.
– The fourth mechanism for enhancing tropospheric ozone especially in the
lati-tude band between 10◦S and 15◦S during January and February is associated
with lightning leading to the production of NOx/O3, and consequently, ozone over
10
Central Africa and South America followed by the horizontal transport of ozone by upper level winds towards the Tropical South Atlantic. Thompson et al. (2000) sur-mise that ozone production of 4–8 DU per day during the Aerosols99 campaign in
the upper troposphere was due to NOx from lightning in Central Africa.
Jonquieres et al. (1998) suggest that elevated O3 levels in the upper troposphere
15
during January were associated with South America. However, they did not provide
the mechanism for the production of O3. We have found that the most likely source
of O3 is lightning. Thompson et al. (2000) identified lightning from Central Africa as a
likely source of elevated ozone in Zone 3 (0–23◦S). However, our results suggest that
upper tropospheric O3levels in Zone 3 (0–23◦S) and the southern latitudes of Zone 2
20
(14◦N–0◦) can also be enhanced by lightning from South America. In fact, lightning is
probably an important factor in the SON Tropical Atlantic ozone maximum. We exam-ine this possibility further through ozonesonde, lightning data and upper troposphere streamline analysis associated with South America/Central Africa and the Tropical At-lantic.
25
Figures 14a, b, and c show that the 1999–2001 average ozone mixing ratios at
As-cension Island (7.98◦S, 14.42◦W), Natal, Brazil (5.42◦S, 35.38◦W) and Paramaribo,
ACPD
3, 5061–5098, 2003Horizontal and vertical transports of
biomass fire emissions
G. S. Jenkins and J.-H. Ryu
Title Page
Abstract Introduction
Conclusions References
Tables Figures
◭ ◮
◭ ◮
Back Close
Full Screen / Esc
Print Version
Interactive Discussion
October. During January, ozone mixing ratios are approximately 45–65 ppbv during January in the 500–300 hPa layer and 50–65 ppbv in the 300–150 hPa layer. During October, ozone values in the upper troposphere are enhanced by an additional 5-25 ppbv at the three locations. We believe that the high ozone mixing ratios found at all three sites in the upper troposphere are linked to deep convection/lightning from
5
South America and Central Africa based on our analysis below. Moreover, higher ozone mixing ratios are found at all layers throughout the troposphere during October (Ozone Maximum) relative to January. The 1999–2001 average ozone mixing ratios from the surface to 150 hPa during January at Ascension Island, Natal and Paramaribo are 45 ppbv, 40 ppbv and 37.1 ppbv, respectively. The 1999–2001 average ozone
mix-10
ing ratios from the surface to 150 hPa during October at Ascension Island, Natal and Paramaribo are 65 ppbv, 56 ppbv and 46 ppbv, respectively.
Figure 15a shows the monthly total number of lightning flashes from the LIS
instru-ment from 1998 through 2001 for a 3◦
×3◦area surrounding Natal and Paramaribo. In
both cases, only a small number of lightning flashes have been identified near these
15
locations and consequently the NOx/O3 production by lightning must be transported
into this region from other areas of South America. The highest frequency of lightning flashes in Natal occurs during the Southern Hemisphere summer and autumn season and during the Northern Hemisphere summer and autumn seasons at Paramaribo.
Figure 15b shows the 1998–2001 monthly lightning flashes from LIS overpasses for
20
central and northwestern sectors of South America (10◦N–10◦S, 76◦W–56◦W), and
over the continental outflow regions of eastern South America (0–20◦S, 56◦W–36◦W)
and Central Africa (4◦N–16◦S, 9◦E–29◦E). Based on the 1998–2001 period an
aver-age of 9206 flashes were detected in Central Africa and 7728 flashes in South America (6164 flashes – central/northwestern and 1564 flashes eastern parts of South
Amer-25
ACPD
3, 5061–5098, 2003Horizontal and vertical transports of
biomass fire emissions
G. S. Jenkins and J.-H. Ryu
Title Page
Abstract Introduction
Conclusions References
Tables Figures
◭ ◮
◭ ◮
Back Close
Full Screen / Esc
Print Version
Interactive Discussion
while 16 134 flashes occurred in South America. The large number of lightning flashes in Central Africa and South America overlaps with the timing of the ozone maximum (SON) over the South Tropical Atlantic Ocean. It provides support to the model study by Moxim and Levy (2000), which suggests that the September ozone maximum is due to lightning and not necessarily biomass burning. Model simulations by Martin et
5
al. (2002) show that ozone is enhanced through lightning during DJF and SON by 10– 14 DU. Lightning was also suggested as the dominant cause for high NO and ozone values in the upper troposphere during October in TRACE-A experiment (Thompson et al., 1996).
Figures 16 and 17 show the wind patterns in the middle and upper troposphere for
10
January and October 1999–2001. At 500 and 400 hPa during January and October the prevailing winds are easterly and would transport ozone produced by lightning from Central Africa toward the South Tropical Atlantic influencing the 3-ozonesonde stations (Figs. 16, 17a, b). At 300 hPa during January and October the easterly winds can be found over the Tropical Atlantic, but the easterly winds are displaced into the northern
15
hemisphere during October (Figs. 16c, 17c). The 3-ozonezonde stations are under the influence of 300 hPa easterly winds January but in October only Paramaribo is under the influence of easterly winds. Westerly winds are found above Natal and Ascension Island during October, but an oceanic anticyclone, which circulates air from Central Africa into their vicinities, also influences these stations. During January at 200 hPa,
20
Natal and Paramaribo are under the influence of westerly winds from South America while Ascension Island is under the influence from Central Africa (Fig. 16d). During October all three stations are under the influence of westerly winds, which come from South America (Fig. 17d). It is possible that Ascension Island could be influenced by anticyclone flow from Central Africa at 200 hPa in October (Fig. 17d).
25
A summary of Figs. 14–17 implies that elevated ozone mixing ratios at the 3 ozonesonde stations and over the Tropical Atlantic in the 500–300 hPa layers during
January and October are associated with NOx/O3 produced via lightning processes
ACPD
3, 5061–5098, 2003Horizontal and vertical transports of
biomass fire emissions
G. S. Jenkins and J.-H. Ryu
Title Page
Abstract Introduction
Conclusions References
Tables Figures
◭ ◮
◭ ◮
Back Close
Full Screen / Esc
Print Version
Interactive Discussion
South Atlantic and South America. On the other hand, elevated ozone mixing ratios
in the 300–150 hPa layers during January and October are associated with NOx/O3
production via lightning primarily from South America which is transported towards the
north and west affecting the Tropical Atlantic and the ozonesonde stations in
Para-maribo, Natal and Ascension Island.
5
Another suggested potential source of upper tropospheric ozone during DJF could be associated with the Northern Hemisphere extra-tropics. The model study of Martin et al. (2002) suggest that upper level westerly winds in the N. H. subtropics could be diverted to the southern Tropical Atlantic enhancing ozone by 10–15 DU. The simulated
upper level winds by Martin et al. (2002) differ significantly from the NCEP long-term
10
winds which show strong westerly winds at 300 hPa that are not diverted towards the Tropical South Atlantic Ocean (see Fig. 16c).
In summary we have examined the causes of the Tropical Atlantic “ozone paradox” and determined that tropospheric ozone values are relatively low during DJF because: (1) The lack of deep convection near regions of biomass burning is suppressing ozone
15
mixing ratios in the troposphere by confining it to the lower troposphere. (2) Ozone and ozone precursors are horizontally transported in the lower troposphere from the eastern Tropical Atlantic towards South America, in agreement with Jonquieres et al. (1998), by strong low-level easterly winds between 925 hPa and 700 hPa. On the other hand, lightning over South America and Central Africa enhances Southern
Hemi-20
sphere ozone values in the middle/upper troposphere during DJF. These conclusions are supported by the results of Martin et al. (2002) and Edwards et al. (2003).
Future field experiments should be undertaken over the Tropical Atlantic (20◦N–
20◦S), adjacent South American and West African land masses to determine the
various sources (biomass burning, lightning), sinks (photolysis, deposition),
horizon-25
tal and vertical transports (convection). One important issue to resolve is the diff
ACPD
3, 5061–5098, 2003Horizontal and vertical transports of
biomass fire emissions
G. S. Jenkins and J.-H. Ryu
Title Page
Abstract Introduction
Conclusions References
Tables Figures
◭ ◮
◭ ◮
Back Close
Full Screen / Esc
Print Version
Interactive Discussion
resolve some of these issues. However, long-term monitoring sites of ozone in West Africa will provide a more complete understanding of the ozone paradox with the other monitoring sites in the Southern Hemisphere tropics (Logan, 1999).
Acknowledgements. This research was supported through NSF Grant ATM-0105206 and NASA Grant NAG5-7443. Lightning data have been provided by the NASA Lightning
Imag-5
ing Sensor (LIS) science team and the LIS data center located at the Global Hydrology and Climate Center (GHCC), Huntsville, Alabama. NCEP data have been provided by the climate diagnostics center in Boulder Colorado. We thank T. Stoy for the useful comments on this manuscript.
References 10
Arino, O. and Melinotte, J.-M.: The Fire Atlas, Earth Observation Quarterly, 50, December, 1995.
Andreae, M.: Biomass burning: Its history, use and distribution and its impact on environmental quality and global climate, in Global Biomass Burning: Atmospheric, Climatic and Biospheric Implications, edited by Levine, J. S., pp. 3–21, MIT Press, Cambridge, Mass., 1991.
15
Boccippio, D. J., Goodman, S. J., and Heckman, S.: Regional differences in tropical lightning distribution, J. Appl. Met., 39, 2231–2248, 2000.
Buongiorno, A., Arino, O., Zehner, C., Colagrande, P., Goryl, P.: ERS-2 Monitors The South East Asia Exceptional Fire Event, Earth Observation Quarterly, 56, 1997.
Christian, H. J., Blakeslee, R. J., Boccippio, D. J. et al.: Global frequency and distribution of
20
lightning as observed from space by the Optical Transient Detector, J. Geophys. Res., 108, doi:10.1029/2002JD002347, 2003.
Cooke, H. K.: Generation of the African easterly jet and its role in determining West African Precipitation, J. Climate, 12, 1165–1184, 1999.
Crutzen, P. J. and Carmichael, R.: Modeling the influence of fires on atmospheric chemistry, in
25
Fire in the Environment: The ecological and Climatic Influence of Vegetation Fires, edited by Crutzen, P. J. and Goldhammer, J. G., John Wiley, NY, 1993.
ACPD
3, 5061–5098, 2003Horizontal and vertical transports of
biomass fire emissions
G. S. Jenkins and J.-H. Ryu
Title Page
Abstract Introduction
Conclusions References
Tables Figures
◭ ◮
◭ ◮
Back Close
Full Screen / Esc
Print Version
Interactive Discussion Fishman, J., Fakhruzzaman, K., Cros, B., and Nganga, D.: Identification of Widespread
Pol-lution in the Southern Hemisphere Deduced from Satellite Analyses, Science, 252, 1693– 1696, 1991.
Fishman, J., Hoell Jr., J. M., Bendura, R. D., McNeal, R. J., and Kirchhoff, V. W. J. H.: NASA GTE TRACE A Experiment (September–October 1992): Overview, J. Geophys. Res., 101,
5
23 865–23 879, 1996.
Gr ´egoire, J-M., Pinnock, S., Dwyer, E., andJanodet, E.: Satellite monitoring of vegetation fires for EXPRESSO: Outline of activity and relative importance of the study area in the global picture of biomass burning, J. Geophys. Res., 104, 30 691–30 699, 1999.
Herman, J. R., Bhartia, P. K., Torres, O., Hsu, C., Seftor, C., and Celarier, E.: Global
Distribu-10
tion of UV-Absorbing Aerosols From Nimbus-7/TOMS Data, J. Geophys. Res., 102, 16 911– 16 922, 1997.
Hudson, R. D. and Thompson, A. M.: Tropical tropospheric ozone from total ozone mapping spectrometer by a modified-residual method, J. Geophys. Res., 103, 22 129–22 145, 1998. Jacob D. A., Heikes, B. G., Fan, S.-M., et al.: Origin of ozone and NOx in the tropical
tropo-15
sphere: A photochemical analysis of aircraft observations over the South Atlantic basin, J. Geophys. Res., 101, 24 069–24 082, 1996.
Jenkins, G. S., Mohr, K., Morris, V. R., and Arino, O.: The Role of Convective Processes over the Zaire and Congo Basins to the Southern Hemisphere Ozone Maximum, J. Geophys. Res., 102, 18 963–18 980, 1997.
20
Jonquieres, I., Marenco, A., Maahes, A., and Rohrer, F.: Study of Ozone Formation and TransAtlantic Transport from Biomass Burning Emissions over West Africa during the Air-borne Tropospheric Ozone Campaigns TROPOZ I and TROPOZ II, J. Geophys. Res., 103, 19 059–19 073, 1998.
Kalnay, E., Kanamitsu, M., Kistler, R., et al.: The NCEP/NCAR 40-Year Reanalysis Project.
25
Bulletin of the American Meteorological Society: Vol. 77, No. 3, pp. 437–472, 1996.
Kim, J. H., Newchurch, M. J., and Han, K.: Distribution of Tropical Ozone Determined by the Scale-Angle Method Applied to TOMS Measurements, JAS, 58, 2699–2708, 2001.
Lacaux, J. P., Cachier, H., and Delmas, R. A.: Biomass Burning in Africa: An overview of its impact on atmospheric chemistry in Fire in the Environment: The ecological and Climatic
30
Influence of Vegetation Fires, edited by Crutzen, P. J. and Goldhammer, J. G., John Wiley, NY, NY, 1993.
ACPD
3, 5061–5098, 2003Horizontal and vertical transports of
biomass fire emissions
G. S. Jenkins and J.-H. Ryu
Title Page
Abstract Introduction
Conclusions References
Tables Figures
◭ ◮
◭ ◮
Back Close
Full Screen / Esc
Print Version
Interactive Discussion Programme/International Global Atmospheric Chemistry SAFARI-92 field experiment:
Back-ground and overview, J. Geophys. Res., 101, 23 521–23 530, 1996.
Logan, J. A.: An analysis of ozonesonde data for the troposphere: Recommendations for testing 3-D models and development of a gridded climatology for tropospheric ozone, J. Geophys. Res., 104, 16 115–16 149, 1999.
5
Martin, R. V., Jacob, D. J., Logan, J. A., et al.: Interpretation of TOMS observations of tropical tropospheric ozone with a global model and in situ observations, J. Geophys. Res., 107, DOI:10.1029/2001JD001480, 2002.
Marufu, L., Dentener, F., Lelieveld, J., Andrea, M. O., and Helas, G.: Photochemistry of the African troposphere: Influence of biomass-burning emissions. J. Geophys. Res., 105,
10
14 513–14 530, 2000.
Moxim, W. J. and Levy II, H.: A model analysis of the tropical South Atlantic Ocean tropospheric ozone maximum: The interaction of transport and chemistry, J. Geophys. Res., 105, 17 393– 17 415, 2000.
Nesbitt, S. W., Zipser, E. J., and Cecil, D. J.: A census of precipitation features in the tropics
15
using TRMM: Radar, ice scattering and lightning observations, J. Clim., 13, 4087–4106, 2000.
Pickering, K. E., Thompson, A. M., Wang, Y., et al.: Convective transport of biomass burning emissions over Brazil during TRACE-A, J. Geophys. Res., 101, 23 993–24 012, 1996. Smyth, S. B., Sandholm, S. T., Bradshaw, J. D. et al.: Factors influencing the upper free
tropo-20
spheric distribution of reactive nitrogen over the South Atlantic during the TRACE A experi-ment, J. Geophys. Res., 101, 24 165–24 186, 1996.
Thompson A. M., Pickering, K. E., McNamara, D. P., et al.: Where did tropospheric ozone over southern Africa and the tropical Atlantic come from in October 1992? Insights from TOMS, GTE TRACE A, and SAFARI 1992, J. Geophys. Res., 101, 24 251–24 278, 1996.
25
Thompson A. M. and Hudson, R. D.: Tropical tropospospheric (TTO) maps from Nimbus 7 and Earth-Probe TOMS by the Modified-Residual method: Evaluation with sondes, ENSO signals and trends from Atlantic regional time series, J. Geophys. Res., 104, 26 961–26 975, 1999.
Thompson, A. M., Doddridge, B. G., Witte, J. C., et al.: A Tropical Atlantic Paradox: Shipboard
30
and Satellite Views of a Tropospheric Ozone Maximum and Wave-one in January–February 1999, GRL, 27, 3317–3320, 2000.
ACPD
3, 5061–5098, 2003Horizontal and vertical transports of
biomass fire emissions
G. S. Jenkins and J.-H. Ryu
Title Page
Abstract Introduction
Conclusions References
Tables Figures
◭ ◮
◭ ◮
Back Close
Full Screen / Esc
Print Version
Interactive Discussion Ozonesondes (SHADOZ) 1998–2000 tropical ozone climatology 1. Comparison with Total
Ozone Mapping Spectrometer (TOMS) and ground-based measurements, J. Geophys. Res., 108, DOI:10.1029/2001JD000967, 2003.
Toracinta, E. R. and Zipser, E. J.: Lightning and SSM/I ice-scattering mesoscale convective systems in the global tropics. J. Appl. Met., 40, 983–1002, 2001.
5
Torres, O., Bhartia, P. K., Herman, J. R., Ahmad, Z., and Gleason, J.: Derivation of aerosol properties from satellite measurements of backscattered ultraviolet radiation: Theoretical basis, J. Geophys. Res., 103, 17 099–17 110, 1998.
Weller, R., Lilischkis, R., Schrems, O., Neuber, R., and Wessel, S.: Vertical ozone distribution in the marine atmosphere over the central Atlantic Ocean (56◦S-50◦N), J. Geophys. Res., 10
101, 1387–1399, 1996.
Williams, E. R., Rothkin, K., Stevenson, D., and Boccippio, D. J.: Global lightning variations caused by changes in thunderstorm flash rate and by changes in the number of thunder-storms, J. Appl. Met., 39, 2223–2230, 2000.
Xie, P. and Arkin, P. A.: Global Precipitation: 17-Year Monthly Analysis Based on Gauge
Obser-15
vations, Satellites Estimates and Numerical Model Outputs, BAMS, 78, 2539–2558, 1997. Ziemke, J. R., Chandra, S., and Bhartia, P. K.: “Cloud Slicing”: A new technique to derive upper
ACPD
3, 5061–5098, 2003Horizontal and vertical transports of
biomass fire emissions
G. S. Jenkins and J.-H. Ryu
Title Page
Abstract Introduction
Conclusions References
Tables Figures
◭ ◮
◭ ◮
Back Close
Full Screen / Esc
Print Version
Interactive Discussion
October (a)
November
December March
February January (d)
(e) (b)
(f) (c)
Fig. 1.The spatial distribution of TOMS tropospheric column ozone values (Dobson unit) during
ACPD
3, 5061–5098, 2003Horizontal and vertical transports of
biomass fire emissions
G. S. Jenkins and J.-H. Ryu
Title Page
Abstract Introduction
Conclusions References
Tables Figures
◭ ◮
◭ ◮
Back Close
Full Screen / Esc
Print Version
Interactive Discussion
Average Fire Count in West Africa (5-15N, 15W-25E)
0 500 1000 1500 2000 2500
J F M A M J J A S O N D
Month
Fire Count
(b) (a)
Aerosol Index (5-15N, 15W-25E) - Land
0 0.2 0.4 0.6 0.8 1 1.2 1.4
J F M A M J J A S O N D
Month
Fig. 2. (a)The monthly fire count in West Africa (5◦N–15◦N, 15◦W–25◦E), (b) the aerosol
ACPD
3, 5061–5098, 2003Horizontal and vertical transports of
biomass fire emissions
G. S. Jenkins and J.-H. Ryu Title Page Abstract Introduction Conclusions References Tables Figures ◭ ◮ ◭ ◮ Back Close
Full Screen / Esc
Print Version Interactive Discussion 0 0.2 0.4 0.6 0.8 1 1.2 1.4 1.6
J F M A M J J A S O N D
Aerosol Index (0-5N, 45W-15W)
Aerosol Index Month 0 0.2 0.4 0.6 0.8 1 1.2 1.4 1.6
J F M A M J J A S O N D
Aerosol Index (0-5S, 45W-15W)
Aerosol Index Month 0 0.2 0.4 0.6 0.8 1 1.2 1.4 1.6
J F M A M J J A S O N D
Aerosol Index (2S-5N, 25W-10E)
Aerosol Index Month 0 0.2 0.4 0.6 0.8 1 1.2 1.4 1.6
J F M A M J J A S O N D
Aerosol Index (5-10N, 45W-15W)
Aerosol Index Month (d) (c) (a) (b)
Fig. 3. The monthly aerosol index averaged over the area of(a) 5◦–10◦N, 45◦W–15◦W,(b)
ACPD
3, 5061–5098, 2003Horizontal and vertical transports of
biomass fire emissions
G. S. Jenkins and J.-H. Ryu
Title Page
Abstract Introduction
Conclusions References
Tables Figures
◭ ◮
◭ ◮
Back Close
Full Screen / Esc
Print Version
Interactive Discussion
(a)
(b)
(c)
(d)
(e)
(f)
Fig. 4.The spatial distribution of the aerosol index in West Africa during(a)November through
ACPD
3, 5061–5098, 2003Horizontal and vertical transports of
biomass fire emissions
G. S. Jenkins and J.-H. Ryu
Title Page
Abstract Introduction
Conclusions References
Tables Figures
◭ ◮
◭ ◮
Back Close
Full Screen / Esc
Print Version
Interactive Discussion
Fig. 5. The climatology of the zonal wind and streamlines in West Africa at(a) 925 hPa,(b)
ACPD
3, 5061–5098, 2003Horizontal and vertical transports of
biomass fire emissions
G. S. Jenkins and J.-H. Ryu
Title Page
Abstract Introduction
Conclusions References
Tables Figures
◭ ◮
◭ ◮
Back Close
Full Screen / Esc
Print Version
Interactive Discussion
ACPD
3, 5061–5098, 2003Horizontal and vertical transports of
biomass fire emissions
G. S. Jenkins and J.-H. Ryu
Title Page
Abstract Introduction
Conclusions References
Tables Figures
◭ ◮
◭ ◮
Back Close
Full Screen / Esc
Print Version
Interactive Discussion
ACPD
3, 5061–5098, 2003Horizontal and vertical transports of
biomass fire emissions
G. S. Jenkins and J.-H. Ryu
Title Page
Abstract Introduction
Conclusions References
Tables Figures
◭ ◮
◭ ◮
Back Close
Full Screen / Esc
Print Version
Interactive Discussion
ACPD
3, 5061–5098, 2003Horizontal and vertical transports of
biomass fire emissions
G. S. Jenkins and J.-H. Ryu
Title Page
Abstract Introduction
Conclusions References
Tables Figures
◭ ◮
◭ ◮
Back Close
Full Screen / Esc
Print Version
Interactive Discussion
ACPD
3, 5061–5098, 2003Horizontal and vertical transports of
biomass fire emissions
G. S. Jenkins and J.-H. Ryu
Title Page
Abstract Introduction
Conclusions References
Tables Figures
◭ ◮
◭ ◮
Back Close
Full Screen / Esc
Print Version
Interactive Discussion November
October
December March
February January
(a) (d)
(e) (b)
(f ) (c)
Fig. 10. The climatology of the Outgoing Longwave Radiation (OLR) in West Africa for (a)
ACPD
3, 5061–5098, 2003Horizontal and vertical transports of
biomass fire emissions
G. S. Jenkins and J.-H. Ryu
Title Page
Abstract Introduction
Conclusions References
Tables Figures
◭ ◮
◭ ◮
Back Close
Full Screen / Esc
Print Version
Interactive Discussion October
November
December
January
February
March (a)
(b)
(c) (f )
(e) (d)
Fig. 11. The climatology of the precipitation rate for(a) October through(f)March averaged from 1979 to 1992. Units are mm-day−1
ACPD
3, 5061–5098, 2003Horizontal and vertical transports of
biomass fire emissions
G. S. Jenkins and J.-H. Ryu
Title Page
Abstract Introduction
Conclusions References
Tables Figures
◭ ◮
◭ ◮
Back Close
Full Screen / Esc
Print Version
Interactive Discussion
(a)
(b)
(d)
(e)
(f) (c)
latitude longitude
longitude
longitude latitude
latitude
Fig. 12.NCEP 1000–600 hPa vertical cross section of Potential Temperatures at 10◦W for(a)
December, (b)January ,(c) February and at 8◦N (d)December, (e) January ,(c) February.
ACPD
3, 5061–5098, 2003Horizontal and vertical transports of
biomass fire emissions
G. S. Jenkins and J.-H. Ryu
Title Page
Abstract Introduction
Conclusions References
Tables Figures
◭ ◮
◭ ◮
Back Close
Full Screen / Esc
Print Version
Interactive Discussion (a)
(b) (d)
(c)
Fig. 13.The combined OTD/LIS flash rate for(a)October through(f)March. Units are fl-km−2
ACPD
3, 5061–5098, 2003Horizontal and vertical transports of
biomass fire emissions
G. S. Jenkins and J.-H. Ryu Title Page Abstract Introduction Conclusions References Tables Figures ◭ ◮ ◭ ◮ Back Close
Full Screen / Esc
Print Version
Interactive Discussion Average 1998-2000 Ozone Mixing Ratio at Ascension Island (7.98oS, 14.42oW)
0 10 20 30 40 50 60 70 80 90
sur-850mb 850-700 700-500 500-300 300-150
Layer (hPa)
ppbv
January October
Average 1998-2000 Ozone Mixing Ratios at Natal, Brazil (5.42oS, 35.38oW)
0 10 20 30 40 50 60 70 80
sur-850 850-700 700-500 500-300 300-150
Layer (hPa)
ppbv
January October
1998-2000 Average Ozone Mixing Ratio at Paramaribo, Surinam (5.81oN, 55.21oW)
0 10 20 30 40 50 60 70 80
sur-850 850-700 700-500 500-300 300-150
Layer (hPa) January October (a) (b) (c) ppbv
ACPD
3, 5061–5098, 2003Horizontal and vertical transports of
biomass fire emissions
G. S. Jenkins and J.-H. Ryu
Title Page
Abstract Introduction
Conclusions References
Tables Figures
◭ ◮
◭ ◮
Back Close
Full Screen / Esc
Print Version
Interactive Discussion
1998-2001 Total Lightning Flashes
0 5 0 0 0 1 0 0 0 0 1 5 0 0 0 2 0 0 0 0 2 5 0 0 0 3 0 0 0 0 3 5 0 0 0 4 0 0 0 0 4 5 0 0 0 5 0 0 0 0
J F M A M J J A S O N D
Month
# of Flashes
South America (10o N-10o
S, 76o W-56o
W) South America East (0-20oS, 56oW-36oW) Central Africa (4oN-16oS, 9oE-39oE)
1998-2001 Total Lightning Flashes near Ozonesonde Launch Stations
0 5 0 1 0 0 1 5 0 2 0 0 2 5 0 3 0 0 3 5 0
J F M A M J J A S O N D
Month
# of Flashes
Natal Paramaribo
(b) (a)
ACPD
3, 5061–5098, 2003Horizontal and vertical transports of
biomass fire emissions
G. S. Jenkins and J.-H. Ryu
Title Page
Abstract Introduction
Conclusions References
Tables Figures
◭ ◮
◭ ◮
Back Close
Full Screen / Esc
Print Version
Interactive Discussion
Fig. 16.The January 1999–2001 zonal winds and streamlines at(a)500 hpa,(b)400 hPa,(c)
ACPD
3, 5061–5098, 2003Horizontal and vertical transports of
biomass fire emissions
G. S. Jenkins and J.-H. Ryu
Title Page
Abstract Introduction
Conclusions References
Tables Figures
◭ ◮
◭ ◮
Back Close
Full Screen / Esc
Print Version
Interactive Discussion
Fig. 17.The October 1999–2001 zonal winds and streamlines at(a)500 hpa,(b)400 hPa,(c)