www.atmos-chem-phys.net/10/3027/2010/ © Author(s) 2010. This work is distributed under the Creative Commons Attribution 3.0 License.
Chemistry
and Physics
Cross-hemispheric transport of central African biomass burning
pollutants: implications for downwind ozone production
E. Real1,*, E. Orlandi2, K. S. Law1, F. Fierli2, D. Josset1, F. Cairo3, H. Schlager6, S. Borrmann4,5, D. Kunkel4,
C. M. Volk7,**, J. B. McQuaid8, D. J. Stewart9, J. Lee10, A. C. Lewis10, J. R. Hopkins10, F. Ravegnani2, A. Ulanovski11, and C. Liousse12
1UPMC Univ. Paris 06, Univ. Versailles St-Quentin, CNRS/INSU, UMR 8190 LATMOS-IPSL, Paris, France 2Institute for Atmospheric Science and Climate, ISAC-CNR, Italy
3Istituto di Scienze dell’Atmosfera e del Clima, Roma, Italy
4Max Planck Institute for Chemistry, Particle Chemistry Department, Germany 5Institute for Atmospheric Physics, Johannes Gutenberg Univ., Mainz, Germany
6Deutsches Zentrum f¨ur Luft- und Raumfahrt (DLR), Oberpfaffenhofen, Institut f¨ur Physik der Atmosph¨are, 82230 Wessling, Germany
7Institute for Atmospheric and Environmental Sciences, J. W. Goethe-Univ., Frankfurt, Germany
8Institute for Climate and Atmospheric Science School of Earth and Environment, University of Leeds, UK 9Department of Chemistry, Univ. of Reading, Reading, UK
10National Centre for Atmospheric Science Department of Chemistry, Univ. of York, York, UK 11CAO, Dolgoprudny, Russia
12Laboratoire d’A´erologie, Univ. de Toulouse, France
*now at: CEREA, ENPC/EDF, 20 rue Alfred Nobel 77455 – Champs sur Marne, France **now at: Department of Physics, Univ. of Wuppertal, Germany
Received: 4 May 2009 – Published in Atmos. Chem. Phys. Discuss.: 20 August 2009 Revised: 4 March 2010 – Accepted: 10 March 2010 – Published: 30 March 2010
Abstract. Pollutant plumes with enhanced concentrations of trace gases and aerosols were observed over the south-ern coast of West Africa during August 2006 as part of the AMMA wet season field campaign. Plumes were observed both in the mid and upper troposphere. In this study we ex-amined the origin of these pollutant plumes, and their po-tential to photochemically produce ozone (O3) downwind over the Atlantic Ocean. Their possible contribution to the Atlantic O3 maximum is also discussed. Runs using the BOLAM mesoscale model including biomass burning car-bon monoxide (CO) tracers were used to confirm an ori-gin from central African biomass burning fires. The plumes measured in the mid troposphere (MT) had significantly higher pollutant concentrations over West Africa compared to the upper tropospheric (UT) plume. The mesoscale model
Correspondence to:E. Real ([email protected])
Runs using a photochemical trajectory model, CiTTy-CAT, initialized with the observations, were used to esti-mate in-situ net photochemical O3production rates in these plumes during transport downwind of West Africa. The mid-troposphere plume spreads over altitude between 1.5 and 6 km over the Atlantic Ocean. Even though the plume was old, it was still very photochemically active (mean net O3production rates over 10 days of 2.6 ppbv/day and up to 7 ppbv/day during the first days) above 3 km especially dur-ing the first few days of transport westward. It is also shown that the impact of high aerosol loads in the MT plume on photolysis rates serves to delay the peak in modelled O3 con-centrations. These results suggest that a significant fraction of enhanced O3in mid-troposphere over the Atlantic comes from BB sources during the summer monsoon period. Ac-cording to simulated occurrence of such transport, BB may be the main source for O3 enhancement in the equatorial south Atlantic MT, at least in August 2006. The upper tropo-spheric plume was also still photochemically active, although mean net O3 production rates were slower (1.3 ppbv/day). The results suggest that, whilst the transport of BB pollutants to the UT is variable (as shown by the mesoscale model sulations), pollution from biomass burning can make an im-portant contribution to additional photochemical production of O3in addition to other important sources such as nitrogen oxides (NOx) from lightning.
1 Introduction
Biomass burning produces large quantities of pollutants which can be transported many thousands of kilometres downwind. This includes trace gases such as CO2, and pre-cursors of O3as well as aerosols which can also have an im-portant impact on radiative forcing. Production of O3 down-wind from source regions also influences the global oxidizing capacity through the formation of the OH radical, and thus the lifetime of greenhouse gases such as methane. Africa is the continent emitting the largest quantity of biomass burn-ing (BB) emissions with a strong inter-hemispheric transition between West Africa in boreal winter to central and southern Africa in boreal summer (Crutzen and Andreae, 1990) fol-lowing the location of the dry season in each hemisphere. O3production in African fires has been studied by Mauzerall et al. (1998). Using a box model they analysed measurements taken during several days over South and central Africa in a BB plume. They found that O3was produced in the BB plume only during the first 3 days after emission, followed by net O3destruction. They also found that due to plume di-lution, O3concentrations in the plumes increased only during the first 24 h. Chatfield et al. (1996) also simulated O3 pro-duction in BB plumes transported over the South Atlantic and estimated a slow 0.5–1 ppbv/day decrease in O3. In contrast, Thompson et al. (1996a) in a study based on measurements
taken over continent but also over the Atlantic estimated O3 production rates over the Atlantic of 1–4 ppbv/day attributed to BB plumes. Jacob et al. (1996) also estimated the O3 bud-get over the Atlantic based on Atlantic measurements and found slow net O3production above 4 km. Therefore, previ-ous BB simulations studies (not based on measurements or based on measurements close to the emission) seem to fail to reproduce positive O3production observed in BB plumes over the Atlantic, far from source emissions.
One important feature of African tropospheric O3 is the so-called maximum O3pattern (Weller et al., 1996; Thomp-son et al., 1996b; Jenkins and Ryu, 2004a): high concentra-tions over the tropical Atlantic are enhanced throughout the year. During boreal summer (wet season), the O3maximum is generally located close to the West African coast around −10◦S but O3 enhancements can extend further north (up to 5◦N) and south (
−20◦S). Layers with enhanced O3have been observed in ozone sonde data in the mid and upper tro-posphere over the Atlantic Ocean (Thompson et al., 1996a; Jenkins et al., 2008) and over West Africa (Thouret et al., 2009) during the summer monsoon period.
Two processes have been suggested to explain this O3 maximum: 1) photochemical production of O3 following NOx (nitrogen oxyde (NO) + dioxyde (NO2)) release by lightning (LiNOx) associated with deep convection has been proposed to explain enhanced O3 observed above 700 hPa (Jacob et al., 1996; Jenkins and Ryu, 2004b); 2) produc-tion of O3 in BB plumes. The relative importance of these 2 processes is still not well quantified. Whereas some stud-ies suggest a comparable importance, Sauvage et al. (2007a) suggested that annual O3production from BB sources only represents 1/4 of that from LiNOxemissions.
from central Africa to the gulf of Guinea (West Africa) and the Atlantic Ocean in the mid-troposphere during July and August 2006 and suggested that it is driven by variations in the southern branch of the African Easterly Jet. During peri-ods when this jet is less active, BB emissions can be trapped over the continent and injected into the upper troposphere by deep convection. However, the relative importance of mid-level versus upper mid-level transport of BB emissions was not studied in detail.
Whilst, pathways for the transport of BB emissions out of central Africa have been identified and related to vertical ozone sonde data or to data collected by the MOZAIC pro-gramme in the upper troposphere (Mari et al., 2008; Thouret et al., 2009; Sauvage et al., 2007b), the relative importance of mid versus upper tropospheric transport are still not well quantified. The potential of these BB air masses to produce O3downwind of the emission region and their contribution to the O3maximum over the southern Atlantic Ocean are also still very uncertain.
In this paper, we examine, in detail, using tracer simu-lations from a mesoscale model, the origin of two pollu-tion plumes observed in the Mid Troposphere (MT) and Up-per Troposphere (UT) during August 2006 over the southern coast of West Africa during the AMMA (African Monsoon Multidisciplinary Analysis) project.
Thanks to a high altitude aircraft this was the first time that trace gas and aerosol measurements were performed in the upper troposphere over West Africa. The plume observa-tions are discussed in Sect. 2). The high levels of trace gaz emitted in fire (CO, CO2, acetonitrile) and of aerosols sug-gest a BB origins. Confirmation of their origins and transport pathways to West Africa are then investigated using fire CO tracers run in a mesoscale model (Sect. 3). The results from these simulations are used to quantify the mechanisms re-sponsible for transporting the plumes from the Southern to the Northern Hemisphere where they were observed in the MT and UT over West Africa. In particular, we use the re-sults to diagnose the travel times between the source region and the region where the observations were collected as well as the fraction of tracer transported into the UT compared to the MT. We also estimate, based on photochemical trajectory model simulations initialised with plume concentrations, net photochemical O3 production rates in the MT and UT cen-tral African BB plumes during transport downwind over the Atlantic (Sect. 4). The results are discussed in the context of the possible contribution of BB emissions to the Atlantic O3 maximum and previous studies. Conclusions are presented in Sect. 5.
2 Observational evidence
During August 2006, five aircraft equipped with trace gas and aerosol instrumentation made flights over West Africa as part of an AMMA special observing period with the aim
to improve understanding about processes influencing atmo-spheric composition over this region. An overview of the main findings from this campaign is given in Reeves (2010) including details about instrument payloads and flights. Here, we focus on the analysis of plumes observed in the MT and also in the UT on 13 August 2006 when 4 aircraft flew to the Gulf of Guinea (UK BAe-146 (B-146), French Falcon-20 (FF20), DLR Falcon-20 (DF-20) and the M55-Geophysica (M55)).
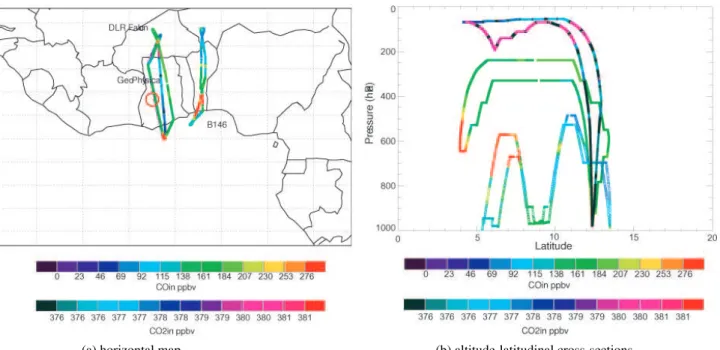
First considering the MT plume(s), layers with high con-centrations of CO, CO2, peroxyacytyle nitrate (PAN), NOx, O3, acid nitric (HNO3) Volatile Organic Carbons (VOCs) and aerosols were sampled between 2.5 and 4.5 km by the B-146, and 3 h later by the DF-20 below 5.5 km (500 hPa) over southern West Africa and the Gulf of Guinea (see Figs. 1, 2 and Table 1). For example, the DF-20 measured up to 450 ppbv CO, 130 ppbv O3 and more than 8 ppbv NOy (NO+NO2+PAN+HNO3 etc.) (see Fig. 2). The NO:NOy was rather low (0.04) indicating that significant photochemi-cal processing had taken place and therefore discounting lo-cal anthropogenic emissions as the origin. The FF-20, which flew to the same region, also sampled air masses with ele-vated CO and O3 at around 8 km at 6◦N on the same day with an origin over the Gulf of Guinea according to Ancel-let et al. (2009). The B-146 observed rather similar CO and O3concentrations especially in the upper part of their plume sampling suggesting that both aircraft sampled the same pol-luted air mass. The B-146 also sampled high concentration of PAN (greater than 800 pptv) together with high acetonitrile concentration, a strong indicator of BB emissions (Reeves, 2010). The DF-20 plume also had high CO2concentrations up to 390 ppmv (mean value of 387 ppmv). These observa-tions strongly suggest the presence of a large BB plume over the Gulf of Guinea extending between about 3 and 6 km: denoted the MT plume in the rest of the paper. Interest-ingly, data collected on the 4 August 2006, when a simi-lar flight was made over this region, also showed evidence for BB plumes with elevated trace gas and aerosol concen-trations, including CO2 up to 379 ppmv Andres-Hernandez et al. (2009).
(a) horizontal map (b) altitude-latitudinal cross-sections
Fig. 1. Flight path for 13 August 2006 flight. Colour scales represent the CO concentrations from the DF-20 and the B-146 and CO2 concentrations for the M55 aircraft. See text for details.
(a) DLR Falcon (b) Bae-146
Fig. 2.Measurements taken on 13 August 2006 by the DLR Falcon aircraft (left hand) and the Bae-146 (right hand).
on the same day). O3 concentrations were around 60 ppbv which is in the upper range of measurements collected at these altitudes during the rest of the M55 campaign (Law, 2010) and also compared to average tropical profiles reported in Fueglistaler et al. (2009) which show a minimum in the up-per troposphere at these altitudes attributed to uplift of O3 -poor air. NO and NOy were also higher during the plume sampling with up to 300 pptv NO and 1 ppbv NOy. Whilst, these NOyconcentrations are not very elevated (Voigt et al., 2008) the fact that the NO:NOyratio is around 0.3 suggests that this air mass may also have been influenced by more re-cent LiNOxemissions associated with deep convection. This point is discussed further in Sect. 4.2.
Table 1.Mean concentrations and standard deviations (in brackets) measured in the MT plume by the Bae-146 and the DLR Falcon aircrafts. No standard deviations are given for hydrocarbons as they result from one sampling measurement. Concentrations used to initialised the box model calculation are given in the third column. In case both aircrafts measured the same species, the average is calculated. HNO3is calculated as the sum: (NOy– PAN – NO2– NO). Background concentrations are taken from Jacob et al. (1996) (4–8 km).
Bae-146 DLR Falcon Initialisation background concentrations
CO (ppbv) 385 (80) 373 (80) 379 103
O3(ppbv) 108 (18) 116 (22) 112 69
NO (pptv) 244 (100) 196 (43) 220 29
NO2(pptv) 300 (102) 300 50
PAN (pptv) 1200 (450) 1200 294
HNO3(pptv) 6000 130
NOy 7720 (2000)
C2H4(pptv) 18 18
C2H6(pptv) 2760 2760 630
C2H2(pptv) 1400 1400 130
C3H6(pptv) 4 4 4
C4H10 (pptv) 30 30
C5H12 (pptv) 4 4
C6H6(pptv) 326 326 21
C7H8(pptv) 10 10 2
Formaldehyde (pptv) 1110 1110 40
Acetaldehyde (pptv) 1030 1030 320
Acetone (pptv) 2010 2010 593
CO2(ppmv) 387 (3) 376
5.06•104
5.08•104
5.10•104
5.12•104
5.14•104
200 180 160 140 120 100
NO
y in pptv
0 200
400 600 800 1000 1200
O3 in ppb
v/10
NO in pptv Pressur
e in hP
a
(a) NO, NOy, O3 (b) CO2
Fig. 3.Right hand figure: Measurements of NO, NOyand O3taken on 13 August 2006 by the GeoPhysica. Left hand figure: Measurements of CO2taken during the whole campaign, CO2measured during the dive on the 13 August is highlighted in red.
tropospheric aerosol composition over West Africa (Bor-rmann et al., 2009). Finally, whilst CO was not measured on this day by the M55, the DF-20 and the FF-20 (Ancellet et al., 2009) also sampled plumes with elevated CO at around 11 km over the southern coast of West Africa (see Fig. 2). Analysis of MOZAIC data collected between 1 to 16 Au-gust 2006 in the upper troposphere also shows the existence
of several plumes between the Equator and 5◦N with CO
to 15% of the measured air masses up to 150 hPa probably originate from central Africa during the period 13 to 16 Au-gust.
In summary, it appears that the MT plume(s) has the char-acteristics of a BB origin with high concentrations of trace gases (including BB tracers) and aerosols. Considering the UT plume, high CO2concentrations indicate a BB origin but the air mass may also have been influenced by LiNOx. In the next section we examine the transport mechanisms re-sponsible for transporting BB plumes originating from cen-tral Africa to the MT and UT over West Africa. The possible LiNOxinfluence is discussed further in Sect. 4.
3 Cross-hemispheric transport of BB plumes: mechanisms and travel times
3.1 Meteorological situation
The circulation over West Africa during the summer mon-soon is dominated by the northward migration of the Inter-Tropical Front denoting the convergence between south-westerly monsoon winds and north-easterly dry Harmattan winds, and associated westward propagation of organised mesoscale convective systems linked to the position and strength of the African Easterly Jet (AEJ). The 2006 mon-soon was characterised by slightly higher convective activity (stronger AEJ) than average and an intertropical convergence zone at 10◦N in August. The upper level tropical easterly jet,
positioned at around 5◦N was also stronger in August 2006
with a slight north-east/south-west tilt compared to its mean position. For further discussion about the meteorological sit-uation during the wet season in 2006 compared to other years see Janicot et al. (2008).
As discussed in the Introduction, Sauvage et al. (2006) at-tributed mid-tropospheric O3enhancements over the south-ern coast of West Africa to direct transport of BB plumes in the mid-troposphere during the summer monsoon. This transport pathway is associated with a convergence zone at 5S over central Africa followed by transport by south-easterly trade winds over the Gulf of Guinea. Mari et al. (2008) further investigated cross-hemispheric transport of BB pollution during July and August 2006 using of fire tracer simulations in the FLEXPART model. They examined the re-lationship between the intrusion of BB emissions into West Africa, and the strength of a mid-level jet over central Africa. This jet previously identified by Burpee (1972); Nicholson and Grist (2003), and denoted African Easterly Jet south (AEJ-S) in Mari et al. (2008) had a mean position around 5◦S and 700 hPa in 2006. Mari et al. (2008) found that
dur-ing so-called AEJ-S active phases (25 July to 2 August 2006; 10 to 31 August 2006), this jet extended westwards over the ocean thus driving lower tropospheric intrusions of BB plumes over the Gulf of Guinea. During break phases (3 to 9 August 2006) such transport is inhibited and BB pollutants
remain trapped over the central African continent. Whilst Mari et al. (2008) suggested that BB plumes can also be up-lifted by deep convection into the upper troposphere followed by westward transport by the tropical easterly jet they did not examine this second transport pathway in detail. Here, we use a mesoscale model, BOLAM (Bologna Limited Area Model) Buzzi and Foschini (2000), to quantify the relative fractions of BB pollutants transported in the UT compared to the MT and to investigate how long it took the pollutants to arrive over southern West Africa where the measurements were taken. We also use the model results to estimate dilu-tion rates for the UT plume in the chemical trajectory model calculations.
3.2 Model description and simulation set up
BOLAM is a limited-area, primitive equation, terrain-following coordinate, hydrostatic meteorological model. A detailed description of the dynamics and numerical schemes of the model can be found in Malguzzi et al. (2006). The main prognostic variables are the wind components (u and v), the potential temperature, the surface pressure, and the specific humidity. The water cycle for stratiform precipita-tion is described by means of five addiprecipita-tional prognostic vari-ables: cloud ice, cloud water, rain, snow, graupel The hor-izontal discretization is based on a (staggered) Arakawa C grid, in geographical coordinates (latitude-longitude). Deep convection is parametrized using the Kain-Fritsch convection scheme, recently updated on the basis of the revision pro-posed by Kain (2004).
The model simulations discussed here were run over the domain shown in Fig. 4 with a horizontal resolution of 0.26◦
×0.26◦ and 38 hybrid sigma vertical levels from the ground to 10 hPa. The model was initialized using 0.5◦
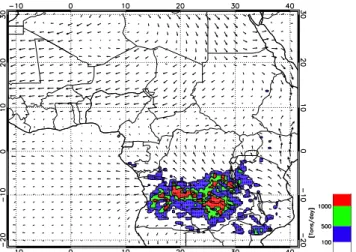
Fig. 4. Percentage of cloud cover for model-derived cloud top brightness temperature less than 230 K. Cloud Percentage is relative to the period 15 July–15 August. Black squares indicate the aver-aging area used in Fig. 7. Red box indicates the BOLAM model domain.
Fig. 5.CO flux averaged between 15 July and 15 August. Thin ar-rows are ECMWF wind field averaged between 15 July and 15 Au-gust at 750 hPa.
3.3 BB tracer results
In this section the model capacity to reproduce convective activity was first evaluated. Then the model time distribution of BB tracers was studied (from 15 July to 15 August), show-ing the episodic nature of transport in equatorial regions both in the UT and the MT. Different pathways for UT and MT plumes were simulated and the ratio of tracers transported in the UT to those transported in the MT was evaluated and compared with measurements. Finally the plumes age over West Africa were evaluated using modelled tracers.
The performance of the BOLAM model in reproducing convective activity was evaluated using cloud top bright-ness temperatures derived from the 10.8 micrometer chan-nel of the SEVIRI radiometer, on-board of Meteosat Second
Fig. 6. Percentage of cloud cover for cloud top brightness tem-perature less than 230 K, evaluated from MSG-SEVIRI radiometer. Percentage is relative to the period 15 July–15 August. Thin arrows are ECMWF wind field at 250 hPa averaged over the same period.
Generation satellite. These values were compared with cloud top brightness temperatures calculated using the RTTOV-8 (Proceedings of the Fourteenth International TOVS Study Conference Conference; Beijing, 2005) radiative transfer model and BOLAM water vapour, temperature and hydrom-eteor profiles. The percentage cloud cover with cloud top temperatures less than 230 K together with ECMWF winds at 250 hPa are shown in Fig. 6. The figure shows the re-gions with greater convective activity and the tropical east-erly jet that transports the air masses uplifted by deep convec-tion toward West Africa. Figure 4 shows the percentage of cloud cover calculated from the BOLAM model for the same period. The model reproduces reasonably well the structure and intensity of convective activity. The meridional position of the intertropical convergence zone in West Africa is dis-placed northward in the model by about 5 degrees while its northern extent in Sudan and Chad is well simulated. How-ever, BOLAM simulates less convective activity in Demo-cratic Republic of Congo, Cameroon and Nigeria and over-estimates convection in Central African Republic, Sudan and Chad.
Fig. 7. Time-pressure plot of tracer concentration (in tracer units) averaged over areas A1, A2 and A3 (top left, top right and bottom left, respectively). Time-pressure plot of tracer travel time for area A3 (bottom right). Travel time is given in days.
daily position of fires and the intensity of the low level winds. Three episodes of high BB tracer concentrations are visible in A1 in the lower troposphere. The one between 3–11 Au-gust 2006 corresponds reasonably well with the break phase of the AEJ-S described by Mari et al. (2008) when pollutants build up over the continent, even if the model has higher con-centrations and simulated tracers for longer over this region than simulated by Mari et al. (2008). Injection into the UT is also episodic and depends on the position of convective ac-tivity relative to the availability of pollutants (tracer) at lower altitudes. There is a clear increase in MT and UT tracer after the 5 August, especially in A2 where the convection is lo-cated (see Fig. 6). At mid-levels (around 650 hPa) over West Africa enhancements in A3 tracer concentration are seen be-tween 27–29 July, 2–5 August and after 14 August. In the UT tracer arrives, albeit with low values, around 1 August with a more intense peak after the 14 August. This later enhance-ment corresponds well with the plume location measured by the M55 even but the modelled plume arrives 1 day later. The plume is quite dispersed in the vertical. This may be realistic since the DF-20 may have also sampled a BB plume in the UT around 11 km (see Sect. 2).
Examination of tracer concentrations at different altitudes shows that the MT and UT BB tracer follow different path-ways. During the break phase (e.g. 3–11 August in the model) what becomes UT tracer is uplifted by wet convection in the area around the equator spanning longitudes between 15◦and 25◦E, and in the area around 5◦N 22◦E. The MT
tracer is transported into the mid-troposphere south of the equator between 10◦and 23◦S, where wet convection is
ab-sent according to the model and less intense according to the satellite cloud measurements (see Figs. 6 and 4). Then, it is transported vertically by both dry convection and the baro-clinic cell previously described by Sauvage et al. (2005).
The ratio of tracer in the UT versus MT (TracerUT
TracerMT) can be
selected to evaluate the ratio was chosen to contain almost all the plumes and spans from 10◦S to 15◦N and 10◦W to
10◦E. The UT:MT ratio varies between 0.3 and 0.6 between
14–15 August, with an average of 0.42 over this period which is similar to that derived from the CO2measurements. Val-ues inferred from Mari et al. (2008) suggest a lower fraction transported into the upper troposphere (0.05–0.2) based on study using FLEXPART driven with ECMWF winds over the region encompassing 30W-10E. The UT:MT ratio was also calculated for a longer period from 1–15 August. To take into account the variability of the vertical position and thick-ness of the plumes, two pressure layers were used: 800 hPa– 500 hPa and 500 hPa–150 hPa. 500 hPa was chosen since the model shows a discontinuity in tracer concentration at this altitude which can be interpreted as the transition be-tween the UT and MT transport pathways. The ratio over this period varies between 0.25 and 1, giving 0.6 on aver-age. Therefore, according to the model, a significant frac-tion (higher than previously reported) of BB emissions can be transported into the UT but this fraction remains lower that those transported in the MT. These differences in tracer concentrations are due to 1) the fact that wet convection is needed to inject tracer in the UT and 2) higher mixing of tracer when transported in the UT. This more intense mix-ing is due to both uplift by deep convection and dispersion by wind fields. In fact, entrainment and detrainment of am-bient air within the vertical column is taken into account in the model convective parametrization leading to tracer mix-ing with cleaner air masses. Furthermore, dispersion occurs in the outflow region due to divergent winds that form at the top of the uplift column.
Since we emitted one tracer per day the results can also be used to estimate the time since emission as a function of altitude. This time since emission is obtained from a mean age of the tracers on each days, weighted by their concentra-tions. Results over A3 are shown in Fig. 7 averaged over the whole simulation period. The time for the tracers to arrive over West Africa with maximum modelled concentrations in the UT (14 August) at 200 hPa is 14 to 15 days whereas the MT plume takes between 16 to 17 days. An estimate of the time needed by pollutants to travel between areas A1/A2 and area A3 was also estimated by dividing the longitudi-nal distance between the centres of areas A1 and A2 (20◦E)
and the centre of area A3 (1◦E) by the zonal wind speed
averaged between 11–15 August and averaged over the re-gion encompassing areas A1, A2 and A3 (4◦S and 8◦N;
2◦W and 25◦E). We derive a transit time of 4–5 days for
the MT plume and 1–2 days for the UT plume. This is faster than the 8 days reported by Sauvage et al. (2005). However, that study was based on a climatological (1997–2003) analy-sis of MOZAIC profile data, and could be due to differences in wind speeds between different years. Our results suggest that this transport can be much faster in certain cases.
In summary, the modelled tracer results support the hy-pothesis of direct mid-troposphere transport of BB plumes
from central Africa to the southern coast of West Africa. These MT plumes contain high pollutants concentrations due to the time spent in the vicinity of the emission regions. We also show that BB pollutants transported further north can be uplifted into the UT by wet convection, and transported west-ward to the measurement region over West Africa. These plumes exhibit lower concentrations probably due to en-hanced mixing. For the 1–15 August period a ratio between tracers concentration in the UT and the MT of 0.6 was evalu-ated over a region encompassing West Africa and the eastern part of equatorial south Atlantic.
4 Ozone production in plumes transported downwind of West Africa
In this section, we address the question about whether these BB plumes continue to produce O3 downwind from where the measurements were taken, i.e. over the equatorial South Atlantic. A photochemical model, CiTTyCAT (including 90 chemical species, see Evans et al., 2000; Real et al., 2007 for details) was initialized with mean concentrations taken from available measurements and run forwards for 10 days along selected air masses trajectories. The trajectories were calculated from the location of the BB measurements (MT and UT) using the FLEXTRA model (Stohl et al., 1995) run with ECMWF wind fields (see Fig. 8). The MT plume was transported over the southern Atlantic Ocean before reach-ing the south American east coast. The UT plume was also transported over ocean but it recirculated back to the cen-tral African coast. Simulations of the chemical fate of both plumes were carried out including diagnosis of photochem-istry versus mixing/dilition of the plume with background air, and the impact of aerosols on photolysis rates for the MT plume.
4.1 Chemical fate of the MT plume
4.1.1 Model set-up
On 13 August 2006, the B-146 sampled the lower part of the plume, followed 3 h later by the DF-20 sampled its upper part. Since these plumes have very similar origin measure-ments can be combined to provide mean values to initialize the model MT plume simulations (see Table 1). Forward tra-jectories initialized in the plume show similar directions but different altitudes at the end between 1.5 and 6.5 km. One trajectory was chosen to conduct the main simulations (black one in Fig. 8) and a sensitivity test regarding the choice of trajectory is presented in Sect. 4.1.3.
226 228 230 232 234 236 hours along trajectory
0 2 4 6 8 10 12 14
height
Fig. 8.10 days simulated forward trajectories initialised from the MT plume and the UT plume. 3 MT trajectories were chosen to performe MT run (green, black and orange bold lines) and one trajectory for the UT run (pink bold line). Flight tracks of the DLR Falcon, the BAe-146 and the GeoPhysica aircrafts are represented as red dashed lines.
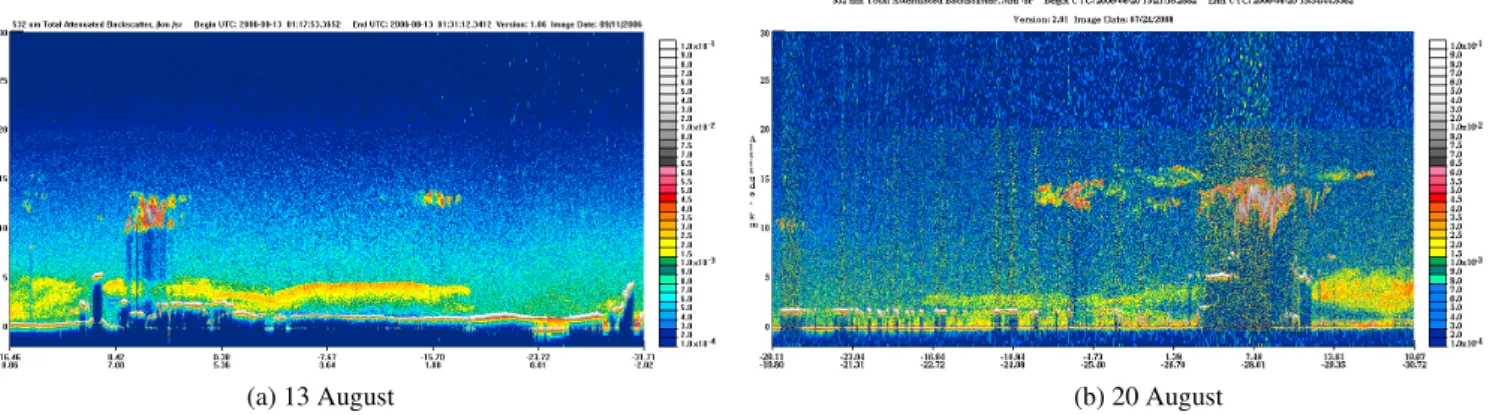
(a) 13 August (b) 20 August
Fig. 9.CALIPSO images during the paths of 13 August over the Gulf of Guinea (right hand) and over the SAO on 20 August (left hand). Plumes with high concentrations of aerosols are visible between 2 and 5 km.
details). This scheme requires information about the aerosol optical depth (AOD) of the aerosol layer and aerosol optical properties. Refractive indices (Ri=1.54−0.078) and aerosol size distributions were taken from measurements made in aged BB plumes from a South African fire (Haywood et al., 2003), and used to calculate optical properties using a Mie code (Mishchenko et al., 1999). The 550 nm AOD was re-trieved from MODIS satellite measurements (Tanre et al., 1997; Remer et al., 2005) which passed over the Gulf of Guinea on 13 August, and over south Atlantic 7 days later. The collocated CALIPSO lidar data (Winker et al., 2003) clearly show that the main AOD contribution is due to the presence of an aerosol layer between 4 and 6 km on 13 Au-gust, and also on 20 August albeit less intense (see Fig. 9).
MODIS Aqua aerosol level 2 products version 5 (MYD04) and CALIPSO level 1 version 2 data (532 nm total attenu-ated backscatter) were used in this analysis. An AOD of 0.9 on 13 August and 0.3 on 20 August were estimated for the aerosol layer. Therefore, in Run-AER the AOD was allowed to decrease linearly from 0.9 during the first 7 days and then held constant at 0.3.
Fig. 10. Simulated concentrations in the MT plume for case RUN-CHEM (black lines), RUN-AEROSOL (red lines) and RUN-MIXING (blue lines).
not show any precipitation along the trajectory) and a zero aerosol background, observed decreases in AOD were used to estimate a mixing rate of 6.4 days. This mixing rate com-pares well with values estimated by Real et al. (2007) at mid-latitudes in the free troposphere under meteorological conditions dominated by large-scale advection, which is also the case for the MT plume studies here. For background con-centrations, mean measurements taken between 4–8 km dur-ing the TRACE-A campaign over the southern Atlantic, and reported in Jacob et al. (1996) were used (see Table 1).
4.1.2 Results
Changes in simulated MT plume concentrations during 10 days are shown in Fig. 10 for Run-CHEM (black continuous line), Run-AER (red dashed line) and Run-MIX (blue dot-ted line). Run-AER simulates slightly lower O3and higher CO than Run-CHEM although changes are small. Run-MIX, which represents the more realistic run, generally produces lower concentrations of all species compared to Run-AER due to mixing with cleaner air masses. Mixing has less im-pact on more reactive species such as NOx and also, PAN which is mainly influenced by temperature-driven decompo-sition.
Before describing chemistry going on in the plume, we sum-up the main processes influencing O3concentrations in the troposphere. O3is produced by the photolysis of NO2 and destroyed by reaction with NO. In the presence of car-bonaceous species (VOC, CO or CH4) additional O3can be formed due to the additional formation of HO2and higher peroxy radicals. O3 can also be destroyed by photolysis in presence of water vapour or reaction with OH or HO2. NO2mainly recycles with NO but can be stored in reservoir species such as PAN or HNO3. Thermal decomposition of PAN (under high temperatures) or photolysis of HNO3 can release NO2back into the atmosphere leading to additional photochemical O3production.
(a) O3net production (b) O3production and loss
Fig. 11.10 days simulated net O3production (left hand) and simulated production and destruction terms (right hand) in the MT plume.
during half of the simulation followed by increase. The pro-duction dominates until the 4th day of the simulation when increases in water vapour lead to additional O3destruction. Also, due to increasing O3 concentrations, O3loss also in-creases via photolysis and reaction with HO2.
Daily NPO3s in Run-AER compared to Run-CHEM show strong differences: a −25% reduction during the first few days when there is net O3production, and a net increase in NPO3in Run-AER during the last 6 days when there is net O3loss. When averaged over 10 days, this leads to a mean NPO3in Run-AER which is only slightly lower compared to Run-CHEM (1.6 ppbv/day or 6% reduction). Indeed, be-cause they absorb and scatter light, aerosols have the effect of reducing the photolysis rates of both NO2 and O3, and therefore O3production and O3destruction respectively. As already discussed in Real et al. (2007), when an air mass is in an O3destruction regime (O3 loss higher than production), a similar proportional reduction of both O3 production and destruction quantitatively reduce the destruction more than the production leading to less net O3destruction overall (see also Fig. 11). Inversely, in an O3production regime, O3 pro-duction is reduced more than O3 loss, leading to lower O3 concentrations. One important difference between the 2 runs is that the O3maximum appears later in the Run-AER case.
In Run-MIX the mean NPO3is larger (2.6 ppbv/day) than without mixing. In this run, mean concentrations of O3 pre-cursors, like NOx, are lower leading to a decrease in O3 pro-duction. However, O3 itself also strongly decreases due to mixing with clean air masses leading to a larger reduction in O3destruction compared to O3production, and therefore larger NPO3. However O3 concentration at the end of the simulation is lower than in Run-CHEM because of mixing with O3poor air masses.
In the 3 simulations O3 production is maintained by two processes: PAN thermal decomposition during the sub-sidence of the plume due to increases in temperature,
and HNO3 photolysis. Sensitivity runs without a) PAN decomposition and b) HNO3photolysis show that these pro-cesses contribute almost equally to NPO3 in the plume. When both processes are removed, NPO3 is negative. This shows that in this aged plume, O3 production is not di-rectly maintained by NOxconcentrations but by NO2from reservoir species: PAN and HNO3. PAN has already been shown to play an important role in tropospheric O3 produc-tion downwind from source regions (Heald et al., 2004). In particular, in BB plumes transported over the North Atlantic it was shown that PAN decomposition explain 80% of O3 production (Real et al., 2007). The role of HNO3as a source of available NOx for O3 production is less well quantified with HNO3 being mainly seen as a loss for NO2. It has been shown that when HNO3 concentrations are very high (>15 000 pptv), HNO3photolysis can maintain O3 produc-tion in anthropogenic plumes transported over oceans at mid-latitudes (Neuman et al., 2006; Real et al., 2008). Here, HNO3concentration are not as high, but since the MT plume is transported at equatorial latitudes, photolysis rates are higher, and the role of HNO3as a source of O3is more im-portant.
4.1.3 Sensitivity study on the trajectory used
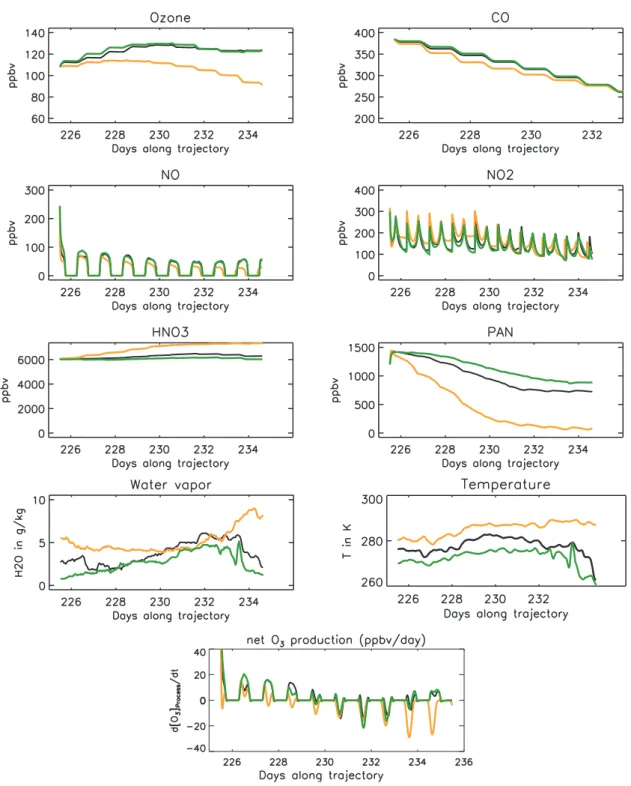
Fig. 12.Simulated concentration in the MT plume for case RUN-CHEM but for 3 different trajectories. Colours correspond to colours of the trajectories in Fig. 8: black for the reference trajectory, green for R-HighLevel and orange for R-Lowlevel. Simulated NPO3is also shown.
below 2 km (orange trajectory on Fig. 8, R-LowLevel). Re-sults are shown Fig. 12 with no dilution and no aerosol im-pact. Temperature and water vapour simulated over the tra-jectories are also shown together with the net O3production. R-HighLevel and the reference run show similar O3 concen-trations. Temperature and water vapour are lower in the R-HighLevel trajectory that was transported at higher altitudes.
higher temperatures and water vapour concentrations. O3 production following PAN decomposition is maintained dur-ing the first 4 days but when PAN concentrations are too low, strong O3destruction induced by the high water vapour dom-inates leading to negative NPO3overall. Mean NPO3 sim-ulated (with no dilution or aerosol impact) is 1.7 ppbv/day for the reference case against 1.6 ppbv/day for R-HighLevel and−2 ppbv/day for R-LowLevel. When including aerosol and mixing effects (not shown), NPO3 is 2.5 ppbv/day for R-HighLevel and −0.5 ppbv/day for R-LowLevel (against 2.6 ppbv/day for the reference run). Final O3concentrations after 10 days are 80 ppbv HighLevel) and 71 ppbv (R-LowLevel) when aerosol and mixing are included. Above the mid Atlantic (−20◦W and−40◦W), simulated O3 concen-trations are between 80 and 100 ppbv for trajectories above 4 km and 71–80 ppbv for the lowest trajectory (not shown). This study shows that NPO3in a plume transported over the Atlantic is very sensitive to the altitude of the transport with more O3production in the mid-troposphere compared to the lower troposphere where NPO3is negative.
4.1.4 Comparison with previous studies
The O3concentrations and NPO3rates presented in the pre-vious section can be compared with O3measurements col-lected over the equatorial Atlantic and previous estimates of photochemical O3 production rates in BB plumes trans-ported over the southern Atlantic Ocean. Enhanced O3 layers were observed over the Atlantic Ocean at equatorial latitudes by Jenkins et al. (2008). O3 concentrations be-tween 70 to 100 ppbv were measured in June 2006 mainly between 4 and 10 km. Below 4 km, plumes were not very pronounced with O3 concentrations generally lower than 60 ppbv. O3 concentrations between 80 and 90 ppbv be-tween 3 and 12 km have also been observed at Ascension island (7.9 0◦S, 14.40◦W) which is at lower latitudes than
the case studied here (Thompson et al., 1996a). Our esti-mated O3concentrations in the model runs including mixing over the Atlantic are in the same range of concentrations (80– 100 ppbv), and also predict lower concentrations at lower al-titude (71–80 ppbv). Jenkins et al. (2008) mainly observed layers with enhanced O3 at higher altitudes in June 2006 than suggested by our results for August 2006. Thouret et al. (2009) also showed that enhanced layers were observed over West Africa at higher altitude in June than in August during 2005 and 2006.
As highlighted in Sect. 1, previous studies estimating photochemical O3 production in BB plumes during trans-port downwind from South African BB regions showed O3 net production close to the emissions and weak net O3 de-struction over the Atlantic (Mauzerall et al., 1998; Chatfield et al., 1996). In Mauzerall et al. (1998) the plume stayed above 4 km and in Chatfield et al. (1996) plumes were sim-ulated between 3–6 km. Other studies based on measure-ments made over the Atlantic (and not over the continent as
in Mauzerall et al., 1998) estimates net O3production rates between 1–4 ppbv/day in the mid-troposphere (Jacob et al., 1996; Thompson et al., 1996a). This production was at-tributed to BB by Thompson et al. (1996a) and to both BB and lightning by Jacob et al. (1996). This latter also calcu-lated net O3destruction (−0.7 ppbv/day) below 4 km.
When mixing is taken into account, we calculate a 10 day average NPO3around 2.8 ppbv/day above 4 km over the At-lantic and as high as 5 ppbv/day during the first 4 days of transport downwind from West Africa. These results sug-gest that this aged plume, which is already 16 days old at the beginning of the simulation, is still very photochemically active. Previous studies focused on younger plumes and did not take into account the impact of aerosols, which as we have shown may lead to a delay in the peak O3production. This effect could be particularly strong close to the fire emis-sions where aerosol optical depths are high and may partly explain the differences between our estimate and those from Mauzerall et al. (1998); Chatfield et al. (1996).
Following Thouret et al. (2009), O3enhancements in the free troposphere over West Africa are observed during 40% of the time in JJA 2005 and 2006 with an even higher oc-currence in August 2006 (6 soundings over 7 show an O3 enhancement). They suggested that these layers have BB ori-gins. The BOLAM model results discussed earlier confirmed that MT plumes over West Africa are transported over the south Atlantic. Therefore, it can be estimated that the mid-troposphere over the equatorial South Atlantic is often im-pacted by BB air masses in JJA. With a mean O3production rate of 2.6 ppbv/day at 4 km over the ocean, pollutant plumes from BB regions are likely to have a significant impact on O3 concentrations in the South Atlantic mid-troposphere. Sim-ulated Atlantic O3concentrations are on the same level than measured in O3plumes suggesting that O3enhancements in the South Atlantic mid-troposphere may be mainly explained by BB sources. However a more thorough study with a chemistry-transport model that can correctly simulate BB transport and take into account aerosol impacts on photolysis rates as well as lightning NOxis needed to better evaluate the contribution of BB emissions to the O3budget in this region. 4.2 Chemical fate of the UT plume
4.2.1 Model set-up
measurements were made by the M55 on 13 August which can be used to initialize the plume, namely O3, NOy, NO, and CO2(see Fig. 3) making it necessary to estimate other species (VOCs, CO, missing NOycomponents). This means that the results presented here are not as well constrained as the MT case. Nevertheless, the model results can be used to provide an initial estimate of NPO3in the UT from a BB plume.
In order to estimate the missing values, measurements from the MT plumes sampled by the DF-20 and B-146 were used. Assuming plumes underwent the same chemical and physical transformations during transport from BB emis-sion region, the fraction 11SpeciesCO
2 (where1is the difference
between concentration in the plume and the background) should be approximately conserved between MT and UT
1Species 1CO2
UT=
1Species 1CO2
MT
. This ratio is not modified by dilution or mixing since both species are affected to the same degree. According to Sect. 3, the plumes have approxi-mately the same age so the level of oxidation in both plumes may not have been very different leading to small differences in CO and VOC lifetimes. By using measured11COCO
2
MT and11VOCCO
2
MTcombined with1CO2measured in the UT to obtain a UT1CO and1VOC, CO and VOC tions in the UT plume were derived. Background concentra-tions were estimated from background concentraconcentra-tions mea-sured during the campaign by the M55 for CO, CO2, NO, NOy, O3and taken from Jacob et al. (1996) for VOCs and NOy partitioning. The latter concentrations are typical val-ues of tropical UT air masses (TRACE-A measurements over the south Atlantic)
On the other hand, 1NOy
1CO2 (measured both in the UT
and the MT) is not conserved between plumes and this ra-tio in the MT plume is much higher than the UT plume (500 pptv/ppmv versus 25 pptv/ppmv). This is most proba-bly due to the fact that the UT air mass passed through a convective system with likely loss of HNO3(and other sol-uble gases and aerosols) by washout. Removal of HNO3by precipitation would also explain the high 11NONO
2 measured in
the UT plume compared to the MT plume (due to loss of NOy). Another phenomenon which could explain the high
1NO
1NO2 is lightning emissions of NO, but it does not explain
the low UT 1NOy
1CO2. Moreover NO in the UT plume is only
slightly above mean NO measured by the M55 at that alti-tude during the campaign and a stronger NO signal would be expected if there had been recent lightning emissions. There-fore LiNOxinfluence on the UT plume studied here cannot be completely excluded but it is unlikely. Finally, in order to estimate NOypartitioning in the UT plume, 11PANCO2 in the MT plume was used to derive UT PAN concentrations, NO2 concentrations were estimated using modelled NO2:NO ra-tios at steady state, and the rest of measured NOy (NOy – PAN – NO – NO2) was attributed to HNO3. All measured
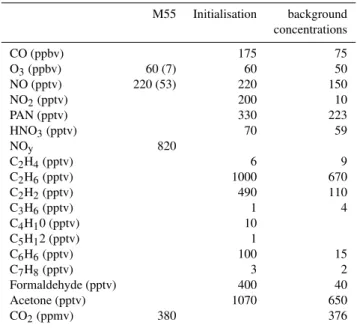
Table 2.Mean concentrations and standard deviations (in brackets) measured in the UT plume by the M55 aircraft. Concentrations used to initialised the box model calculation are given in the second column (see text for details). Background concentrations are taken from Jacob et al. (1996) (8–12 km).
M55 Initialisation background concentrations
CO (ppbv) 175 75
O3(ppbv) 60 (7) 60 50
NO (pptv) 220 (53) 220 150
NO2(pptv) 200 10
PAN (pptv) 330 223
HNO3(pptv) 70 59
NOy 820
C2H4(pptv) 6 9
C2H6(pptv) 1000 670
C2H2(pptv) 490 110
C3H6(pptv) 1 4
C4H10 (pptv) 10
C5H12 (pptv) 1
C6H6(pptv) 100 15
C7H8(pptv) 3 2
Formaldehyde (pptv) 400 40
Acetone (pptv) 1070 650
CO2(ppmv) 380 376
and estimated values used to initialise the runs are reported Table 2.
In order to evaluate the mixing time to background for the UT plume, we used the BOLAM tracer results at 200 hPa where, as mentioned previously, 32 daily tracers were used to represent the day to day transport of CO BB emissions. Three days were selected when there was injection of tracer at 200 hPa over eastern/central Africa followed by decay and no new injection for several days afterwards. Using the hy-pothesis of an exponential decrease in the concentration to-ward a background value, a mixing time of 6 to 9 days was calculated using the linear regression of the logarithm of the maximum tracer concentration in the centre of the uplifted (model) plume as a function of time. Therefore, in Run-MIX we estimated a mixing timescale of 7 days.
4.2.2 Results
160 180 200
140 120 220 240
400 800
100 200
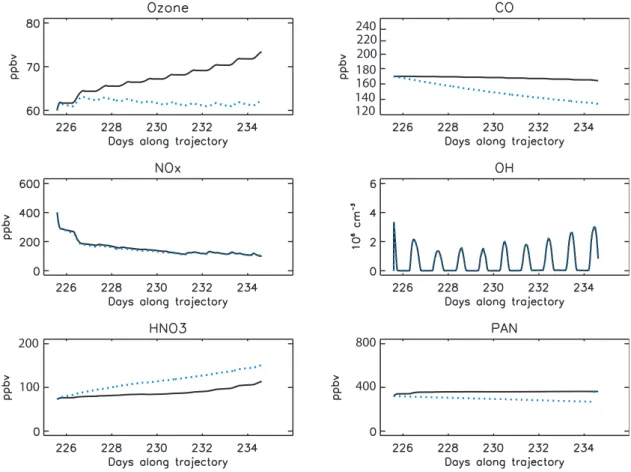
Fig. 13.10 days simulated concentrations in the UT plume in the case RUN-CHEM (black line) and RUN-MIXING (blue lines).
sensitivity test where the initial VOC concentrations were doubled. NPO3changes by only 10% whereas doubling NOx concentrations induces a NPO3increase of 40%. These re-sults show that the UT plume is NOxlimited, and therefore NPO3not very sensitive to initial VOC concentrations. The NOxare better constrained by the measurements.
Inclusion of mixing leads to decreases in O3 concentra-tions to around 60 ppbv whereas CO concentraconcentra-tions decrease by about 35 ppbv. Mean NPO3 only slightly decreases to 1.3 ppbv/day resulting in the maintenance of O3 concentra-tions despite mixing with lower background concentraconcentra-tions. The mean NPO3for the UT plume with mixing is about half that for the MT plume.
Sensitivity runs using different trajectories only showed small differences (not shown).
4.2.3 Comparison with previous studies
Our results present, as far as we know, some of the first es-timates of in-situ NPO3 in UT BB plumes based on anal-ysis of data. Other studies estimated O3 budget (without sources differentiation) over the South Atlantic using global models (Moxim and Levy, 2000) or measurements (Jacob et al., 1996). They estimated net O3production rates of 1.5– 2.1 ppbv/day in the UT over the south Atlantic. This number
5 Conclusions
In this study we examined the origin and downwind O3 pro-duction potential of pollutant plumes observed in the mid and upper troposphere over the southern coast of West Africa dur-ing August 2006 summer monsoon. Analysis of results from the BOLAM mesoscale model, including biomass burning CO tracers confirmed that the likely origin of the plumes was from biomass burning emission regions over central Africa. Model results showed BB pollutants confined over central Africa for between 12 days before being transported to the measurement region 4 days (MT plume) and 2 days (UT plume) later. According to the model both plumes are about 14 days old when measured over West Africa. The plumes observed in the mid troposphere had significantly higher pollutant concentrations than the plume observed in the upper troposphere. The mesocale model reproduces these differences and shows two different pathways for the plumes at the different altitudes: transport to the north-east of the fire region, moist convective uplift and transport to West Africa driven by the tropical easterly jet for the upper tropo-spheric plume; north-west transport from the emission region to the Gulf of Guinea for the middle tropospheric plume. The UT:MT ratio of tracer concentrations at 600 hPa and 250 hPa was estimated to around 0.42 for the period 14–15 August in the region of the measurements which agrees well with the ratio derived from observed CO2 enhancements in the plumes. Lower pollutant concentrations in the UT are mainly due to more dilution with cleaner air masses during upward transport. The same UT:MT fraction was evaluated over a larger period: 1–15 August and a mean value of 0.6 was sim-ulated showing that even if injection of pollutants into the UT over West Africa is less frequent and plumes more diluted, it is significant, at least in the studied period (August 2006). This fraction is higher than previously suggested (Mari et al., 2008).
Net O3production downwind from West Africa was evalu-ated using a photochemical trajectory model initialized with the measurements. The mid-tropospheric plume was trans-ported over the equatorial south Atlantic between 1.5 and 6 km. Simulations show that transport altitude strongly influ-ences the resulting net O3production in the plume. Whereas below 2 km a net O3destruction was simulated, above 3 km, the plume produced O3 with a mean rate of 2.6 ppbv/day over 10 days. During the first few days, this production even reached 7 ppbv/day. Our estimates of net O3production rates are higher than previously reported for aged BB plumes (16– 26 days old here). We show that this net production is not di-rectly due to transport of NO2but to NO2recycling by NO2 reservoir species: PAN and HNO3, which contribute equally. Model runs including the impact of aerosols on photolysis rates show that their main effect is to delay the maximum in O3downwind. This process may explain why previous stud-ies estimated lower NPO3compared to this study. Given the possibility that aged BB plumes transported over the Atlantic
could be still very photochemically active, it is likely that this source is making a significant contribution (more than previ-ously estimated) to O3levels in the MT. According to simu-lated occurrence of such transport, BB may even be the main source for O3enhancement in the equatorial south Atlantic MT, at least in August 2006. Slower net O3production rates and lower O3concentrations were simulated in the UT plume together with lower occurrence of transport.
In this study, we have focused on estimating in-situ O3 production rates in a plume of BB origin. In order to un-derstand the contribution from different O3 sources to the O3maximum observed over the southern Atlantic it will be necessary to perform similar calculations for other important sources, and especially plumes influenced by LiNOx. Indeed, even if simulated plume may not be representative of the more polluted BB plume in the UT, it seems that BB plumes are not the dominant source of O3production in the UT. As suggested in previous studies LiNOx is probably more im-portant to explain the UT maximum but this study show that BB may dominate the MT maximum. It would be interesting to estimate the importance of the MT maximum versus the UT maximum over the equatorial south Atlantic. According to Thouret et al. (2009) it may depend on the month of the year (with a maximum MT signal in August, equivalent to the UT signal). Simulations with a global chemistry model including aerosol impacts would be necessary to precisely and quantitatively estimate BB contribution to the O3 maxi-mum.
Acknowledgements. Based on a French initiative, AMMA was built by an international scientific group and is currently funded by a large number of agencies, especially from France, the United King-dom, the United States, and Africa. It has been a beneficiary of a major financial contribution from the European Community Sixth Framework Programme (AMMA-EU). Detailed information on sci-entific coordination and funding is available on the AMMA In-ternational website at http://www.amma-inIn-ternational.org/rubrique. php3?id rubrique=1.
The DF-20 campaign was funded partly through AMMA-EU. The M55-Geophysica campaign was funded by AMMA-EU, EC Integrated Project SCOUT-O3 (505390-GOCE-CT-2004), CNRS-INSU, CNES, EUFAR and the M55 aircraft consortium. We would like to thank all the scientists aircraft operators as well as local scientists and representatives in Burkina Faso for their help and support during the planning and execution of the Ouagadougou campaign. We also acknowledge support from the AMMA Oper-ations Centre in Niamey, Niger.
The B-146 campaign was funded in part by AMMA-EU and also through a NERC AMMA-UK consortium grant. We also acknowledge B-146 data provided by the Facility for Airborne Atmospheric Measurements (FAAM) and the British Atmospheric Data Centre (BADC). E. Real acknowledges funding from the AMMA-EU.
The publication of this article is financed by CNRS-INSU.
References
Ancellet, G., Leclair de Bellevue, J., Mari, C., Nedelec, P., Kukui, A., Borbon, A., and Perros, P.: Effects of regional-scale and con-vective transports on tropospheric ozone chemistry revealed by aircraft observations during the wet season of the AMMA cam-paign, Atmos. Chem. Phys., 9, 383–411, 2009,
http://www.atmos-chem-phys.net/9/383/2009/.
Andr´es-Hern´andez, M. D., Kartal, D., Reichert, L., Burrows, J. P., Meyer Arnek, J., Lichtenstern, M., Stock, P., and Schlager, H.: Peroxy radical observations over West Africa during AMMA 2006: photochemical activity in the outflow of convective sys-tems, Atmos. Chem. Phys., 9, 3681–3695, 2009,
http://www.atmos-chem-phys.net/9/3681/2009/.
Borrmann, S., Kunkel, D., Weigel, R., Minikin, A., Deshler, T., Wilson, J. C., Curtius, J., Shur, G. N., Belyaev, G. V., Law, K. S., and Cairo, F.: Aerosols in the tropical and subtropical UT/LS: in-situ measurements of submicron particle abundance and volatil-ity, Atmos. Chem. Phys. Discuss., 9, 24587–24628, 2009, http://www.atmos-chem-phys-discuss.net/9/24587/2009/. Burpee, R. W.: The origin and structure of easterly waves in the
lower troposphere of North Africa, J. Atmos. Sci., 29, 77–90, 1972.
Buzzi, A. and Foschini, L.: Mesoscale meteorological features as-sociated with heavy precipitation in the southern Alpine region., Meteorol. Atmos. Phys., 72, 131–146, 2000.
Cairo, F., Pommereau, J. P., Law, K. S., Schlager, H., Garnier, A., Fierli, F., Ern, M., Streibel, M., Arabas, S., Borrmann, S., Berthelier, J. J., Blom, C., Christensen, T., D’Amato, F., Di Don-francesco, G., Deshler, T., Diedhiou, A., Durry, G., Engelsen, O., Goutail, F., Harris, N. R. P., Kerstel, E. R. T., Khaykin, S., Konopka, P., Kylling, A., Larsen, N., Lebel, T., Liu, X., MacKen-zie, A. R., Nielsen, J., Oulanowski, A., Parker, D. J., Pelon, J., Polcher, J., Pyle, J. A., Ravegnani, F., Rivire, E. D., Robinson, A. D., R¨ockmann, T., Schiller, C., Sim˜oes, F., Stefanutti, L., Stroh, F., Some, L., Siegmund, P., Sitnikov, N., Vernier, J. P., Volk, C. M., Voigt, C., von Hobe, M., Viciani, S., and Yushkov, V.: An in-troduction to the SCOUT-AMMA stratospheric aircraft, balloons and sondes campaign in West Africa, August 2006: rationale and roadmap, Atmos. Chem. Phys., 10, 2237–2256, 2010,
http://www.atmos-chem-phys.net/10/2237/2010/.
Chatfield, R., Vastano, J. A., Singh, H. B., and G.Sachse: A general model of how fire emissions and chemistry produce African/oceanic plumes (O3 , CO, PAN, smoke) in TRACE-A, J. Geophys. Res., 101, 24279–24306, 1996.
Crutzen, P. J. and Andreae, M. O.: Biomass burning in the trop-ics: Impact on atmospheric chemistry and biogeochemical cy-cles, Science, 250, 1669–1678, 1990.
Evans, M. J., Shallcross, D. E., Law, K. S., Wild, J. O. F., Sim-monds, P. G., Spain, T. G., Berrisford, P., Methven, J., Lewis, A. C., McQuaid, J. B., Pillinge, M. J., Bandyf, B. J., Penkett, S. A., and Pyle, J. A.: Evaluation of a Lagrangian box model using field measurements from EASE (Eastern Atlantic Summer Experiment) 1996, Atmos. Environ., 34, 3843–3863, 2000. Fueglistaler, S., Dessler, A. E., Dunkerton, T. J., Folkins, I., Fu, Q.,
and Mote, P. W.: Tropical tropopause layer, Rev. Geophys., 47, RG1004, doi:8755–1209/09/2008RG000267, 2009.
Haywood, J. M., Osborne, S. O., Francis, P. N., Keil, A., Formenti, P., Andreae, M. O., and Kaye, P. H.: The mean physical and optical properties of regional haze dominated by biomass burning aerosol measured from the C-130 aircraft during SAFARI 2000, J. Geophys. Res., 108, 8473, doi:10.1029/2002JD002226, 2003. Heald, C. L., Jacob, D. J., Fiore, A. M., Emmons, L. K., Gille, J. C., Deeter, M. N., Warner, J., Edwards, D. P., Crawford, J. H., Hamlin, A. J., Sachse, G. W., Browell, E. V., Avery, M. A., Vay, S. A., Westberg, D. J., Blake, D. R., Hanwant, B., Sandholm, S. T., Talbot, R. W., and Fuelberg, H. E.: Asian outflow and trans-Pacific transport of carbon monoxide and ozone pollution: An integrated satellite, aircraft, and model perspective., J. Geophys. Res., 108, 4804, doi:10.1029/2003JD003 507, 2004.
Jacob, D. J., Heikes, B. G., Fan, S.-M., Logan, J. A., Mauzerall, D. L., Bradshaw, J. D., Singh, H. B., Gregory, G. L., Talbot, R. W., Blake, D. R., W., G., and Sachse: Origin of ozone and NOx in the tropical troposphere: A photochemical analysis of aircraft observations over the South Atlantic basin, J. Geophys. Res., 101, 24235–24250, 1996.
Janicot, S., Thorncroft, C. D., Ali, A., Asencio, N., Berry, G., Bock, O., Bourles, B., Caniaux, G., Chauvin, F., Deme, A., Kergoat, L., Lafore, J.-P., Lavaysse, C., Lebel, T., Marticorena, B., Mounier, F., Nedelec, P., Redelsperger, J.-L., Ravegnani, F., Reeves, C. E., Roca, R., de Rosnay, P., Schlager, H., Sultan, B., Tomasini, M., Ulanovsky, A., and ACMAD forecasters team, : Large-scale overview of the summer monsoon over West Africa during the AMMA field experiment in 2006, Ann. Geophys., 26, 2569– 2595, 2008,
http://www.ann-geophys.net/26/2569/2008/.
Jenkins, G. S. and Ryu, J.-H.: Space-borne observations link the tropical atlantic ozone maximum and paradox to lightning, At-mos. Chem. Phys., 4, 361–375, 2004a,
http://www.atmos-chem-phys.net/4/361/2004/.
Jenkins, G. S. and Ryu, J.-H.: Linking horizontal and vertical trans-ports of biomass fire emissionsto the tropical Atlantic ozone paradox during the Northern Hemisphere winter season: clima-tology, Atmos. Chem. Phys., 4, 449–469, 2004b,
http://www.atmos-chem-phys.net/4/449/2004/.
Jenkins, G. S., Camara, M., and Ndiaye, S. A.: Observational ev-idence of enhanced middle/upper tropospheric ozone via con-vective processes over the equatorial tropical Atlantic dur-ing the summer of 2006, Geophys. Res. Lett., 35, L12806, doi:10.1029/2008GL033 954, 2008.
Kain, J.: The KainFritsch convective parameterization: An update., J. Appl. Meteorol., 43, 170–181, 2004.
Liousse, C.: African Aerosols Modeling during the EOP-AMMA campaign with updated biomass burning emission inventories, Atmos. Chem. Phys. Discuss., in preparation, 2010.
Malguzzi, P., Grossi, G., Buzzi, A., Ranzi, R., and Buizza, R.: The 1966 century flood in Italy: A meteorological and hydrological revisitation., J. Geophys. Res., 111, D24106, doi:10.1029/2006JD007111, 2006.
Mari, C. H., Cailley, G., Corre, L., Saunois, M., Atti´e, J. L., Thouret, V., and Stohl, A.: Tracing biomass burning plumes from the Southern Hemisphere during the AMMA 2006 wet season experiment, Atmos. Chem. Phys., 8, 3951–3961, 2008, http://www.atmos-chem-phys.net/8/3951/2008/.
Mauzerall, D. L., Logan, J. A., Jacob, D. J., Anderson, B. E., Blake, D. R., Bradshaw, J. D., Haikes, B., Sachse, G. W., Singh, H., and Talbot, B.: Photochemistry in biomass burning plumes and implications for tropospheric ozone over the tropical South At-lantic, J. Geophys. Res., 103, 8401–8423, 1998.
Mishchenko, M. I., Goegdzhayev, I., Cairns, B., Rossow, W. B., and Lacis, A. A.: Aerosol retrievals over the ocean by use of chan-nels 1 and 2 AVHRR data: sensitivity analysis and preliminary results, Appl. Optics, 38, 7325–7341, 1999.
Moxim, W. J. and Levy, H.: A model analysis of the tropical South Atlantic Ocean tropospheric ozone maximum: The interaction of transport and chemistry, J. Geophys. Res., 105, 17393–17416, 2000.
Neuman, J. A., Parrish, D. D., Trainer, M., Ryerson, T. B., Hol-loway, J. S., Nowak, J. B., Swanson, A., Flocke, F., Roberts, J. M., Brown, S. S., Stark, H., Sommariva, R., Stohl, A., Peltier, R., Weber, R., Wollny, A. G., Sueper, D. T., Hubler, G., and Fehsenfeld, F. C.: Reactive nitrogen transport and photochem-istry in urban plumes over the North Atlantic Ocean, J. Geophys. Res., 111, D23S54, doi:10.1029/2005JD007 010, 2006. Nicholson, S. E. and Grist, J.: The seasonal evolution of the
at-mospheric circulation over West Africa and Equatorial Africa, J. Clim, 16, 1013–1030, 2003.
Park, S., Jim´enez, R., Daube, B. C., Pfister, L., Conway, T. J., Got-tlieb, E. W., Chow, V. Y., Curran, D. J., Matross, D. M., Bright, A., Atlas, E. L., Bui, T. P., Gao, R.-S., Twohy, C. H., and Wofsy, S. C.: The CO2tracer clock for the Tropical Tropopause Layer, Atmos. Chem. Phys., 7, 3989–4000, 2007,
http://www.atmos-chem-phys.net/7/3989/2007/.
Proceedings of the Fourteenth International TOVS Study Confer-ence ConferConfer-ence; Beijing, China, RTTOV-8 the latest update to the RTTOV model., 21–31 May 2005, 2005.
Real, E., Law, K. S., Wienzierl, B., Fiebig, M., Petzold, A., Wild, O., Methven, J., Arnold, S., Stohl, A., Huntrieser, H., Roiger, A., Schlager, H., Stewart, D., Avery, M., Sachse, G., Brow-ell, E., Ferrare, R., and Blake, D.: Processes influencing ozone levels in Alaskan forest fires plumes during long-range trans-port over the North Atlantic, J. Geophys. Res., 112, D10S41, doi:10.1029/2006JD007 576, 2007.
Real, E., Law, K. S., Schlager, H., Roiger, A., Huntrieser, H., Methven, J., Cain, M., Holloway, J., Neuman, J. A., Ryerson, T., Flocke, F., de Gouw, J., Atlas, E., Donnelly, S., and Parrish, D.: Lagrangian analysis of low altitude anthropogenic plume pro-cessing across the North Atlantic, Atmos. Chem. Phys., 8, 7737– 7754, 2008,
http://www.atmos-chem-phys.net/8/7737/2008/.
Reeves, C. E., Formenti, P., Afif, C., Ancellet, G., Attie, J.-L., Bechara, J., Borbon, A., Cairo, F., Coe, H., Crumeyrolle, S., Fierli, F., Flamant, C., Gomes, L., Hamburger, T., Lambert, C., Law, K. S., Mari, C., Matsuki, A., Methven, J., Mills, G. P., Minikin, A., Murphy, J. G., Nielsen, J. K., Oram, D. E., Parker, D. J., Richter, A., Schlager, H., Schwarzenboeck, A., and Thouret, V.: Chemical and aerosol characterisation of the tropo-sphere over West Africa during the monsoon period as part of AMMA, Atmos. Chem. Phys. Discuss., 10, 7115–7183, 2010, http://www.atmos-chem-phys-discuss.net/10/7115/2010/. Remer, L., Kaufman, Y. J., Tanre, D., Mattoo, S., Chu, D. A.,
Mar-tins, J. V., Li, R. R., Ichoku, C., Levy, R. C., Kleidman, R. G., Eck, T. F., Vermote, E., and Holben, B. N.: The MODIS Aerosol Algorithm, Products, and Validation, J. Atmos. Sci., 62, 947– 973, 2005.
Sauvage, B., Thouret, V., Cammas, J.-P., Gheusi, F., Athier, G., and N´ed´elec, P.: Tropospheric ozone over Equatorial Africa: regional aspects from the MOZAIC data, Atmos. Chem. Phys., 5, 311– 335, 2005,
http://www.atmos-chem-phys.net/5/311/2005/.
Sauvage, B., Thouret, V., Thompson, A. M., Witte, J. C., Cam-mas, J.-P., Nedelec, P., and Athier, G.: Enhanced view of the tropical Atlantic ozone paradox and zonal wave one from the in situ MOZAIC and SHADOZ data, J. Geophys. Res., 11, 1301, doi:10.1029/2005JD00 624, 2006.
Sauvage, B., Martin, R. V., van Donkelaar, A., and Ziemke, J. R.: Quantification of the factors controlling tropical tropospheric ozone and the South Atlantic maximum, J. Geophys. Res., 112, 11309, doi:10.1029/2006JD008 008, 2007a.
Sauvage, B., Thouret, V., Cammas, J.-P., Brioude, J., Ndlec, P., and Mari, C.: Meridional ozone gradients in the African upper troposphere, Geophys. Res. Lett., 34, 3817, doi:10.1029/2006GL028 542, 2007b.
Stohl, A., Wotawa, G., Seibert, P., and Kromp-Kolb, H.: Interpo-lation errors in wind fields as a funcion of spatial and temporal resolution and their impact on different types of kinematic tra-jectories, J. Appl. Meteorol., 34, 2149–2165, 1995.
Tanre, D., Kaufman, Y., Herman, M., and Mattoo, S.: Remote sens-ing of aerosol properties over oceans ussens-ing the MODIS sol EOS spectral radiances, J. Geophys. Res., 102, 16971–16988, 1997. Thompson, A., Diab, R. D., Bodeker, G. E., Zunckel, M.,
Coet-zee, G. J. R., Archer, C. B., McNamara, D. P., Pickering, K. E., Combrink, J., Fishman, J., and Nganga, D.: Ozone over south-ern Africa during SAFARI-92/TRACE A, J. Geophys. Res., 101, 23793–23807, 1996a.
Thompson, A. M., Pickering, K. E., McNamara, D. P., M. R. Schoe-berl, R. D. H., Kim, J. H., Browell, E. V., Kirchhoff, V. W. J. H., and Nganga, D.: Where did tropospheric ozone over southern Africa and the tropical Atlantic come from in October 1992? In-sights from TOMS, GTE/TRACE-A, and SAFARI-92, J. Geo-phys. Res., 101, 24251–24278, 1996b.
Thouret, V., Saunois, M., Minga, A., Mariscal, A., Sauvage, B., So-lete, A., Agbangla, D., N´ed´elec, P., Mari, C., Reeves, C. E., and Schlager, H.: An overview of two years of ozone radio sound-ings over Cotonou as part of AMMA, Atmos. Chem. Phys., 9, 6157–6174, 2009,
Voigt, C., Schlager, H., Roiger, A., Stenke, A., de Reus, M., Bor-rmann, S., Jensen, E., Schiller, C., Konopka, P., and Sitnikov, N.: Detection of reactive nitrogen containing particles in the tropopause region – evidence for a tropical nitric acid trihydrate (NAT) belt, Atmos. Chem. Phys., 8, 7421–7430, 2008,
http://www.atmos-chem-phys.net/8/7421/2008/.
Weller, R., Lilischkis, R., Schrems, O., Neuber, R., , and Wessel, S.: Vertical ozone distribution in the marine atmosphere over the central Atlantic Ocean (56◦S–50◦N), J. Geophys. Res., 101,
1387–1400, 1996.