Ch a rge Ch a ra cte riza tio n Of An
Ele ctrica lly Ch a rge d Fib e r Via
Ele ctro s ta tic Fo rce Micro s co p y
Joyoun Kim², Warren J. Jasper², Juan P. Hinestroza¹,
¹Cornell University, Department of Fiber Science and Apparel Design, Ithaca, New
York USA, ²North Carolina State University, Department of Textile Engineering,
Chemistry & Science, Raleigh, North Carolina USA
Correspondence to:
Juan P. Hinestroza, Ph.D. email:
[email protected]
__________________________________________________________________
ABSTRACT
The charge of a corona charged electret fiber as well as an uncharged glass fiber was
characterized via Electrostatic Force Microscopy (EFM). Electrostatic force gradient images were obtained by monitoring the shifts in phase between the oscillations of the biased EFM cantilever and those of a piezoelectric driver. EFM measurements were performed using
noncontact scans at a constant tip-sample separation of 75 nm with varied bias voltages applied to the cantilever. A mathematical expression, based on the Coulombic and induced polarization effects, were used to model the EFM phase shifts as a function of the applied tip bias voltages. There was quantitative agreement between the experimental data and the mathematical
expression, and the quantitative interpretation for charges on the fiber was made.
INTRODUCTION
Corona charged electret fibers are commonly used in filtration media since they exhibit improved filtration performance, due to the presence of the electrostatic attraction as an
electrical resistance is high, so that the resulting material would show good charge stability and a low probability of electron exchange through or across the material.
Several experimental studies have illustrated that the filtration performance of electret filter media may dramatically decrease when exposed to liquid organic solvents commonly used in industry applications
[1-6]. It has been suggested that the reduction in filtration performance may be attributed to the charge deterioration of the electret filter media. However, only indirect measurements of charge deterioration, mainly obtained via filtration performance experiments, appear to support this theory.
Electrostatic Force Microscopy (EFM) has been extensively used to provide local information of the electric properties of materials, using a conductive probe to map the attractive and repulsive forces between the tip and the sample. During EFM measurements, two-pass scans are conducted in order to minimize the topography effects on the electrostatic force gradient signal. At the first pass, topographical profile of the specimen is obtained by intermittent contact of the tip with the surface of the sample. The tip is then lifted to a predetermined height, and the second scan is performed at a constant separation between the biased tip and the surface of the fiber. The tip-sample separation is maintained constant by following the topographical profile of the tip-sample. The conductive tip is biased during the second scan, and the interaction between the biased tip and the sample influences the oscillation phase of the vibrating cantilever. Variations in phase shifts are then detected and processed to generate electrostatic force gradient images [7-12]. The tip-surface interaction is known to depend on not only the electric properties but also the geometries of the tip and the sample surface. Furthermore, the effect of geometry of the tip or the surface depends on the tip-sample separation distance. Hence, a sample with a well-defined geometry such as planar surface may be preferred as an EFM sample candidate. For dielectric materials, the electrostatic interaction between the tip and the sample is even more complicated since the total force will be contributed by not only the tip-induced polarization image charges but also the surface / volume trapped charges [10]. With these complications, the EFM
application on the charged polypropylene fiber would be a challenge, for its non-planar geometry and its dielectric properties.
The purpose of this study is to demonstrate the feasibility of using the electrostatic force gradient imaging as an analytical tool to monitor charge in electrically charged fiber, and to probe the solvent-induced charge deterioration of the electret fiber. EFM phase measurements were performed on the electret fibers prior to and post liquid isopropanol exposure. Uncharged glass fiber was also investigated as an example of uncharged polymeric fiber. A mathematical expression that accounted for both the Coulombic interaction and the induced polarization was used for quantitative interpretation of the EFM phase results.
EXPERIMENTAL APPROACH
Materials and equipment. An uncharged mechanical filter media and a corona charged electret
filter media were obtained from commercially available filter media used for particulate
isopropanol (IPA) was obtained from Sigma-Aldrich (St. Louis, Mo) and used as received. EFM experiments were performed using a Dimension 3000 Atomic Force Microscope equipped with a Nanoscope III controller and an Extender Electronics Module (Veeco Instruments, Santa
Barbara, CA). SCM-PIT antimony (n) doped silicon cantilevers coated with a 20 nm layer of Pt/Ir were obtained from Veeco Instruments. The cantilevers had an irregular pyramidal shape with front, back and side angles of 25 ± 2.5°, 15± 2.5° and 22.5° ± 2.5° respectively. The length of the cantilevers was 220 ± 10 m. The tip height was 12.5 ± 2.5 m and the tip radius of curvature was 22.5 ± 2.5 nm. The spring constant of the cantilever was in the range of 1 to 5 N/m, with nominal value of 2.8 N/m. The resonance frequency of the cantilever was measured to be 62 ± 2 kHz. The quality factor of the tip was 186 ± 8.
EFM experiments.Three sets of samples were analyzed: M, E and E-IPA. M samples were taken
from the uncharged mechanical filter media as received. E samples were taken from the electret filter media as received. E-IPA samples were obtained by immersing E samples into liquid IPA for 2 minutes, removing the excess solvent, and allowing the samples to dry overnight under ambient conditions. Individual fibers were separated from the filter media and laid on a 137DM-2 double sided tape (3M, St. Paul, MN) that was attached to a microscope glass slide (Fisher Scientific, Pittsburgh, PA). The prepared samples were placed on a grounded steel sample holder of the EFM instrument.
A tip-sample separation distance of 75 nm was chosen in order to minimize the effect of the van der Waals forces between the tip and the sample while allowing the monitoring of the long range electrostatic forces. Electrostatic force gradient images were obtained by monitoring the shifts in phase between the oscillations of the biased EFM cantilever and those of the piezoelectric driver as a function of bias voltages applied to the cantilever. A minimum of 10 linescans were
obtained for each value of bias voltage applied to the cantilever.
THEORETICAL ANALYSIS
Quantification of the electrostatic tip-surface interaction is known to be complex specifically for dielectric materials as induced polarization image charges as well as surface / volume trapped charges may influence the total force experience by the tip [10]. The fundamental relationship for the phase shift in a driven, damped harmonic oscillator can be described as follows [8, 13, 14].
dz dF k Q
− =
ΔΦ (1)
where ΔΦ is phase shift of the resonant peak [radians]
Q is the quality factor of the cantilever [dimensionless],
k is the spring constant of the cantilever [N/m]
z is the distance between the tip of the cantilever and the sample [m]
The force between the biased tip and a charged dielectric sample can be explained as a contribution of two phenomena; a Coulombic interaction (attraction or repulsion between the biased tip and the sample) and an induced polarization due to the biased tip (attraction between the biased tip and the sample). If a one-dimensional system is considered, Coulombic Force, FC, due to the presence of charge on the surface of the sample can be described as:
FC = qf
(
)
z V Vtip − 0
(2)
where FC is the force due to the presence of charge on the sample surface [N]
qf is the fiber charge [C]
Vtipis the tip bias voltage [V]
V0is the voltage due to the charge in the sample [V]
Most dielectric materials including polypropylene become polarized when they are placed in an external electric field, and the degree of polarization is proportional to the electric field. The force, FP, due to the induced polarization (by the probe), in the z direction, can be described as follows:
FP =
dz dE E dz dE
P =α (3)
FP = ⎟⎟
⎠ ⎞ ⎜⎜ ⎝ ⎛ ⎟⎟ ⎠ ⎞ ⎜⎜ ⎝ ⎛ z V dz d z
Vtip tip
α
FP = 2 3
1
z Vtip
α
− (4)
where FP is the force due to induced polarization [N]
P is the induced dipole moment by the electric field [C·m] is the electric polarizability of the material [C2m/N]
E is the electric field by the induced polarization [N/C or V/m]
Combining equation 2 and 4, we obtain the force gradient in the z direction as:
(
)
4 2 2 0 1 3 z V z V V q dz dF tip tipf + α
− −
= (5)
V baseline. Incorporating equation 5 into equation 1 and considering this artificial offset, the final expression to correlate the phase shift to the applied bias voltage becomes:
⎟⎟ ⎠ ⎞ ⎜⎜ ⎝ ⎛ + − − = ΔΦ 2 4 2 3 tip tip f V z V z q k Q α (6)
Since the EFM experiments presented in this study were performed at a constant sample-tip separation z, equation 6 can be simplified as equation 7.
2 2 1 tip p tip pV C V
C +
=
ΔΦ (7)
where p qf kz
Q C
2
1 = [V
-1 or C/Nm]
(8) 4 2 3 z k Q
Cp =− α [V-2] (9)
In equation 7, Cp1 and Cp2 are functions of the sample charge and the electric polarizability of the specimen respectively. Equation 7 will be used as the analytical expression to describe the experimental data obtained by monitoring the phase shifts.
RESULTS AND DISCUSSION
4.1. EFM measurements
During the EFM measurements, the long-range electrostatic forces shift the resonance frequency of the oscillating cantilever. Changes in cantilever resonant frequency due to the presence of a force gradient are then detected by monitoring changes in the phase shift or contrast in the
electrostatic force gradient image [10]. Attractive forces reduce the cantilever’s frequency, which can be monitored by the negative phase shift or the dark contrast in the electrostatic force
gradient image. Likewise, the bright contrast in the EFM images corresponds to a positive phase shift or increase in the resonant frequency, reflecting the repulsive interaction between the cantilever and the specimen.
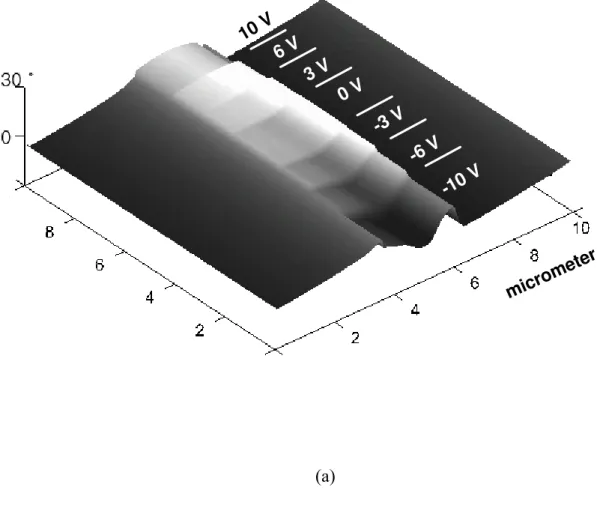
Linescan images of the uncharged glass fiber (M) used for the mechanical filter media is shown in Figure 1. Tip bias voltages were varied from -10 to 10 V at a constant tip-sample separation of 75 nm. Figure 1(a) shows the topographical profile obtained in the first scan and Figure 1(b)
(Figure 1(b)) while the topographical image is not affected by it (Figure 1(a)). Figure 1(c)
presents a cross section of the force gradient image to better illustrate and quantify the evolution of phase shift values as a function of bias voltage applied to the tip. It can be observed that the application of either sign of tip voltages caused a movement in the phase shift to negative values, i.e., attractive forces. The attractive interactions at both sign of tip voltages are due to the
dominant effect of the induced polarization. The higher the tip voltages in either sign, the greater the phase shifts due to the increased effect of induced polarization.
Figure 1. EFM images for an uncharged mechanical fiber specimen (M) as a function of applied tip bias voltage. (a) Topography (b) Electrostatic force gradient image, (c) Section of the
electrostatic force gradient image in phase shift.
1 0 V
6 V
3 V
0 V
- 3 V
- 6 V
- 10 V
mic r om
e te r
(b)
-0.6
0.2
Phase shi
ft
(
radi
ans
)
10V 6V 3V 0V -3V -6V -10V
75 nm ¡ ¾V
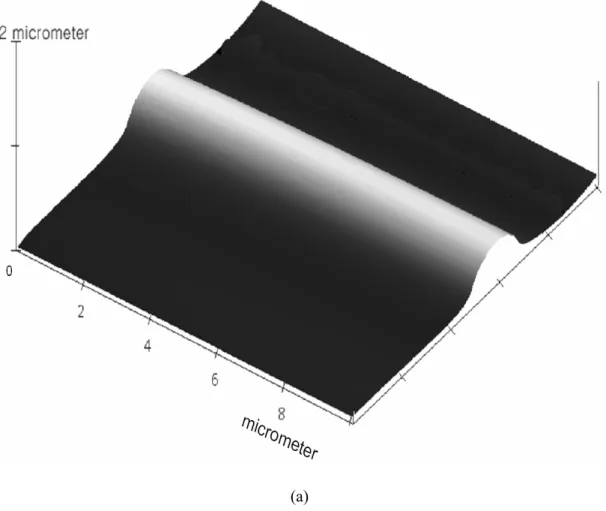
The EFM images of the corona charged electret fiber specimen (E) are shown in Figure 2. The topographical profile shown in Figure 2(a) was not changed regardless of varied tip bias
voltages. The electrostatic force gradient image in Figure 2(b) shows dissimilar contrast from the specimen M, in response to varied tip bias voltages. The contrast in the force gradient image appears brighter when the positive tip voltage was used, indicating repulsive interaction between the tip and the specimen. When negative bias voltages were applied to the tip, the line-scans become darker for the attractive interactions between the tip and the sample. In Figure 1(c), it can be observed that the application of negative voltages caused a movement in the phase shift to negative values (attractive force) while the application of a positive bias voltage caused a phase shift into positive territory (repulsive force). These phase shift results indicate that the specimen in Figure 1 is positively charged.
Figure 2. EFM images for an corona charged electret fiber specimen (E) as a function of applied tip bias voltage. (a) Topography (b) Electrostatic force gradient image, (c) Section of the
electrostatic force gradient image in phase shift.
10 V 6 V
3 V 0 V
-3 V
-6 V
-10 V
micr omete
r
(b)
(c)
-0 .5
0 .2
P
h
as
e s
h
if
t (
radi
a
ns
)
The EFM phase shift observation for the electret fiber after immersion in isopropanol (E-IPA) is shown in Figure 3. The phase shift behaviour of E-IPA is different from that exhibited by E, but appears similar to that of M. Like the uncharged specimen M, E-IPA experiences a negative phase shifts at either sign of tip voltages. That is to say: the tip only senses an attractive force that may be due to the dominant effect of induced polarization. This indicates that the charge of the electret fiber was reduced significantly after exposure to liquid isopropanol, to the extent that the sample behaves as a non-charged material, M.
Figure 3. EFM images for a corona charged electret fiber specimen after isopropanol immersion (E-IPA) as a function of applied tip bias voltage. (a) Topography (b) Electrostatic force gradient image, (c) Section of the electrostatic force gradient image in phase shift.
10 V 6 V
3 V 0 V
-3 V -6 V
-10 V
micrometer
(b)
-0 .1 0
0 .0 2
P
has
e s
h
if
t (
radi
ans
)
10V 6V 3V 0V -3V -6V -10V
4.2. Quantitative analysis
The average values of the experimental phase shifts as a function of tip bias voltage are shown in
Figure 4(a) through 4(c). The phase shift at 0 V was set to 0 radians, and the phase shifts at other bias voltages were compared to that of 0 V. The uncharged specimen M in Figure 4(a) shows the negative values of phase shifts at either sign of tip voltage compared to that at 0 V, which is attributed to the induced polarization effect. Equation 7 was used to interpret the phase shift experimental results as a function of applied tip bias voltage, using the least square fit to the experimental data. Equation 7 incorporates both the fiber charge effect represented by the
constant Cp1 and the induced polarization effect by the constant Cp2. The Cp1 value contributes to the shift of the curve, reflecting the presence of sample charge. Due to the negligible charge for M and the negligible value of Cp1, the curve in Figure 4(a) was not shifted much from the axis of 0 V of tip voltage. The curve for the uncharged sample is well described by the symmetrical parabola centered around a tip bias voltage of 0 V, indicating the presence of induced charge interactions [10].
The experimental phase values and the fit of equation 7 for E are shown in Figure 4(b). In the repulsive regime of positive tip bias voltages, the values of phase shift appear to increase as the voltage applied to the tip increases. However, a decrease in the repulsive response is noted at 10 V. The decrease in the repulsive response at the highest voltage may be attributed to the
increased effect of the induced polarization by the charged tip. Due to the original positive charges present in the fiber, the negatively induced charges on the fiber at positive tip voltages would compensate for the original positive charges in the specimen, reducing the magnitude of the repulsive interaction. Similarly, the induced polarization phenomena at negative tip voltages will add to the total attractive force between the tip and the specimen. Unlike the curve for the uncharged specimen M, the curve for E is shifted to right from the axis of 0 V of tip voltage, reflecting the significant value for Cp1and hence the presence of sample charges.
The electret sample E-IPA in Figure 4(c) shows the parabola centered on the 0 V axis, which is the similar trend as the phase shift of M. The negligible shift of the curve in E-IPA specimen indicates negligible charge of this specimen. It can be said that there occurred the charge
Figure 4. Phase shift values as a function of bias voltage applied to the tip for (a) M, (b) E, (c) E-IPA. Experimental values _____ Best fit of equation 7
-0.5
-0.4
-0.3
-0.2
-0.1
0.0
-15
-10
-5
0
5
10
15
Applied Tip Bias Voltage [V]
P
h
as
e S
h
if
t [
R
adians
]
-0.4 -0.3 -0.2 -0.1 0.0 0.1
-15 -10 -5 0 5 10 15
Applied Tip Bias Voltage [V]
P
hase Shi
ft [R
adi
a
ns
]
(b)
-0.08 -0.06 -0.04 -0.02 0.00
-15 -10 -5 0 5 10 15
Applied Tip Bias Voltage [V]
P
has
e S
h
if
t [
R
adi
a
ns
]
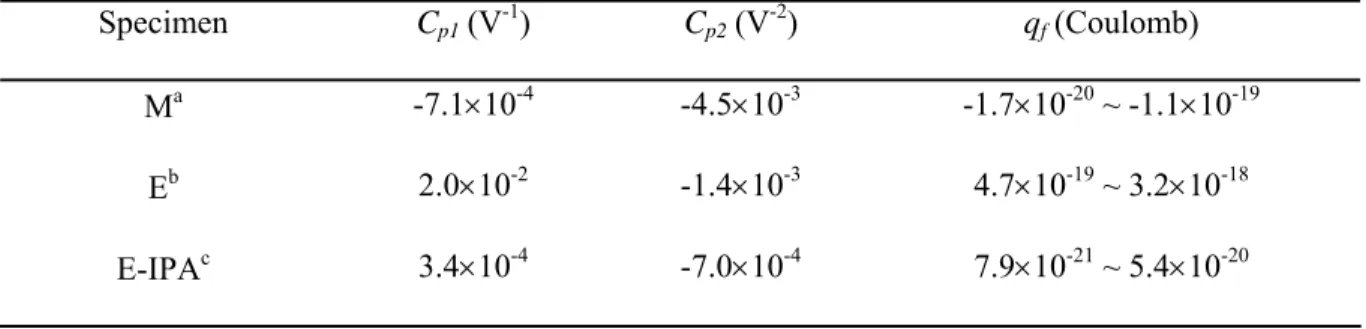
The values of the constants Cp1, Cp2 in equation 7 were determined by using the least square fit to the experimental data, and the best fit values are summarized in Table 1 in two significant
figures. According to equation 8 and equation 9, Cp1 is proportional to the charge in the fibre, and Cp2 describes the induced polarization. It can be observed that the value of Cp1 for E is considerably greater than that for E-IPA or M. A smaller Cp1 for E-IPA indicates that the charge of the electret fiber was considerably deteriorated after exposure to liquid isopropanol. This observation is in agreement with previously reported experiments that used filtration
performance tests to indirectly determine the presence or absence of charge in filter media [1-6]. It is thought that the charged ions are "frozen" in place in corona charged polypropylene fibers. If the organic solvent has enough affinity to be absorbed in polypropylene, charge deterioration may follow plasticization of the polypropylene by liquid organic solvents (IPA), which increases charge mobility and loss.
Theoretically, the value of the charges qf in the sample can be roughly estimated from the values of Cp1 as in equation 8. Approximations of the charges of the specimens are shown in Table 1. However, due to the complexities caused by the tip and sample’s geometries, the model cannot provide an exact value of the localized charge inside the fiber [12, 16-18]. Nevertheless, the quantitative agreement of the model with the experimental data shows the feasibility of EFM application to measure the charges of polymeric material at micro scale.
Table 1. Best fit values for constants in equation 7.
Specimen Cp1 (V-1) Cp2 (V-2) qf (Coulomb)
Ma -7.1×10⁻⁴ -4.5×10⁻³ -1.7×10⁻²⁰ ~ -1.1×10⁻¹⁹
Eb 2.0×10⁻² -1.4×10⁻³ 4.7×10⁻¹⁹ ~ 3.2×10⁻¹⁸
E-IPAc 3.4×10⁻⁴ -7.0×10⁻⁴ 7.9×10⁻²¹ ~ 5.4×10⁻²⁰
a Uncharged mechanical filter fiber specimen.
b Corona charged electret filter fiber specimen.
c Corona charged electret filter fiber specimen after immersion in liquid isopropanol.
CONCLUSIONS
The charges of the fibers used for filtration media were characterized via EFM phase
polarization effect for the uncharged materials. The observations of dissimilar phase shifts in E and E-IPA indicate that the charges in the electret fiber were indeed reduced after exposure to liquid isopropanol.
A simple mathematical expression incorporating the Coulombic term and the induced polarization term was used to interpret the phase measurements. There was quantitative agreement between the experimental values and the mathematical curve. The value of the constant Cp1 that accounts for Coulombic interaction was found to be considerably smaller for E-IPA than E, confirming the fact that the charge of electrically charged fiber was significantly deteriorated after isopropanol immersion.
The value of the best fit constant Cp1 was further used for the approximation of charges in the samples. The EFM application in this study showed the feasibility of using this technique to measure charges of this type of material at the micro scale. However, using a sample surface with well-defined geometry would be required for more reliable and accurate quantification of charges using this technique. The EFM application may also be useful to visualize the spatial distribution of the charges on the materials at nano scale.
ACKNOWLEDGEMENTS
The authors acknowledge the financial support of the CDC-NIOSH through GRANT 200-2003-01244. Special thanks are extended to the Analytical Instrument Facility at North Carolina State University for access to the Electric Force Microscopy equipment.
REFERENCES
1. Chen C C and Huang S H 1998 Am.Ind. Hyg. Assoc. J.59 227-233
Press.
8. Said R A 2001 J.Phys. D: Appl.Phys.34 L7-L10
9. Oksana C, Chen L, Weng V, Yuditsky L and Brus L 2003 J.Phys.Chem.B107 1525-1531 2. Lehtimäki M and Heinonen K 1994 Build.Environ.29 353-355
3. Martin S B and Moyer E S 2000 Appl. Occup.Environ. Hyg.15 609-617
4. Chen C, Lehtimäki M and Wileke K 1993 Am.Ind.Hyg.Assoc.J.54 51-54
5. Biermann A, Lum B and Bergman W 1982 Proceedings of the 17th DOE Nuclear Air
Cleaning Conference, Denver, CO
6. Jasper W, Hinestroza J, Mohan A, Kim J, Shiels B, Gunay M, Thompson D and Barker R 2006 J.Aerosol Sci.In Press.
10. Bonnell D. 2000 Scanning Probe Microscopy and Spectroscopy New York: Wiley-VCH
14 332-340
gy 15 627-634
7. Gomez-Monivas S, Froufe-Perez L S, Caamano A J and Saenz J J 2001 Appl.Phys.Lett.79
8. Belaidi S, Girad P and Leveque G 1997 J.Appl.Phys.81 1023-1030
d Apparel Design 42 Martha Van Rensselaer Hall
haca, New York 14853 USA
niversity
hemistry & Science 401 Research Drive
aleigh, North Carolina 27695 USA
11. Girad P 2001 Nanotechnology12 485-490
12. Gil A, Colchero J, Gomez-Herrero J and Baro A M 2003 Nanotechnology
13. Chu J, Itoh T, Lee C and Suga T 1997 J.Vac. Sci. Technol.B15 1551-1555
14. Lei C, Das A, Elliott M and Macdonald J 2003 Appl.Phys.Lett.83 482-484
15. Lei C, Das A, Elliott M and Macdonald J 2004 Nanotechnolo
16. Sacha G M and Saenz J J 2004 Appl.Phys.Lett.85 2610-2612
1
4048-4050
1
AUTHORS ADDRESS
Juan P. Hinestroza, Ph.D.
Cornell University
Department of Fiber Science an 2
It
Joyoun Kim, Ph.D., Warren J. Jasper,Ph.D.
North Carolina State U
Department of Textile Engineering, C 2