pISSN 1899-5241 eISSN 1899-5772
Journal of Agribusiness
and Rural Development
www.jard.edu.pl
4(30) 2013, 231-242
Copyright © Wydawnictwo Uniwersytetu Przyrodniczego w Poznaniu
SELECTED FEATURES OF POLISH FARMERS
Grzegorz Spychalski
Politechnika Koszali ska
Abstract. The paper presents results of the research carried out among farm owners in Wielkopolskie voivodeship referring to selected features of social capital. The author identifies and estimates impact of some socio-professional factors on social capital quality and derives statistical conclusion. As a result there is a list of economic policy measures facilitating rural areas development in this aspect. The level of education, civic activity and tendency for collective activity are main conditions of social capital quality in Polish rural areas.
Key words: Social capital, rural areas, farmers.
INTRODUCTION
Current economic systems are developing on the basis of competitive processes where enterprises possess such assets which are often not easily measured and intangi-ble. Apart from fixed assets created in investment activity and financial resources safe-guarding operating fluency, the key to achieve competitive position is intellectual capi-tal.
Intellectual capital is structurally formed from three elements: – human capital – bound up with labour capacity,
– structural capital (institutional) resulting from the environment and enterprises’ organisational structures,
– social capital forming interpersonal relations based on trust and civic engagement.
From the macroeconomic point of view social capital is perceived as the source of strategic competitiveness and due to specific features becomes the subject of social-economic research [Fukuyama 1997]. This component of intellectual capital is of spe-cial importance in sectors and parts of economy which are subject to change. Such parts of economic system undoubtedly include rural areas situated outside industrial areas away from agglomerations. Their uniqueness is close relation to nature, low population density and dependence on agricultural business activity.
In these conditions intellectual capital creates development processes and its quality determines regional and national competitiveness level. Therefore, the objective of the research was identifying selected features of Polish farmers social capital affecting observed modernization and restructuring processes. The working hypothesis of the project is that improving the quality of farmers social capital results from country dwellers’ psychosocial conditions. Furthermore, it has been assumed that the group who have all the makings of social capital role change models are farm owners involved in market activity at the same time shaping behaviour and attitudes of other social circles.
RESEARCH METHODOLOGY
Research was conducted among farm owners in Wielkopolskie voivodeship. The sampling of respondents was purposive which means that the questions were asked to farmers who are representatives of the Agricultural Chamber. This is an institution of agricultural government in Poland representing interests of all agricultural tax payers. Spatial division of the group studied was used in accordance with administrative divi-sion enclosing counties and 300-respondent group was determined as fully sufficient for the analysed population. To obtain the primal evidence, survey method was used with a mail questionnaire which consisted of 14 substantial questions and diagnostic infor-mation part (demographics). After logical and formal verification of the received sur-veys, 268 were qualified for the statistical procedure.
To determine the correlation between quality features expressed in nominal scale (e.g. gender or education) or between quality feature and quantitative one (e.g. source of earnings and income) contingency measures assessing feature association degree were used. Features are associated if they appear in a greater number of cases than it would occur if they were unrelated [Zelia et al. 2002].
Association evaluation is based on statistics χ2 which shows observed number
devia-tion for isolated classes of both features from the number which would be expected if the features were unrelated.
Statistics χ2 is calculated on the basis of a table which springs up as a result of
classi-fying study population according to two features and consists of k lines matching one feature variants and l columns matching the second variant.
k i l j ij ij k i l j ij ij ij n n n n n n 1 1 2 1 1 2 2Statistics χ2 assumes the values within the bracket 0;n
k1
l1 dependson n population number, k lines number and l columns.
V Cramer coefficient calculated in the study is based on statistics χ2 value:
1, 1
min 2 k r n V
The coefficient assumes values within the bracket (0, 1). If its value equals 0, it means that features X and Y are uncorrelated. The closer its value to unity, the stronger the correlation between features X and Y [Sobczyk 2000].
In the process of empirical data analysis, an attempt was made to identify features relations distinguishing rural areas social capital with social and occupational character-istics of farmers under research.
SELECTED RESEARCH RESULTS
Age structure is an important determinant of enterprise behaviour and civic engage-ment formative for rural area social capital level. The group under research are farm owners at working age. Their average age is 42.6 and median 48. The oldest subject is 74, and the youngest 20. This feature’s variability coefficient i.e. standard deviation share in average value equals 30%. This proves high group diversity in terms of age. Most people out of those polled are within the 47-56 age bracket (Fig. 1).
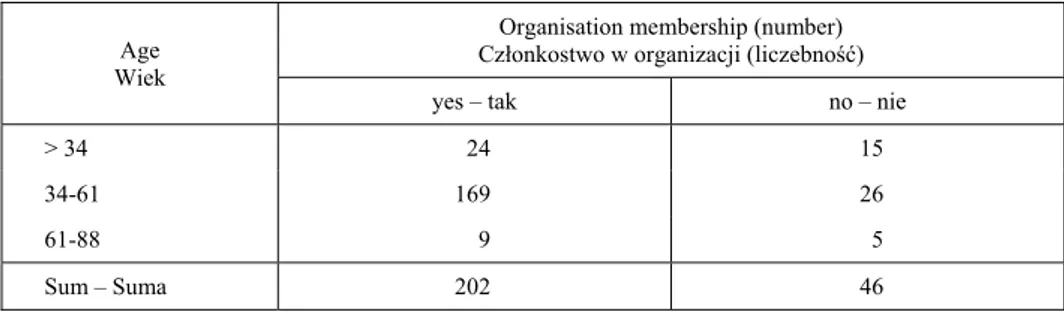
The correlation between farmers age and social organisation membership was evalu-ated with V Cramer coefficient value at 0.26 (limited relation). The age group analysis revealed that hardly anyone younger than 34 and older than 61 was a member of non-governmental sector institution (Table 1).
Another studied relation was the connection between respondents’ age and their nat-ural trust impulse. Although the correlation measure result was relatively low i.e. 0.19, the simple answer evaluation shows that the farmers polled are people of high self-esteem and apart from the eldest age group evaluate social relations positively (Fig. 2).
An important enterprise reading is manager and contractor job preference. All in all, 68% respondents preferred the manager function which results from farmer self-reliance and unique mentality. The factor that had impact on the job function choice was gender of those polled (Fig. 3).
The research result confirms that most farms are run by men and women prefer to work in a team.
Fig. 1. Respondents’ age histogram Source: own study.
Rys. 1. Histogram wieku badanej grupy ródło: opracowanie własne.
Table 1. Farmers’ age and social organisation membership relation Tabela 1. Relacja wieku ankietowych i członkostwa w organizacji społecznej
Age Wiek
Organisation membership (number) Członkostwo w organizacji (liczebnoć)
yes – tak no – nie
> 34 24 15
34-61 169 26
61-88 9 5
Sum – Suma 202 46
Source: own study. ródło: opracowanie własne.
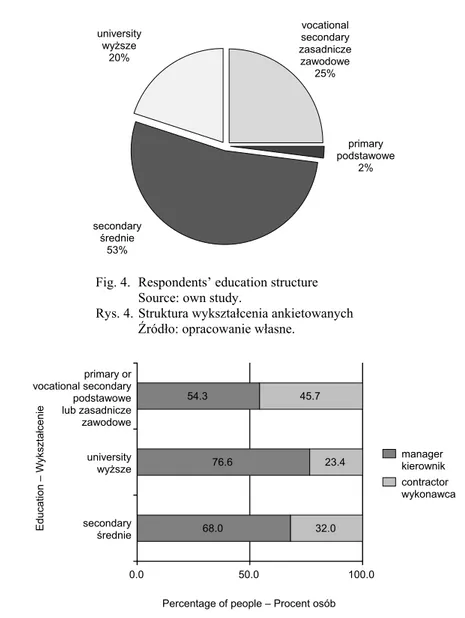
The structure presented above confirms the average high educational level of those polled and indicates predispositions to create active attitudes in their environment. The V Cramer coefficient analysis showed significant connections of education level with job function preferences and social relations openness. Among those polled, with higher education, preference to take economic decisions and enterprising activities is on the increase (Fig. 5).
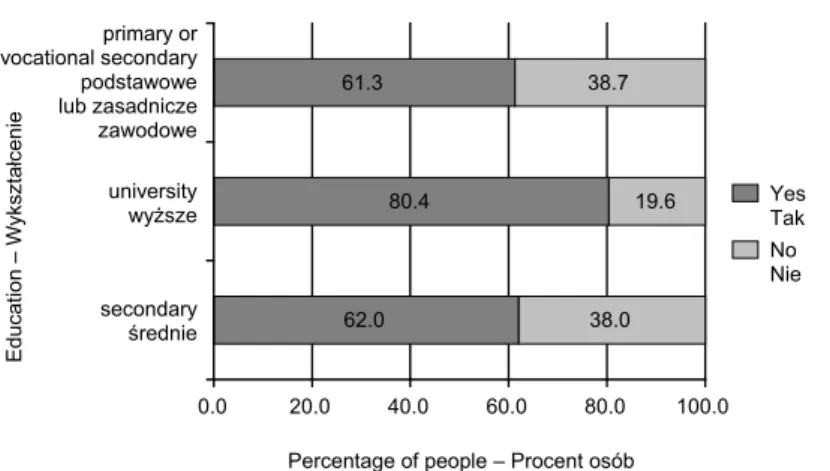
At the same time, people with higher intellectual awareness (with higher education) consider relations with environment important as these make up trust and informal rela-tions (Fig. 6).
20 29 38 47 56 65 74
Age – Wiek 0
20 40 60 80 100 120
Number
of peop
le
Liczba o
s
Fig. 2. Connection between age and social openness of respondents Source: own study.
Rys. 2. Zale no ć wieku i otwarto ci społecznej ankietowanych ródło: opracowanie własne.
Fig. 3. Impact of respondents’ gender on job function choice Source: own study.
Rys. 3. Wpływ płci ankietowanych na preferencje funkcji zawodowej ródło: opracowanie własne.
Collective activity barriers in agriculture were also under research. They curb busi-ness and culture undertakings. Respondents pointed to the lack of farmers' will resulting from their perception of collective activity. At the same time, the study revealed that the higher the education of those polled, the more often they mention the problem (Table 2). In the intellectual capital determinant analysis an economic factor appears i.e. the income level that the household has at its disposal or the entrepreneur’s profit. In this study, a farm’ income is the gross agricultural income and the level was established according to the farm owner’s recommendation.
61.9 5.5
27.5 5.0
0.0 20.0 40.0 60.0 80.0 100.0 Man
Męczyzna Woman Kobieta
Percentage of people – Procent osób
manager kierownik contractor wykonawca
Gender –
P
ł
e
ć
92.3 93.5 71.4
7.7 6.5 28.6
0.0 20.0 40.0 60.0 80.0 100.0 > 34
34-61 61-88
Percentage of people – Procent osób
A
ge –
Wiek people can be trusted
Fig. 4. Respondents’ education structure Source: own study.
Rys. 4. Struktura wykształcenia ankietowanych ródło: opracowanie własne.
Fig. 5. Connection of education level with job function preferences Source: own study.
Rys. 5. Zale noć wykształcenia i preferowanych funkcji zawodowych ródło: opracowanie własne.
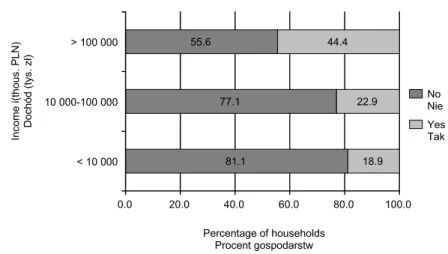
Cooperative ability in agriculture can be estimated by production group which is the institutional expression of team work and brings tangible benefits to its members. Agri-cultural income, in the research, turned out to be an important factor diversifying farm-ers’ tendency to group activity. Only 19% of respondents from the group with lowest income declare production group affiliation, whereas in the affluent group the percent-age increases to 44.7% (Fig. 7).
68.0 76.6 54.3
32.0 23.4 45.7
0.0 50.0 100.0
secondary rednie university wy sze primary or vocational secondary podstawowe lub zasadnicze zawodowe
Percentage of people – Procent osób
manager kierownik contractor wykonawca
Educa
tion
– W
y
kszta
ł
cenie
vocational secondary zasadnicze zawodowe
25%
primary podstawowe
2%
secondary rednie
53% university
Fig. 6. Connection of education and social relations openness Source: own study.
Rys. 6. Relacja wykształcenia i otwarto ci na relacje społeczne ródło: opracowanie własne.
Table 2. Connection of education and pointing to lack of farmers’ will as a barrier against collec-tive activity
Tabela 2. Zale noć wykształcenia od wskazania braku woli rolników jako bariery działa wspól-nych
Education
Wykształcenie Lack of will is a barrier Brak woli jest barierą Lack of will is not a barrier Brak woli nie jest barierą Suma Sum
Primary or vocational Podstawowe lub zawodowe
29 30 59
Secondary rednie
79 42 121
University Wy sze
35 15 50
Source: own study. ródło: opracowanie własne.
Connection between income level and cooperation with agriculture environment in-stitutions was identified. V Cramer coefficient assumed quite high values in these rela-tions i.e. along with the income growth springs up bigger intensity of contacts between households and insurance companies, rural agencies or financial institutions.
In the respondents’ evaluation of social relations importance an interesting and pre-dictable relationship appeared. Although majority of those polled considered relations with social environment important, the higher the income level the more important become the group ties among farm owners (Fig. 8).
62.0 80.4 61.3
38.0 19.6 38.7
0.0 20.0 40.0 60.0 80.0 100.0 secondary
rednie university wy sze primary or vocational secondary podstawowe lub zasadnicze zawodowe
Percentage of people – Procent osób
Yes Tak No Nie
Educa
tion
– W
y
kszta
ł
Fig. 7. Relation between agricultural income and production group affiliation Source: own study.
Rys. 7. Zale noć między dochodem rolniczym a przynale no cią do grupy producenckiej
ródło: opracowanie własne.
Fig. 8. Relation of agricultural income and social relations importance Source: own study.
Rys. 8. Zale noć dochodu rolniczego i znaczenia relacji społecznych ródło: opracowanie własne.
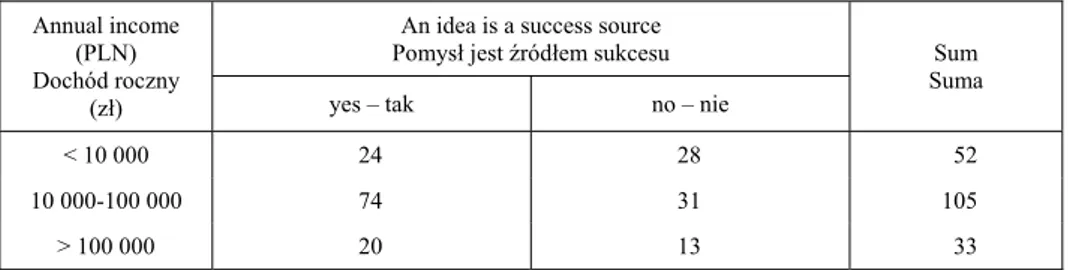
An interesting relation occurred with reference to the question whether an idea (in-novation) is the source of economic success. Majority of people with the highest income did not agree with the thesis in the question (Table 3).
74.5 93.2
25.5 6.8
0.0 50.0 100.0
< 10 000 > 10 000
Percentage of farms Procent gospodarstw
income
(tho
us.
PL
N)
Do
chód (tys.
z
ł
)
important wa ne
unimportant niewa ne 81.1
77.1 55.6
18.9 22.9 44.4
0.0 20.0 40.0 60.0 80.0 100.0 < 10 000
10 000-100 000 > 100 000
Percentage of households Procent gospodarstw
Incom
e
i(
thou
s.
PL
N)
Do
chód (tys.
z
ł
)
Table 3. Relation between income and evaluation of idea as success source Tabela 3. Relacja między dochodem a oceną pomysłu jako ródła sukcesu
Annual income (PLN) Dochód roczny
(zł)
An idea is a success source
Pomysł jest ródłem sukcesu Sum Suma yes – tak no – nie
< 10 000 24 28 52
10 000-100 000 74 31 105
> 100 000 20 13 33
Source: own study. ródło: opracowanie własne.
The general criterion of social capital potential is trust level towards other people. The descriptive method was used in the project and 49% of those polled stated that trust should be limited, 29% that people can be trusted and just 8% claimed that people can-not be trusted. This is an optimistic result taking into consideration average trust level of Polish society (Fig. 9).
Fig. 9. Respondents’ trust evaluation Source: own study.
Rys. 9. Ocena zaufania w ród respondentów ródło: opracowanie własne.
Another element of social activity is attitude to authorities and consequent tendency to participate in public life. The farmers polled demonstrated a responsible attitude to political environment since 72% claimed that authorities are a crucial element of state structure and 9% acknowledged authorities as a constructive politics result. At the same time 15% chose pejorative assessments of authorities and people in power (Fig. 10).
25
49
8
21
0 10 20 30 40 50 60
people can be trusted mo na ufać
limited trust zaufanie ograniczone
people cannot be trusted nie mo na ufać ludziom
hard to say anything about trust
trudno powiedzieć
co o zaufaniu
Percen
tage
o
f pe
op
le
Procen
t osó
b
Fig. 10. Respondents’ evaluation of authorities. Source: own study.
Rys. 10. Ocena władzy przez respondentów ródło: opracowanie własne.
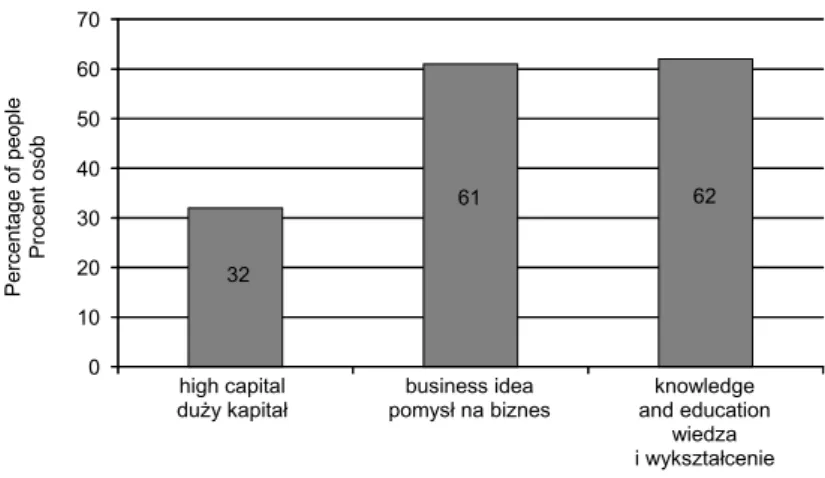
When evaluating enterprise premises the farmers polled attributed high importance to intellectual capital elements. 62% pointed to knowledge and education as fundamen-tal for economic success, and just a fewer claimed that an appropriate idea is a source of success when self-employed. Only 32% stated that high capital is a premise of business success (Fig. 11).
Fig. 11. Sources of economic success according to respondents Source: own study.
Rys. 11. ródła sukcesu ekonomicznego w opinii respondentów ródło: opracowanie własne.
32 61 62 0 10 20 30 40 50 60 70 high capital du y kapitał
business idea pomysł na biznes
knowledge and education wiedza i wykształcenie
Percen tage o f pe op le Procen t osó b
Success determinants – Determinanty sukcesu 72
15 9 15
0 10 20 30 40 50 60 70 80 state structure element element struktury państwa
unnecessary bureaucracy zbędny aparat biurokratyczny constructive politics element element twórczy polityki
group in possession of material goods grupa trzymająca dobra materialne Percen tage o f pe op le Procen t osó b
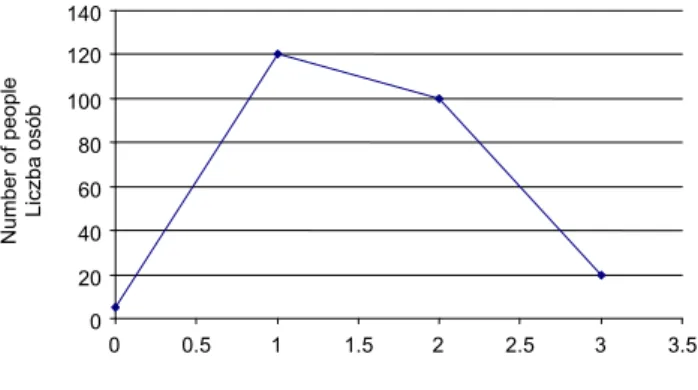
The analysis of success factor number revealed interesting results. Contrary to ex-pectations, 120 choices referred to one determinant and only 100 answers referred to two business success factors. The most common were combinations of high capital and a business idea or high capital together with knowledge and education. Only 7.7% choices referred to combination of all three determinants (20 answers) – Fig. 12.
Fig. 12. Number of success factors according to respondents. Source: own study
Rys. 12. Liczba czynników sukcesu według ankietowanych ródło: opracowanie własne.
SUMMARY
The conducted research concerned selected social capital indexes in Polish rural are-as. Representatives of agricultural producers, mostly men, with above the average edu-cation level were evaluated. Majority of those polled gain most income from agricultur-al activity and cooperate with agriculture support institutions. Statisticagricultur-al sociagricultur-al feature relation measure pointed to age, education level and income as social capital factors among country dwellers. Thus, the working hypothesis has been confirmed that improv-ing quality of rural areas social capital can occur by changimprov-ing country dwellers and their families’ psychosocial factors. On account of tight bond between social and intellectual capital it can be stated that there are good reasons to shape intellectual capital by orien-tated economic policy.
This can take form of interregional effects by central authorities (government, Euro-pean Union) or intraregional moulding of subject behaviours by local governments. The current doctrine of regional development policy assumes integration of these two routes as a part of development strategy along with central and local government contract. Operating programmes related to intellectual capital commonly include:
– improvement of human resources quality by educational system and continuous education projects,
– employees’ mobility increase enabling intellectual capital flow, – raising civic awareness and facilitating collective activity forms,
0 20 40 60 80 100 120 140
0 0.5 1 1.5 2 2.5 3 3.5
Number of economy success factors Liczba czynników decydujących o sukcesie w gospodarce
Number
of peop
le
Liczba o
s
– creating institutional support for intellectual capital, – streamlining intellectual property and transfer model.
Directions of economic policy towards intellectual capital, grouped in this way, in the future will allow improving quality of this crucial economy growth factor in rural areas making them more competitive.
REFERENCES
Fukuyama F., 1997. Trust: The Social Virtues and the Creation of Prosperity.PWN, Warszawa- -Wrocław.
Sobczyk M., 2000. Statystyka. PWN, Warszawa.
Zelia A., Pawełek B., Wanat S., 2002. Metody statystyczne. PWE, Warszawa.
WYBRANE CHARAKTERYSTYKI KAPITAŁU SPOŁECZNEGO POLSKICH ROLNIKÓW
Streszczenie. Artykuł przedstawia wyniki bada przeprowadzonych w ród wła cicieli gospodarstw rolnych województwa wielkopolskiego w zakresie wybranych charaktery-styk kapitału społecznego. Autor identyfikuje i okre la wpływ czynników społ eczno-za-wodowych na jakoć kapitału społecznego i wyprowadza wnioski statystyczne. W kon-kluzji ukazano instrumenty polityki gospodarczej wspierające rozwój obszarów wiejskich w tym aspekcie. Poziom wykształcenia, aktywnoć obywatelska i skłonnoć do działania wspólnego stanowią główne uwarunkowania jako ci kapitału społecznego polskich obsza-rów wiejskich.
Słowa kluczowe: kapitał społeczny, obszary wiejskie, rolnicy
Accepted for print – Zaakceptowano do druku: 21.10.2013