© 2014 Science Publications
doi:10.3844/jcssp.2014.1403.1410 Published Online 10 (8) 2014 (http://www.thescipub.com/jcs.toc)
Corresponding Author: Ravichandran, M.,Department of IT, Bannari Amman Institute of Technology,Sathyamangalam, Erode District, Tamilnadu, India
COMBINATION OF DIFFERENCE
SUBSPACE AND OPPURTUNISTIC
CLUSTERING ON HIGH DIMENSIONAL DATA
1
Ravichandran, M. and
2A. Shanmugam
1
Department of IT, 2
Department of Electronics and Communication Engineering,
Bannari Amman Institute of Technology, Sathyamangalam, Erode District, Tamilnadu, India
Received 2013-06-08; Revised 2014-01-29; Accepted 2014-03-11
ABSTRACT
Clustering is recognized as sigificant technique for analysing data and concentric effort has been taken in different domains comprises of recognition of pattern, statistical analysis and data mining for decades. Subspace clustering is developed from the group of cluster objects from all subspaces of a dataset. During clustering of objects involing higher dimension, the accuracy and effectiveness of traditional clustering algorithms are very poor, because data objects may present in different clusters involving different subspaces of differing level of dimensions. To address the above issue, a new technique termed Difference Subspace and Opportunistic Clustering (DSOC) model is presented for high dimensional data to improve the accuracy during the search process and also considers the problem of accuracy in clustering the high dimensional data. Methods for obtaining subspace and designing clustering model for DSOC are specified and demonstrated, where the subspace identify the possibility of each cluster center with the detection of attackers based on multiple locations and estimation points with derived centroid points. Through comprehensive mathematical analysis, we show that DSOC improves the accuracy in high dimensional data with efficient cluster validation obtained using different subspace and opportunistic algorithm. As validated by extensive experiments on CORTINA and Ski Resort Data Set datasets DSOC produces high quality clusters by detecting the attackers and the efficiency of DSOC outperforms previous works.
Keywords: High Dimensional Data, Opportunistic Subspace, Search Retrieval, Cluster Rationale, Estimated Clustering
1. INTRODUCTION
Clustering is an accepted data mining technique for a diversity of applications with minimum or no prior knowledge. This builds clustering realistic for real world applications. In recent times, high dimensional data has awakened the interest of database researchers due to its innovative challenges brought to the community. In the circumstance of clustering, the problem causes the space between two reports of the same cluster to move toward the space between two
reports of different clusters. Traditional clustering methods may not succeed to distinguish the precise clusters and providing the accuracy in retrieval of data.
Clustering consists of combining the objects that are in a way similar to each other and dissimilar in a certain way to other clusters. Certain types of clustering include hierarchical, partitioned, exclusive, overlapping and complete.
dimensional spaces may be split to clustering the objects in subspaces which involve different dimensions. The trial-and-error approach may not succeed because of the following difficulties:
• Predefining the cluster numbers is not easy • Re-initialization after formation of cluster increases
the computational cost
• sparsity due to high dimension data called as “curse of dimensionality”
In view of the above, we have offered a new fuzzy subspace clustering algorithm for clustering high-dimensional datasets and an algorithm for detecting the attacks based on Mahalanobis distance.
One of the techniques used for repersenting arbitrarily oriented clusters is fuzzy. But, conventional clustering algorithms does not succed when involving high dimensional spaces due to sparsity of data. Puri and Kumar (2011) propose an enhancement using Gustafson-Kessel clustering algorithm for cluster being projected. It applied enhanced gustafson-kessel clustering algorithm to dataset extracted from UCI and evaluated it to a rough set based algorithm.
The algorithms will consequently be likely to select few attributes values for each cluster, which might be inadequate for clustering the reports correctly.
Spontaneously, a small standard space between attribute values in a cluster indicates that the associate reports agree on a small range of values, which can make the reports easily restricted. A large number of selected attributes value towards the reports are analogous at a high dimensional, so they are very credible to belong to the same real cluster. Finally, a large number of reports in the cluster point out there are a high support for the selected attributes value and it is improbable that the small distances are merely by chance.
All these are indicators for a high-quality multiple clusters, but here is essentially a tradeoff between them. It’s important to point out that in this study; we focus on Opportunistic Subspace and Estimated Clustering (OSEC) model on high dimensional data. Estimated clustering method identified clusters in small estimated subspaces involving high dimensional data.
It provided an effectual mechanism for identifying regions of superior density involving high dimension data possessing high-quality scalability and accuracy.
Opportunistic subspace uses the difference subspace clustering method during the initial process that combines opportunistic logic in subspaces and complete space. The measure to identify attacks can
be influeced using a mutual perception of attack detection and identifying cluster.
The work is sequenced as follows: Section 2 introduces architecture diagram of the proposed scheme. Section 3 discussed about the experimental evaluation; section 4 concentrated on the results. Section 5 involved discussion and section 6 describes conclusion and prospect.
1.1. Literature Review
Most existing algorithms involving cluster become hihgly susceptible if the measure of similarity is evaluted among data points in full-dimensional space. To address this issue, Bridget Nirmala and Gowri (2013) enhanced the existing FCM algorithm and designed a new technique called Ameliorate FCM (AFCM). During the initial stage, the input image is preprocessed for noise removal applying Contrast Limited Adaptive Histogram Equalization (CLAHE) technique. Followed by it the image is classified using Bayesian classifier into normal and abnormal images using Hybrid feature selection method and then finally segmented using AFCM.
Bertini et al. (2011) discussed about visual exploration of patterns using high-dimenison data using systematization techniques that extracts qality measures. Gajawada and Toshniwal (2012) propose vinayaka, a semi-supervised projected clustering method based on DE. In this method DE optimizes a hybrid cluster validation index. Subspace Clustering Quality Estimate index (SCQE index) is used for internal cluster validation.
High performance clustering is one of the most important tasks in data mining. However, the existing clustering algorithms are time-consuming and have low clustering quality because of improper load balancing. In this study, Sumit Srivastava et al. (2011), provided load balancing using high performance cluster programming, using Open Source Cluster Application Resource (OSCAR) cluster kit.
Shanmugapriya and Punithavalli (2012), an algorithm called modified projected k-means clustering algorithm with effective distance measure is designed to generalize k-means algorithm with the objective of managing the high dimensional data. The experimental results confirm that the proposed algorithm is an efficient algorithm with better clustering accuracy and very less execution time than the Standard K-Means and General K-Means algorithms.
analysis and linear transformation was applied for dimensionality reduction and initial centroid was then evaluated which was then applied to K-Means clustering algorithm by Napoleon and Pavalakodi (2011).
The algorithm PROCLUS designed by Sembiring et al. (2010), outperforms the PROCLUS in terms of execution time and resulted in minimum number of un-clustered data with both points present in cluster and relevancy of attributes considered.
Motivated from current issues on manifold learning and L1-regularized models for selection of subset, a new approach as proposed by Cai et al. (2010), called Multi-Cluster Feature Selection (MCFS), for unsupervised feature selection. Certain clustering models combines small cluster with big clusters deteaching the identity of small clusters. Clustering ensemble method based on a novel two-staged clustering algorithm is proposed by Tidke et al. (2012).
Yang and Chen (2011), designed weighted clustering ensemble algorithm that effecitvely join different representations, minimizing information loss in single representation and uses different information sources based on temporal form of data excluding extracted feature. Jiang et al. (2011), have one extracted feature for each cluster. By this algorithm, the derived membership functions match closely with and describe properly the real distribution of the training data.
On the basis of the aforementioned techniques and methods applied, the proposed work using a new model called the Difference Subspace and Opportunistic Clustering (DSOC) model improve the accuracy using high dimensional data and provide efficient cluster validation. Here, we also extend the approach by applying the high dimensional data model for clustering and attack detection module. In summary our contributions are: • To estimate the clusters in high dimensional data
applying opportunistic subspace and estimated clustering model
• To present initialization process using difference subspace algorithm to identify clusters that exist in different subspaces
• To define opportunistic subspace to identify the possibility of each cluster center and then finally define the centroid points
• Detection of attackers based on multiple locations and estimation points to obtain quality clustering results
To evolve a high dimensional data, a new technique named Opportunistic Subspace and Estimated Clustering (OSEC) model is presented.
2. PROPOSED DIFFERENCE SUBSPACE
AND OPPURTUNISTIC CLUSTERING
MODEL ON HIGH DIMENSIONAL DATA
The proposed work is efficiently designed for estimating the clusters in high dimensional by adapting the Difference Subspace and Opportunistic Clustering (DSOC) model.
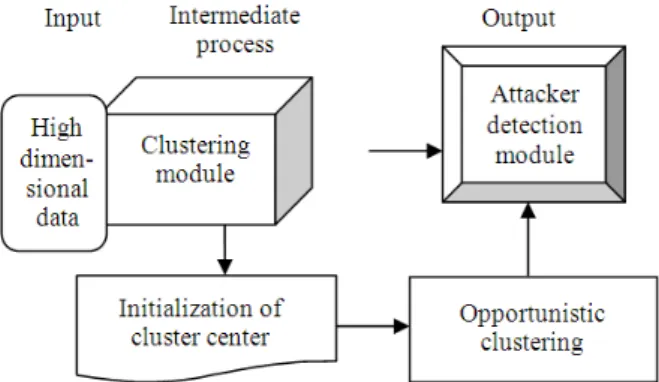
The architecture diagram of the proposed Difference Subspace and Opportunistic Clustering model is shown in Fig. 1. The proposed Difference Subspace and Opportunistic Clustering model comprises of three different processes, namely input, intermediate and output processes. The input process takes the high dimensional data followed by the Difference Subspace Clustering algorithm which performs initialization, which take over the advantages of opportunistic type clustering algorithms such as easiness of calculation, effortlessness and can covenant with noise and overlap clusters. Our proposed system consists of two modules namely (i) Cluster initialization and (ii) Attacker Detection.
The clustering module is subdivided into two parts comprising of (i) Initialization using Difference Subspace clustering and (ii) Clustering using opportunistic logic.
2.1. Difference Subspace Clustering
Subspace clustering find clusters in different subspaces within a real dataset in a way that might fit in to multiple clusters, with each accessible in different subspace. Subspace algorithm in DSOC model identifies each cluster center and then finds their corresponding centroid points. Moreover, in high dimensional data, several dimensions may be inappropriate and cannot accessible clusters in the presence of noisy data. Subspace clustering algorithms in DSOC model restrict the investigation for specific dimension by identifying clusters in multiple overlapping subspaces. The steps involved in difference subspace clustering are given as below:
Step1: Select the highest point data object as the initial cluster center
Step2: Let the neighborhood data objects be removed from the initial cluster center
Step3: Follow the steps given in Step 1 and Step 2 until the data points are within the radii of cluster
Fig. 1. Architecture diagram of difference subspace and opportunistic clustering model
Algorithm 1: Difference subspace clustering algorithm Consider dataset Y = {y1, y2,…,yn}∈Reald
Initialize the centre E (0) and set Emax = k For each yi∈Y,
Evaluate mass index
Fi = ∑ exp ||yi-yj||2/(.5qa)2 where j = 1, 2, ,…,n Let F c1 = max {Fi} where i = 1,2,…,n},
Select yc1 as the initial cluster center; if y ck = k th cluster center and mass index is Fck. For each yi∈Y, update the mass index,
Fi = Fi-Fck ∑ exp ||yi-yck||2 / (.5qb)2 For each yi∈Y
Repeat
qa = qb = ½ {||y1 – yk||}
Until Fck+1 / Fc1<δ, where qa, qb need pre assignment.
In difference subspace clustering algorithm each phase tests the clusters ‘c’ between Cmin and Cmax. The cluster centers are initialized during the establishment difference algorithm. In difference clustering algorithm, the cluster center ordering is evaluated using the mass index. The value of mass index to be selected is the earlier of cluster center generated. Thus, during each step the top ‘c’ cluster centers are selected as new cluster centers with no necessity to re-initialize the cluster centers. Once the initialization of the centroid is accomplished, the next step involved in difference subspace clustering algorithm is to process the opportunistic algorithm to get hold of the association degree for every data point with deference to each cluster that is described in the following section.
2.2. Opportunistic Clustering Model
Opportunistic subspace method of clustering is a data clustering system in which a real dataset is grouped into ‘n’ clusters. The data point in real
dataset consits of a cluster with relevant confident degree. For illustration, a data point present closer to the center has higher probability of membership to the specific cluster whereas a different data point that is far away from the center of a cluster has a lower degree of belonging to that specific cluster.
With opportunistic method, the centroid of a cluster is measured as the average of all points based on the weight belonging to the cluster. The process depends on initial centroid points. In Difference Subspace and Opportunistic Clustering (DSOC) model, Opportunistic The objective of subspace clustering is to achieve the probability of each cluster center and then to identify all of the centroid points. Two methods are followed for deriving the dynamic model, as given below: (1) Identification of centroid points using an opportunistic subspace algorithm and (2) With different initial centroid point execute the opportunistic algorithm several times. The steps involved in the opportunistic clustering model include the following:
Step1: Modernize association matrix (A) Step2: Determine the association for each point
Step3: Iterate step (1) and step (2) until the centroid points are stabilized.
Algorithm 2 describes the step involved in the opportunistic clustering model is given below:
Algorithm 2: Opportunistic subspace clustering algorithm
Initialize the K-step
Calculate the centers vectors C (k) = [Cj] with A(k). Cj = ∑ aij yi/∑ aij, where I,j = 1, 2, ..,n Update the points A(k) ,A(k+1).
Cij = 1
∑ (yi-yj)/(yi-yk), where k = 1,2,..,m
If ||A(k+1)-A (k)||< δ then Exit
Else
Update the points End if
End
Here, δ is a predefined value which is specified as input. Generally δis taken as 0.0001.
with the proposed indices distinct for subspace clusters, to derive optimality of clusters involving high dimensional spaces.
Thus, in our proposed system, each dimension detects the clusters, but the weights possesing maximum weights results in subsets of cluster. The difference subspace clustering with multiple data points are based on their attributes wehre opportunistic logic is used for identification of centroid points. As the formation of the clusters as specified is circular, there may be data points of abnormality called as attackers. Detection of attackers is highly significant for obtaining quality clustering results which is discussed elaborately in the forthcoming section.
2.3. Attacker Detection
When analyzing data using the real datasets, certain problems related to outlying are observed. The work of Rousseeuw and Hubert (2011) aimed at detecting the attackers by searching for the model using the majority of the data. In real data sets, often some observations are different from the others. Such observations are called as the attackers. The outlying observations may differ from majority of other points recorded under different circumstances resulting in not fitting into a model. To avoid slough effects, vigorous statistics finds a value that is close to the value identified without the outliers. The attackers are recognized by their big deviation from that robust fit. The attackers are detected using multiple location and points estimated based on the location pattern which is elaborated below.
2.4. Multiple Location and Estimation Points
In order to derive the estimation points with multiple location, assume that the real dataset contained ‘n’ data objects, which are ‘r’ dimensional and stored in an n×r data matrix with Y= {y1, y2,…,yn}S representing the object under observation with xi = (yi1,….. yir)S with the object of interest to be observed with ith observation is given as below.
Experimental mean, y’is:
Y’ = 1/n ∑Yi, where i = 1, 2,….,n
Experimental estimation matrix Tx is obtained using:
Tx = ∑(Yi-Y’) (Yi-Y’)S/(n-1)
3. EXPERIMENTAL EVALUATION
The proposed Difference Subspace and Opportunistic Clustering (DSOC) model is implemented in JAVA.
Weka involves machine learning algorithms for performing data mining activities that includes certain tools for pre-processing of data, classification to be performed, clustering, association rules and visualization that also appropriate for increasing new machine learning schemes. Attribute Relationship File Format (ARFF) is the text format file used by Weka to accumulate data in a database.
Two datasets namely, CORTINA and Ski Resort Data Set is used for analysis of the proposed Difference Subspace and Opportunistic Clustering (DSOC) model. The CORTINA Dataset 10 contains Million images using image content, text and annotations. Another dataset named the Ski Resort Data Set is obtained from data mining course by Yong Bakos. It uses weka to weight the data file and save the dataset as final. Arff file in default ARFF file format for future processing. It contains 989 data objects and each object has 16 attributes with all the data attributes to be nominal in nature with the attribute set rating, Survey, Prize, Punishment representing the overall assessment from a subject.
In this section, we develop a progression of experiments considered to estimate the correctness of the proposed algorithm in terms of energy usage, execution time and computational cost.
4. RESULTS
In this study we have seen how the clusters have been estimated in high dimensional spaces. The table given below describes the performance of the proposed Difference Subspace and Opportunistic Clustering (DSOC) model. In the consequence, we compared Adaptive Cluster Distance Bounding for High-Dimensional Indexing (ACDB) and Opportunistic Subspace and Estimated Clustering (OSEC) model, in terms of energy usage.
Table 1 describes the energy usage based on attribute size and execution time taken using the CORTINA Dataset and comparison made with an existing Adaptive Cluster Distance Bounding for High-Dimensional Indexing (ACDB).
The Table 2 describes the presence of time taken to execute based on the number of cluster partitioned with respect to the Ski Resort Data Set.
Table 1. Tabulation for energy usage
Energy usage (Joules)
---
Proposed ACDB
Attribute size DSOC model method
10 3.5 10.20
20 4.6 13.40
30 4.7 17.20
40 6.5 17.50
50 6.9 18.00
60 7.3 19.50
70 7.8 24.30
80 8.0 27.50
90 8.3 30.00
100 8.5 30.25
Table 2. Tabulation for execution time Execution time (sec)
---
Proposed ACDB
No. of clusters DSOC model method
100 35 68
200 38 72
300 42 75
400 45 82
500 50 90
600 52 92
700 55 100
800 57 102
900 58 110
1000 60 115
Table 3. Tabulation for computational cost Computational cost
---
Proposed ACDB
Cluster object size DSOC model method
50 45 75
100 50 80
150 52 82
200 55 85
250 58 88
300 60 90
350 71 91
400 63 92
450 65 93
500 67 96
5. DISCUSSION
In this section, a detailed comparison with proposed DSOC model and existing ACDB method is performed in terms of energy usage, execution time, computational cost and clustering accuracy.
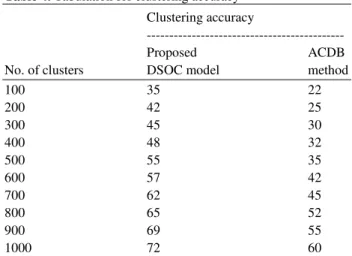
Table 4. Tabulation for clustering accuracy Clustering accuracy
---
Proposed ACDB
No. of clusters DSOC model method
100 35 22
200 42 25
300 45 30
400 48 32
500 55 35
600 57 42
700 62 45
800 65 52
900 69 55
1000 72 60
5.1. Measure of Energy Consumption
Energy consumption is the average energy consumed to perform the clustering using high dimensional data. Figure 2 shows energy consumption based on the attribute size and the impact of energy consumed in the Difference Subspace and Opportunistic Clustering (DSOC) model is bettter than the existing Adaptive Cluster Distance Bounding for High-Dimensional Indexing (ACDB). This is because DSOC minimizes the energy usage by identifying the centroid points with the help of opportunstic clustering model and its performance is reliable.
5.2. Measure of Execution Time
Fig. 2. Measure of energy usage
Fig. 3. Measure of execution time
Fig. 4. Measure of computational cost
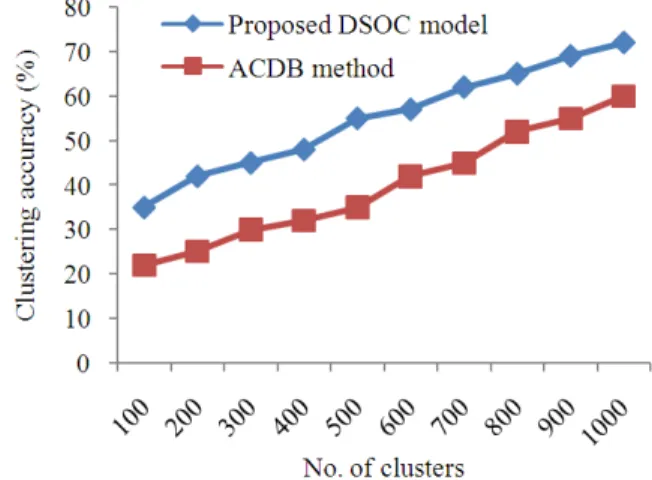
Fig. 5. Measure of clustering accuracy
5.3. Measure of Computational Cost
Figure 4 describes the computational cost with the help of the cluster object size. From the figure it is illustrative that the computational cost involved in the proposed DSOC model is comparatively lesser than using the existing ACDB method. This is because the DSOC model detects the attackers and improve the accuracy based on the estimation points present in multiple locations resulting in lesser cost factor than using the existing ACDB method and the variance is approximately 30-40% lesser in terms of cost.
5.4. Measure of Clustering Accuracy
Figure 5 illustrates the clustering accuracy with an elaborate comparison analysis being made with the exisitng ACDB method. From the figure it is evident that the clustering accuracy is higher using DSOC model than the existing ACDB method. This is because the DSOC model identify the possibility of each cluster center using opportunistic subspace by increasing the accuracy of cluster. The variance achieved using DSOC model is 10-25% higher than the ACDB method.
6. CONCLUSION
terms of accuracy, computational cost and execution time. Our experimental evaluations showed that dimensional estimation clusters considerably outperforms difference subspace clustering algorithm especially on high dimensional data. The experimental results showed that the proposed DSOC model for the data attributes worked efficiently by improving 30-35% accuracy and less execution time. We show that the authority of clusters on data dimension indicates the influence of the opportunistic subspace. The proposed method provides a high quality clusters by detecting the attackers. In addition, still to improve the quality of the clustering results heuristic approach can be introduced.
7. REFERENCES
Bertini, E.A. Tatu and D. Keim, 2011. Quality metrics in high-dimensional data visualization: An overview and systematization. IEEE Trans. Knowl. Data Eng., 17: 2203-2212. DOI:10.1109/TVCG.2011.229 Bridget Nirmala, J. and S. Gowri, 2013 . Ameliorate
Fuzzy C- Means: An Ameliorate Fuzzy CMeans Clustering algorithm for CT-Lung Image Segmentation. Am. J. Applied Sci., DOI: 10.3844/ajassp.2013.1439.1447
Cai, D., C. Zhang and X. He, 2010. Unsupervised feature selection for multi-cluster data. Proceedings of the 16th ACM SIGKDD International Conference on Knowledge Discovery and Data Mining, Jul. 25-28, ACM New York, NY, USA., pp: 333-342. DOI: 10.1145/1835804.1835848
Deborah, L.J., R. Baskara and A. Kannan, 2010. A survey on internal validity measure for cluster validation. Int. J. Comput. Sci. Eng. Survey, 2: 85-102.
Gajawada, S. and D. Toshniwal, 2012. Vinayaka: A semi-supervised projected clustering method using differential evolution. Int. J. Software Eng. Applic., 3: 77-85.
Jiang, J.Y., R.J. Liou and S.J. Lee, 2011. A fuzzy self-constructing feature clustering algorithm for text classification. IEEE Trans. Knowl. Data Eng., 23: 335-349. DOI: 10.1109/TKDE.2010.122
Napoleon, D. and S. Pavalakodi, 2011. A new method for dimensionality reduction using k-means clustering algorithm for high dimensional data set. Int. J. Comput. Applic., 13: 41-46. DOI: 10.5120/1789-2471
Puri, C. and N. Kumar, 2011. Projected Gustafson-Kessel clustering algorithm and its convergence. Trans. Rough Sets Comput. Sci., 6600: 159-182. DOI: 10.1007/978-3-642-21563-6_9
Rousseeuw, P.J. and M. Hubert, 2011. Robust statistics for outlier detection. Data Min. Knowl. Discovery, 1: 73-79. DOI: 10.1002/widm.2
Sembiring, R.W., J.M. Zain and A. Embong, 2010. Clustering high dimensional data using subspace and projected clustering algorithms. Int. J. Comput. Sci. Inform. Technol., 2: 162-170.
Shanmugapriya, B. and M. Punithavalli, 2012. A modified projected k-means clustering algorithm with effective distance measure. Int. J. Comput. Applic., 44: 32-36. DOI: 10.5120/6285-8468 Srivastava, S., P. Dadheech and M.K. Beniwal, 2011.
Load balancing using high performance computing cluster programming. Int. J. Comput. Sci., 8: 62-66. Tidke, B.A., R.G. Mehta and D.P. Rana, 2012. A novel
approach for high dimensional data clustering. Int. J. Eng. Sci. Adv. Technol., 2: 645-651.