The ‘silence’ of silent brain infarctions may be related
to chronic ischemic preconditioning and nonstrategic
locations rather than to a small infarction size
Chao Feng,IXue Bai,I Yu Xu,IITing Hua,IIXue-Yuan LiuI
ITongji University, School of Medicine, Shanghai Tenth People’s Hospital, Department of Neurology, Shanghai, China.IITongji University, School of
Medicine, Shanghai Tenth People’s Hospital, Department of Radiology, Shanghai, China.
OBJECTIVE: Silent brain infarctions are the silent cerebrovascular events that are distinguished from symptomatic lacunar infarctions by their ‘silence’; the origin of these infarctions is still unclear. This study analyzed the characteristics of silent and symptomatic lacunar infarctions and sought to explore the mechanism of this ‘silence’.
METHODS: In total, 156 patients with only silent brain infarctions, 90 with only symptomatic lacunar infarctions, 160 with both silent and symptomatic lacunar infarctions, and 115 without any infarctions were recruited. Vascular risk factors, leukoaraiosis, and vascular assessment results were compared. The National Institutes of Health Stroke Scale scores were compared between patients with only symptomatic lacunar infarctions and patients with two types of infarctions. The locations of all of the infarctions were evaluated. The evolution of the two types of infarctions was retrospectively studied by comparing the infarcts on the magnetic resonance images of 63 patients obtained at different times.
RESULTS:The main risk factors for silent brain infarctions were hypertension, age, and advanced leukoaraiosis; the main factors for symptomatic lacunar infarctions were hypertension, atrial fibrillation, and atherosclerosis of relevant arteries. The neurological deficits of patients with only symptomatic lacunar infarctions were more severe than those of patients with both types of infarctions. More silent brain infarctions were located in the corona radiata and basal ganglia; these locations were different from those of the symptomatic lacunar infarctions. The initial sizes of the symptomatic lacunar infarctions were larger than the silent brain infarctions, whereas the final sizes were almost equal between the two groups.
CONCLUSIONS:Chronic ischemic preconditioning and nonstrategic locations may be the main reasons for the ‘silence’ of silent brain infarctions.
KEYWORDS: Silent Brain Infarctions; Symptomatic Lacunar Infarctions; Small Vessel Disease; Leukoaraiosis.
Feng C, Bai X, Xu Y, Hua T, Liu XY. The ‘silence’ of silent brain infarctions may be related to chronic ischemic preconditioning and nonstrategic locations rather than to a small infarction size. Clinics. 2013;68(3):365-369.
Received for publication onSeptember 18, 2012;First review completed onOctober 30, 2012;Accepted for publication onNovember 26, 2012 E-mail: [email protected]
Tel.: 86 2166302582
& INTRODUCTION
Silent brain infarctions (SBIs) are very common in the elderly (1). SBIs are believed to be caused by the occlusion of small vessels and are therefore categorized as a small vessel disease (SVD); SVDs are related to different types of arteriole degeneration (2,3). SBIs are mainly identified by imaging tools (4) and are difficult to distinguish from old symptomatic lacunar infarctions (SLIs), which are also
caused by the occlusion of small vessels and are usually regarded as SVDs (2). Except for the different signals on diffusion-weighted images (DWIs) during the acute phase of SLIs, the lack of stroke-like symptoms or ‘silence’ is the only prominent feature used to distinguish SBIs from SLIs (1,4).
However, the ‘silence’ of SBIs is still confusing to researchers and clinicians. The relatively small sizes of SBIs are the only widely accepted explanation for this peculiar feature (1,5). However, SLIs that result in obvious symptoms can also be small. Several recent studies on the evolution of SLIs indicate that their final sizes are much smaller than those measured for DWIs after the onset of stroke (6-8). Thus, the difference between the sizes of SBIs and SLIs may require further evaluation. The size-related explanation for the ‘silence’ of SBIs is also worth investigating.
Previous studies on lacunar infarcts mostly investigated the difference between SLI patients with or without SBIs Copyrightß2013CLINICS– This is an Open Access article distributed under
the terms of the Creative Commons Attribution Non-Commercial License (http:// creativecommons.org/licenses/by-nc/3.0/) which permits unrestricted non-commercial use, distribution, and reproduction in any medium, provided the original work is properly cited.
No potential conflict of interest was reported.
(5,9,10); few studies focused on the ‘silence’ of SBIs. Furthermore, no study has compared the evolution of SBIs and SLIs. In this study, four groups were designed according to the presence of SBIs and SLIs. Vertical and horizontal comparisons of the following characteristics were performed among groups: risk factors, locations, evolution of infarctions, leukoaraiosis, atherosclerosis (AS) of relevant vessels, and the NIH Stroke Scale (NIHSS) scores of patients with SLIs. Based on the comparisons, we determined the possible mechanisms responsible for the ‘silence’ of SBIs.
& MATERIALS AND METHODS
General population of patients
This study was based on patients diagnosed with acute lacunar infarction or patients confirmed to have no signs of stroke who consecutively visited the Department of Neurology of the 10thPeople’s Hospital in Shanghai from
December 2011 to August 2012. The patients had neurologic deficits, nonspecific symptoms (such as headaches), and dizziness; alternatively, they had a fear of stroke because of the presence of risk factors. The patients were administered a medical evaluation protocol, including brain magnetic resonance imaging (MRI), electrocardiogram, and blood tests for blood glucose, lipids, and homocysteine. All patients also underwent a vascular assessment involving either computed tomography angiography (CTA) or mag-netic resonance angiography (MRA). Patients diagnosed with acute lacunar infarction were evaluated using the NIHSS. All procedures were approved by the Institutional Review Board of our hospital, and written informed consent was obtained from every participant.
Based on the presence of SBIs and SLIs on MRIs, 521 patients were enrolled and divided into four groups, namely, SBI, SLI, SBI&SLI (SS), and control groups. These groups consisted of the following patients: 156 patients with only SBIs, 90 patients with only new SLIs, 160 patients with both SBIs and new SLIs, and 115 patients without any identified infarcts. The following patients were excluded from these four groups: patients diagnosed with other types of stroke but not acute lacunar infarction, patients with a history of stroke, and patients with metallic implants.
In addition to the MRI results of the four groups listed above, two sets of images were analyzed retrospectively to study the evolution of SBIs and SLIs: 1) previous MR images of the 32 patients in the SBI and SS groups who underwent MRI more than once and 2) previous MR images obtained after the onset of stroke for the other 31 patients with lacunes identified as old SLIs.
MRI protocol
The MR images in this study were primarily obtained using a 1.5 T scanner (Philips, Eindhoven, Noord-Brabant, Netherlands) and a 3.0 T scanner (Siemens, Erlangen, Bavaria, Germany). The MRI protocol consisted of a T1-weighted image [repetition time/echo time (TR/TE) = 101/ 1.92 for the 1.5 T scanner and 2000/9 for the 3.0 T scanner], fluid attenuated inversion recovery images (FLAIR) (TR/ TE = 6000/110 for the 1.5 T scanner and 8500/94 for the 3.0 T scanner), DWI (TR/TE = 3393/86 for the 1.5 T scanner and 6000/94 for the 3.0 T scanner) in the axial plane, and a T2-weighted image (TR/TE = 1940/120 for the 1.5 T scanner and 4540/96 for the 3.0 T scanner) in the sagittal plane with 16 layers.
Review and criteria of the MR images
All MR images were analyzed by two radiologists blinded to the clinical data. The discrepancies between the inter-pretations of the two readers regarding the presence of SBIs and SLIs and the leukoaraiosis scores were resolved by a visual consensus.
According to the conclusion on the evolution of acute lacunar infarctions, we defined SLI as a,25-mm-diameter focal lesion that is hyper-intense on a DWI among small penetrating arteries distributed in the thalamus, gang-liocapsular regions, corona radiata, and brainstem (7). An SBI was defined as a.3-mm-diameter focal cavitated lesion that is hypo-intense on T1-weighted images, hyper-intense on T2-weighted images, hypo-intense with a hyper-intense boundary on FLAIR images, and without corresponding stroke-like symptoms or neurologic deficits (4). An old SLI was defined as a focal lesion with signals similar to an SBI on T1- and T2-weighted images, with signals similar to cavitations or leukoaraiosis on FLAIR, and with a corre-sponding history of stroke-like symptoms or neurologic deficits (7,8,11). Old SLIs were analyzed only when the corresponding MR images after the onset of stroke were accessible at our workstation. The diameters of acute SLIs were measured on DWIs, T1-weighted images, and FLAIR images. The diameters of SBIs and old SLIs were measured on T1-weighted images and FLAIR images. All diameters listed for statistical analysis were the average of values measured by the two readers.
Leukoaraiosis was scored from 0 to 3 according to Fazekas’ scale (12). Grades 2 to 3 leukoaraiosis were regarded as advanced leukoaraiosis (ad-LA).
Vascular risk factors and vascular assessment
Data related to the following factors were collected: hypertension, diabetes mellitus (DM), dyslipidemia, ischemic heart disease (IHD), atrial fibrillation (AF), hyperhomocysteinemia (HHCY), smoking, and CTA or MRA results. Atherosclerotic plaques and stenosis of infarction-related arteries (e.g., middle cerebral and internal carotid arteries for infarctions in the gangliocapsular regions and basilar and vertebral arteries for infarctions in the brainstem) were considered to be possible atherosclerotic sources. AF diagnosed before or during hospitalization was regarded as a possible cardiogenic mechanism.
Statistical analyses
All data were analyzed using SPSS (version 18.0, SPSS, Inc., Chicago, IL, USA). ANOVA and chi-squared tests were performed to compare the baseline characteristics and locations. The Student’s t-test was used to compare infarction sizes and NIHSS scores. Multiple logistic regres-sion models were constructed to determine the risk factors for SBIs and SLIs. p,0.05 was considered to indicate a significant difference.
& RESULTS
Baseline characteristics of the four groups
higher prevalence rates of hypertension, HHCY, IHD, and ad-LA. The prevalence rates of DM, dyslipidemia, AF, and AS were also higher in the SLI group than in the control group.
Multiple comparisons among the SBI, SLI, and SS groups were also performed, and positive significant results (p,0.05) are shown in Table 2. Compared with the SLI group, patients in the SBI and SS groups were relatively older with higher prevalence rates of HHCY and ad-LA and lower prevalence rates of dyslipidemia and AS. No difference was observed for the prevalence of hypertension among the three groups. However, the durations of hypertension for hypertensive patients in the SBI and SS groups were significantly longer than for those in the SLI group (bothp,0.01). The NIHSS scores were higher in the SLI group than in the SS group (p= 0.017).
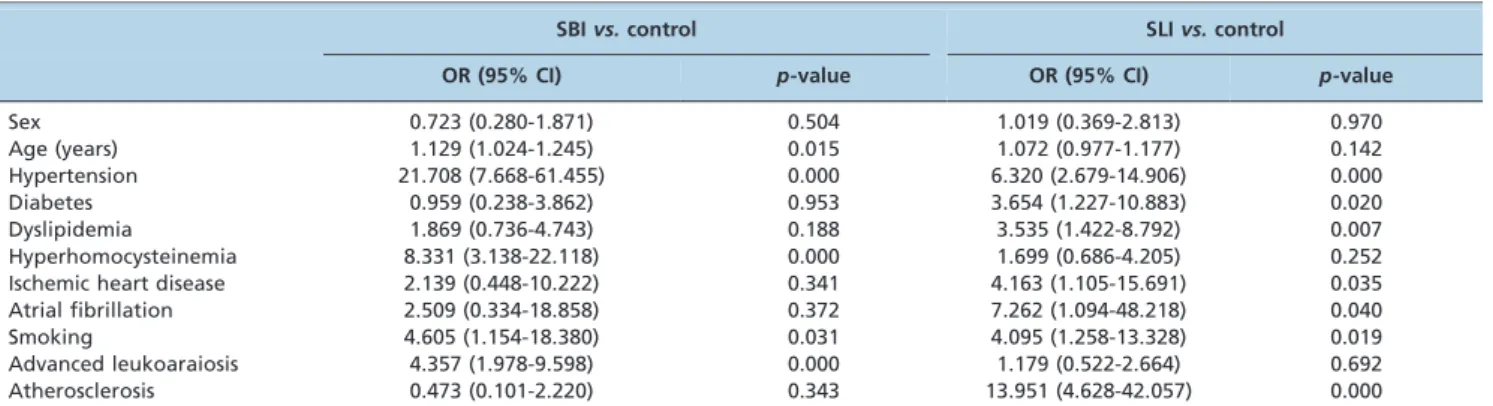
Risk factors of SBIs and SLIsvs.the control group
Multiple regression models were constructed to identify the risk factors for different infarcts. The control group served as a reference, and the SS group was excluded. Sex, age, hypertension prevalence, DM, dyslipidemia, HHCY, IHD, AF, smoking, AS of relevant arteries, and ad-LA were added to the two models. The results are listed in Table 3.
Locations of SBIs and SLIs
The locations of the SBIs and SLIs in the SBI, SLI, and SS groups were subsequently investigated, and the results are listed in Table 4. Compared with SLIs, more SBIs were located in the corona radiata (p,0.01) and fewer were located in the internal capsule and brainstem (p,0.01 for both locations).
Size and evolution of infarcts
The diameters of the SBIs and SLIs were compared among groups and different time points. The average diameters of the SBIs and SLIs were determined based on all infarcts in the SBI, SLI, and SS groups. The comparisons among different time points were performed based on the MR images of 63 patients, i.e., 32 patients with 67 SBIs and 31 patients with 31 old SLIs obtained at different times. The results indicated that the sizes of the SBIs changed slightly after an average period of 13.4 months, whereas the SLIs shrank considerably after 13.0 months to final sizes nearly equal to those of the SBIs (p= 0.24). The details of this analysis are shown in Table 5.
& DISCUSSION
This study revealed that the risk factors for the SBI and SLI groups differed to some extent and that the risk factors of the SS group were similar to those of the SBI group. The main risk factors for SBIs were hypertension, age, and HHCY; the main risk factors for SLIs were hypertension, DM, dyslipidemia, IHD, and AF. Patients with SBIs had long-term hypertension with a high prevalence of ad-LA, whereas the prevalence of AS in relevant arteries was much higher in the SLI and SS groups. Based on these different risk factors and features, the specific mechanisms of arterial occlusion can be speculated to differ between SBIs and SLIs. The classic mechanisms of SVDs, such as arteriolosclerosis caused by long-term hypertension, may be the main pathogenesis of SBIs. However, AS and embolisms are more important for SLIs (5,10,13,14). The specific hyperten-sion and leukoaraiosis-related pathogenesis of SBIs differs from the pathogenesis of SLIs and may be the main reason for the ‘silence’ of SBIs.
Leukoaraiosis represents incomplete ischemia caused by the stenosis of small vessels. This condition progresses with age, and long-term hypertension that causes chronic arteriolosclerosis and arteriolar stenosis further aggravates the ischemia (15,16). Furthermore, SBIs are commonly found to coexist with leukoaraiosis (17). Thus, incomplete and chronic ischemia may also be the basis for SBIs. Prior to the appearance of SBIs, the particular region supplied by the arteriole with chronic arteriolosclerosis may be irreversibly and covertly impaired because of ischemia and may gradually lose its function. SBIs form after the threshold of ischemic stress is broken by the progress of ischemia. Thus, the ‘silence’ of SBIs can be explained by chronic ischemic
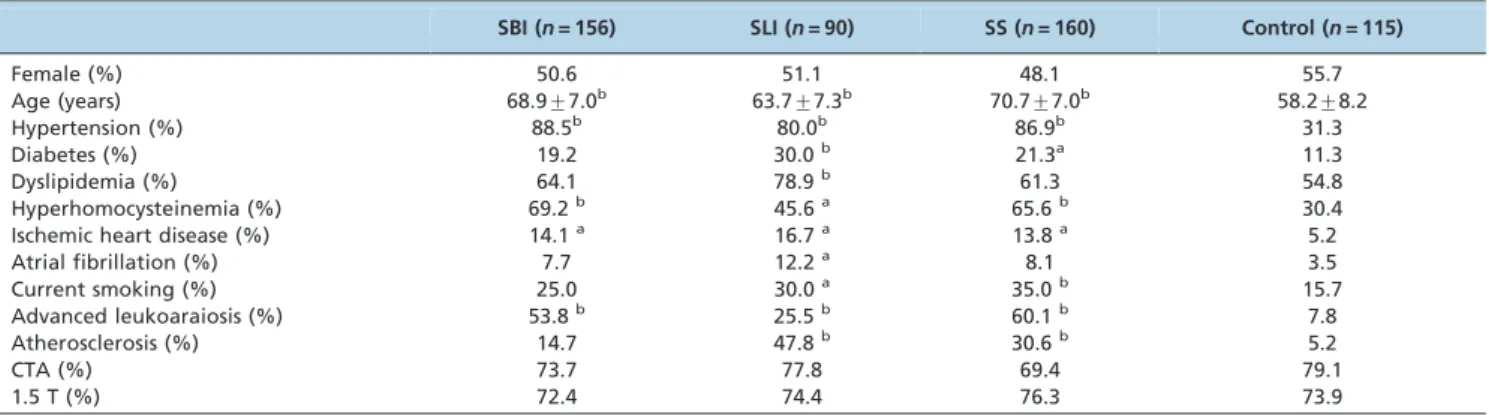
Table 1 -Baseline characteristics of the different groups.
SBI (n= 156) SLI (n= 90) SS (n= 160) Control (n= 115)
Female (%) 50.6 51.1 48.1 55.7
Age (years) 68.9¡7.0b 63.7¡7.3b 70.7¡7.0b 58.2¡8.2
Hypertension (%) 88.5b 80.0b 86.9b 31.3
Diabetes (%) 19.2 30.0b 21.3a 11.3
Dyslipidemia (%) 64.1 78.9b 61.3 54.8
Hyperhomocysteinemia (%) 69.2b 45.6a 65.6b 30.4
Ischemic heart disease (%) 14.1a 16.7a 13.8a 5.2
Atrial fibrillation (%) 7.7 12.2a 8.1 3.5
Current smoking (%) 25.0 30.0a 35.0b 15.7
Advanced leukoaraiosis (%) 53.8b 25.5b 60.1b 7.8
Atherosclerosis (%) 14.7 47.8b 30.6b 5.2
CTA (%) 73.7 77.8 69.4 79.1
1.5 T (%) 72.4 74.4 76.3 73.9
a p,0.05,b
p,0.01vs.the control group.
Table 2 -Positive results of the multiple comparisons.
SBI groupvs.SLI group
SBI groupvs. SS group
SLI groupvs. SS group
Ageb Age Ageb
Diabetes Smoking Dyslipidemiab
Dyslipidemia Atherosclerosisb Hyperhomocysteinemiab Hyperhomocysteinemiab Advanced leukoaraiosisb Advanced leukoaraiosisb Atherosclerosisb
Atherosclerosisb NIH Stroke Scale scores
preconditioning and long-term ischemic tolerance. The comparison of the results between the SLI and SS groups in this study supports this explanation. The SS group consisted of significantly older patients than the SLI group, with longer hypertension durations but lower NIHSS scores. The lower NIHSS scores can be attributed to the neuropro-tective effect of SBIs similar to the effects of previous transient ischemic attacks (TIA) (18-20). For both TIA and SBIs, ischemic preconditioning and ischemic tolerance may be the most reasonable explanations for this effect (21-23).
Another possible mechanism for the ‘silence’ based on chronic ischemia is that the cavity of an SBI may gradually form within several days or even months with the progression of ischemia similar to the chronic progression of leukoaraiosis (15) (i.e., no stroke-onset and neurologic symptoms). In fact, some SBIs are difficult to distinguish from focal leukoaraiosis. In our study on the evolution of infarctions, we observed that several SBIs tended to enlarge over time. However, this trend was not obvious and cannot be supported without frequent follow-up MRIs.
However, this study revealed that AS of relevant arteries was a strong risk factor for SLIs. In fact, Fisher and Caplan’s pathological studies in the last century demonstrated that AS in perforating and parent arteries was an important cause for SLIs (14,24). Some recent imaging studies also verified the association between SLIs and AS in parent and other relevant arteries (25-27). In addition, AS in parent arteries without obvious lumen stenosis and in perforating arteries could not be detected by most imaging tools; therefore, it might be underestimated as a common cause for SLIs (27). Our results verified the association between SLIs and AS. However, IHD and AF were also identified as risk factors for single SLIs in this study. It has been suggested that single SLIs could also be caused by a cardiac embolism (10,28). Therefore, the pathogenesis of some SLIs, particularly those without coexisting SBIs, might be differ-ent from the chronic and incomplete ischemic pattern of
SBIs and instead may be similar to the pattern of large infarctions caused by acute and complete arterial occlusion due to AS or embolism. The benefit of thrombolytic therapy (29) for SLI patients could also support this conclusion. In addition, most patients in the SLI group did not have leukoaraiosis or long-term hypertension. With a different pattern of arterial occlusion due to a different pathogenesis and without the pathological basis of chronic ischemia and neuroprotection of ischemic tolerance, these SLIs resulted in acute symptoms.
However, it is difficult to explain the overt symptoms of those SLIs without identified AS or with coexisting SBIs and leukoaraiosis. It is still possible that some of the SLIs might be related to acute and complete occlusion caused by undetectable AS of perforating arteries (27). However, this hypothesis cannot be proven without pathological evidence. Meanwhile, it is not reasonable to attribute all of those SLIs to AS. The different locations can also be a possible reason for the ‘silence’ and ‘overtness’ of the infarcts. This study showed that more SBIs were identified in the corona radiata and basal ganglia; these locations were different from the distribution of SLIs. Compared with the internal capsule and brain stem, where more important conducting bundles and nuclei are concentrated, the corona radiata and basal ganglia are relatively nonstrategic areas, where small infarctions may cause only mild or even no symptoms.
This study also confirmed that the average final size of the SLIs was nearly equal to that of the SBIs. Therefore, the amount of brain tissue destroyed by the SLIs may be equal to the amount for the SBIs; consequently, the size-related explanation for the ‘silence’ of SBIs might not be reasonable. The overestimation of the infarction size using DWIs may be caused by acute inflammation and edema, which exacerbate neurologic symptoms (30,31). These pathological changes were also reported to be related to acute and complete
Table 3 -Risk factors for SBI and SLIvs.the control group.
SBIvs.control SLIvs.control
OR (95% CI) p-value OR (95% CI) p-value
Sex 0.723 (0.280-1.871) 0.504 1.019 (0.369-2.813) 0.970
Age (years) 1.129 (1.024-1.245) 0.015 1.072 (0.977-1.177) 0.142
Hypertension 21.708 (7.668-61.455) 0.000 6.320 (2.679-14.906) 0.000
Diabetes 0.959 (0.238-3.862) 0.953 3.654 (1.227-10.883) 0.020
Dyslipidemia 1.869 (0.736-4.743) 0.188 3.535 (1.422-8.792) 0.007
Hyperhomocysteinemia 8.331 (3.138-22.118) 0.000 1.699 (0.686-4.205) 0.252
Ischemic heart disease 2.139 (0.448-10.222) 0.341 4.163 (1.105-15.691) 0.035
Atrial fibrillation 2.509 (0.334-18.858) 0.372 7.262 (1.094-48.218) 0.040
Smoking 4.605 (1.154-18.380) 0.031 4.095 (1.258-13.328) 0.019
Advanced leukoaraiosis 4.357 (1.978-9.598) 0.000 1.179 (0.522-2.664) 0.692
Atherosclerosis 0.473 (0.101-2.220) 0.343 13.951 (4.628-42.057) 0.000
Table 4 -Locations of the SBIs and SLIs.
SBI (n= 702) SLI (n= 250)
Basal ganglia 176 (25.07%) 48 (19.2%)
Thalamus 93 (13.25%) 25 (10.00%)
Internal capsule 51 (7.26%) 60 (24.00%)b Corona radiata 308 (43.87%) 53 (21.20%)b
Brainstem 74 (10.54%) 64 (25.60%)b
a p,0.05,b
p,0.01.
Table 5 -Size and evolution of the infarcts.
SBI SLI
Average diameter on T1/FLAIR (mm) 7.9¡2.8 13.9¡4.3b Average diameter on a DWI (mm) – 14.2¡5.0 Previous diameter on T1/FLAIR (mm)c 8.0¡2.3 14.0¡3.9b Previous diameter on a DWI (mm)c – 14.3
¡4.5 Duration of two time points of MRI
(months)c
13.4¡3.5 13.0¡3.3
Follow-up diameter on T1/FLAIR (mm)c 8.1¡2.3 8.7¡2.7
a p,0.05,b
ischemia (31) and were not obvious in the pathogenesis of SBIs observed in the current study. Therefore, this differ-ence between the evolution of SBIs and SLIs can also be attributed to the different patterns of ischemia and occlusion emphasized above.
In conclusion, this study showed that the ‘silence’ of SBIs can be attributed to chronic ischemic preconditioning and long-term ischemic tolerance but not to the infarction size. The nonstrategic locations of these infarcts can also partly account for the ‘silence’. The strengths of this study included the consecutive study design with a relatively large sample size, multiple groups, and comparisons of different patterns. However, this study also had limitations. First, the study was not based on the general population, and the results may be influenced by the limited representa-tiveness of the sample selected from hospitalized patients. Second, the study was based on clinical data and neuroima-ging, and the results of the pathogenesis of SBIs and SLIs were speculated without confirmation by pathological examination. We cannot expound further on the pathogen-esis, and more comprehensive studies are required.
& ACKNOWLEDGMENTS
This study was supported by grants from the National Natural Science Foundation of China (No. 81000492, No. 30971029, and No. 81171163).
& AUTHOR CONTRIBUTIONS
Feng C led the study design, data acquisition, data analysis, and manuscript writing. Bai X, Xu Y, and Hua T assisted with the data acquisition, data analysis, and manuscript writing. Liu XY assisted with the study design, data analysis, and manuscript review.
& REFERENCES
1. Vermeer SE, Longstreth WT, Jr., Koudstaal PJ. Silent brain infarcts: a systematic review. Lancet Neurol. 2007;6(7):611-9, http://dx.doi.org/10. 1016/S1474-4422(07)70170-9.
2. Moran C, Phan TG, Srikanth VK. Cerebral small vessel disease: a review of clinical, radiological, and histopathological phenotypes. Int J Stroke. 2012;7(1):36-46.
3. Pantoni L. Cerebral small vessel disease: from pathogenesis and clinical characteristics to therapeutic challenges. Lancet Neurol. 2010;9(7):689-701, http://dx.doi.org/10.1016/S1474-4422(10)70104-6.
4. Zhu YC, Dufouil C, Tzourio C, Chabriat H. Silent Brain Infarcts: A Review of MRI Diagnostic Criteria. Stroke. 2011;42(4):1140-5, http://dx. doi.org/10.1161/STROKEAHA.110.600114.
5. Boiten J, Lodder J, Kessels F. Two clinically distinct lacunar infarct entities? A hypothesis. Stroke. 1993;24(5):652-6, http://dx.doi.org/10. 1161/01.STR.24.5.652.
6. Benavente O, Tonarelli C, Pergola S. DWI overestimates the ultimate size of lacunar infarcts: analysis from SPS3. Stroke. 2007;38:487.
7. Koch S, McClendon MS, Bhatia R. Imaging evolution of acute lacunar infarction: leukoariosis or lacune? Neurology. 2011;77(11):1091-5, http:// dx.doi.org/10.1212/WNL.0b013e31822e1470.
8. Moreau F, Patel S, Lauzon ML, McCreary CR, Goyal M, Frayne R, et al. Cavitation After Acute Symptomatic Lacunar Stroke Depends on Time, Location, and MRI Sequence. Stroke. 2012;43(7):1837-42, http://dx.doi. org/10.1161/STROKEAHA.111.647859.
9. Arauz A, Murillo L, Cantu C, Barinagarrementeria F, Higuera J. Prospective study of single and multiple lacunar infarcts using magnetic resonance imaging: risk factors, recurrence, and outcome in 175 consecutive cases. Stroke. 2003;34(10):2453-8, http://dx.doi.org/10. 1161/01.STR.0000090351.41662.91.
10. Khan U, Porteous L, Hassan A, Markus HS. Risk factor profile of cerebral small vessel disease and its subtypes. Journal of neurology, neurosur-gery, and psychiatry. 2007;78(7):702-6.
11. Potter GM, Doubal FN, Jackson CA, Chappell FM, Sudlow CL, Dennis MS, et al. Counting cavitating lacunes underestimates the burden of lacunar infarction. Stroke. 2010;41(2):267-72, http://dx.doi.org/10.1161/ STROKEAHA.109.566307.
12. Fazekas F, Chawluk JB, Alavi A, Hurtig HI, Zimmerman RA. MR signal abnormalities at 1.5 T in Alzheimer’s dementia and normal aging. AJR Am J Roentgenol. 1987;149(2):351-6.
13. Fisher CM. The arterial lesions underlying lacunes. Acta Neuropathol. 1968;12(1):1-15.
14. Fisher CM. Capsular infarcts: the underlying vascular lesions. Arch Neurol. 1979;36(2):65-73, http://dx.doi.org/10.1001/archneur.1979. 00500380035003.
15. Pantoni L. Pathophysiology of age-related cerebral white matter changes. Cerebrovasc Dis. 2002;13 Suppl 2:7-10, http://dx.doi.org/10.1159/ 000049143.
16. Xiong YY, Mok V. Age-Related White Matter Changes. J Aging Res. 2011;2011:617927.
17. Chen X, Wen W, Anstey KJ, Sachdev PS. Prevalence, incidence, and risk factors of lacunar infarcts in a community sample. Neurology. 2009 Jul 28;73(4):266-72, http://dx.doi.org/10.1212/WNL.0b013e3181aa52ea. 18. Kim YS, Park SS, Lee SH, Yoon BW. Reduced severity of strokes in
patients with silent brain infarctions. Eur J Neurol. 2011;18(7):962-71. 19. Fu Y, Sun JL, Ma JF, Geng X, Sun J, Liu JR, et al. The neuroprotection of
prodromal transient ischaemic attack on cerebral infarction. European Journal of Neurology. 2008;15(8):797-801, http://dx.doi.org/10.1111/j. 1468-1331.2008.02188.x.
20. Moncayo J, de Freitas GR, Bogousslavsky J, Altieri M, van Melle G. Do transient ischemic attacks have a neuroprotective effect? Neurology. 2000;54(11):2089-94, http://dx.doi.org/10.1212/WNL.54.11.2089. 21. Dirnagl U, Becker K, Meisel A. Preconditioning and tolerance against
cerebral ischaemia: from experimental strategies to clinical use. Lancet Neurol. 2009;8(4):398-412, http://dx.doi.org/10.1016/S1474-4422(09) 70054-7.
22. Weber R, Diener HC, Weimar C, German Stroke Study C. Why do acute ischemic stroke patients with a preceding transient ischemic attack present with less severe strokes? Insights from the German Stroke Study. European Neurology. 2011;66(5):265-70, http://dx.doi.org/10.1159/ 000331593.
23. Lehotsky´ J, Urban P, Pavlı´kova´ M, Tatarkova´ Z, Kaminska B, Kapla´n P. Molecular Mechanisms Leading to Neuroprotection/Ischemic Tolerance: Effect of Preconditioning on the Stress Reaction of Endoplasmic Reticulum. Cell Mol Neurobiol. 2009;29(6-7):917-25, http://dx.doi.org/ 10.1007/s10571-009-9376-4.
24. Caplan LR. Intracranial branch atheromatous disease: a neglected, understudied, and underused concept. Neurology. 1989;39(9):1246-50, http://dx.doi.org/10.1212/WNL.39.9.1246.
25. Wen L, Feng J, Zheng D. Heterogeneity of single small subcortical infarction can be reflected in lesion location. Neurol Sci. 2012. 26. Choi HY, Yang JH, Cho HJ, Kim YD, Nam HS, Heo JH. Systemic
atherosclerosis in patients with perforating artery territorial infarction. Eur J Neurol. 2010;17(6):788-93.
27. Kim JS, Yoon Y. Single subcortical infarction associated with parental arterial disease: important yet neglected sub-type of atherothrombotic stroke. Int J Stroke. 2012; http://dx.doi.org/10.1111/j.1747-4949.2012. 00816.x.
28. Wessels T, Rottger C, Jauss M, Kaps M, Traupe H, Stolz E. Identification of embolic stroke patterns by diffusion-weighted MRI in clinically defined lacunar stroke syndromes. Stroke. 2005;36(4):757-61, http://dx. doi.org/10.1161/01.STR.0000158908.48022.d7.
29. Fuentes B, Martinez-Sanchez P, de Lecinana MA, Egido J, Reig-Rosello G, Diaz-Otero F, et al. Efficacy of intravenous thrombolysis according to stroke subtypes: the Madrid Stroke Network Data. Eur J Neurol. 2012;19(12):1568-74.
30. Youn CS, Choi SP, Kim SH, Oh SH, Jeong WJ, Kim HJ, et al. Serum highly selective C-reactive protein concentration is associated with the volume of ischemic tissue in acute ischemic stroke. Am J Emerg Med. 2012;30(1):124-8.