Abstract — This paper provides an overview of the activities in the area of bio-materials characterization and imaging at the High Energy X-ray laboratory (HEX-lab) in the Department of Engineering Science, University of Oxford, UK, and at collaborating laboratories. We describe the variety of experimental arrangements in use and present the results pertaining to the structural and mechanical characterization (deformation and stress) across multiple scales of interest, from micro- to meso- to macro-scopic levels.
I. INTRODUCTION
HE characterization of the structure and deformation behavior of bio-materials plays a pivotal, underpinning role in the improvement of understanding of the property-performance relationship (together with micro-structural and micro-mechanical modeling, e.g. by FEM).
The research carried out at the High Energy X-ray laboratory (HEX-lab) in the Department of Engineering Science at Oxford utilizes mono- and poly-chromatic beams of energetic X-ray photons for the purposes of imaging, spectroscopic analysis and diffraction. Some of the studies are carried out using sealed X-ray tubes with Cu and W targets. Others make use of the environmental Scanning Electron Microscope (e-SEM) or optical imaging. Finally, range of experiments that require ultimate precision and spatial or temporal resolution are carried out at the nearby Harwell Oxford site. The Centre for In situ Processing Studies (CIPS) housed at the Research Complex at Harwell (RCaH) supports experiments at ISIS neutron and muon spallation source, and also at Diamond Light Source (DLS) synchrotron facility. As frequently in the modern practice, only when a vast range of analytical tools is brought to bear upon individual problems may complementary characterization and multi-aspect view be achieved.
* Manuscript received Apr 29, 2012; revised Apr 30, 2012.
Tan Sui is doctoral student in the Department of Engineering Science, University of Oxford, UK, OX1 3PJ (e-mail: [email protected]).
Dr Felix Hofmann was doctoral student and Research Associate with the University of Oxford, UK, OX1 3PJ, and is now with the Department of Chemistry, MIT, 77 Massachusetts Ave., Cambridge, MA 02139-4307 (e-mail: [email protected]).
Dr Xu Song was doctoral student and Research Associate with the University of Oxford, UK, OX1 3PJ, and is now with the Singapore Institute of Manufacturing Technology, A* Star, Singapore, 638075 (e-mail: [email protected]).
Li Tao is doctoral student in the Department of Mechanical Engineering, NUS, 9 Engineering Drive 1, EA#07-08, Singapore 117576.
Kaiyang Zeng is Associate Professor, NUS Dept of Mechanical Engng, 9 Engng Drive 1, EA#07-08, Singapore 117576; [email protected]).
Alexander M. Korsunsky is Professor of Engineering Science in the University of Oxford, OX1 3PJ, UK (corresponding author, tel: +44-18652-73043; fax: +44-18652-73010; e-mail: [email protected]).
In this paper we present an overview of several recent studies of bio-materials, and illustrate how multi-scale and multi-technique characterization underpins the development of novel insights.
II. MULTI-SCALE CHARACTERISATION OF HUMAN DENTAL TISSUES BY WIDE AND SMALL-ANGLE X-RAY DIFFRACTION Human teeth consist of the root(s) and the crown. The hard tissue (enamel) covering the crown, is a highly mineralized substance containing approximately 97% by weight of inorganic mineral hydroxyapatite [1]. The large mineral content of the enamel accounts not only for its strength, hardness and wear resistance, but also for its brittleness [2],[3]. The layer lying immediately below the enamel is called dentin or dentine, a softer tissue compared with enamel, containing 70% of the mineral hydroxyapatite, 20% of organic material and 10% of water (by weight) [4]. Two mineralized load-bearing tissues combine and form a complex and mechanically durable interface called the
Dentin-Enamel Junction (DEJ) that contributes to the life-long success story: unless diseased, this interface never fails, despite the extreme thermo-mechanical loading in the oral cavity. This remarkable performance of nature’s designs provides the motivation for numerous investigations into the details of the micro- and nano-structure of enamel, dentin, and their junction. Insight into this hierarchical structure is essential for understanding the remarkable load-bearing function of the tooth, and for developing successful biomimetic therapeutic solutions.
A number of powerful approaches for the characterization of material structures across the scales make use of X-ray imaging and scattering. In the present study we focus on the analysis of scattering of high energy, high brightness synchrotron X-ray beams. More specifically, we analyze the data obtained in two regimes commonly referred to as Small Angle X-ray Scattering (SAXS) and Wide Angle X-ray Scattering (WAXS). Using Bragg’s law and its definition of the scattering vector q is expressed as:
sin 4 2
d
q (6)
Here d denotes the real space dimension governing the X-ray scattering, λ is the radiation wavelength, and 2 is the scattering angle. As a consequence, objects with large real space dimensions correspond to features observed at small scattering angles, and vice versa. The combination of SAXS and WAXS provides an advanced method for multi-scale characterization: from nanometers (SAXS) down to the sub-nanometer (WAXS) of crystal structure [5].
In this paper we demonstrate the feasibility of using high-energy synchrotron X-ray scattering set-up, which
Bio-materials Characterization Across Multiple
Scales at Oxford HEX-lab
Tan Sui, Felix Hofmann, Xu Song, Li Tao, Kaiyang Zeng and Alexander M. Korsunsky*
opens new experimental capabilities with several obvious advantages over the low energy set-up [6], [7], to explore the multi-scale nature of the main structural features of dental tissue. In order to achieve that, SAXS/WAXS data collection and analysis were carried out simultaneously. Characterizing the arrangement and size variation of particles from SAXS and lattice parameters from WAXS should eventually guide the description of human teeth structures, and create a platform for further tissue engineering or biomimetic developments using high-energy synchrotron X-ray.
A. Sample Preparation
The sample used was a section through a human tooth that was cut into a slice containing regions of enamel, dentin, and DEJ. The slice had the dimensions of 3.39 mm × 1.29 mm × 0.5 mm. The sample was stored in buffered formalin to preserve the tissue from decay/bacterial/fungal growth. Before X-ray experiment the sample was washed and stored temporarily in PBS.
B. Synchrotron X-ray Diffraction experiments
Experiments were performed on the I12 JEEP (Joint Engineering, Environmental and Processing) beamline at Diamond Light Source (DLS, Oxford, UK) using monochromatic X-rays of wavelength = 0.233Å (53 keV), with spot size (~0.5 mm × 0.5 mm). The distance between the sample and detector (1950 mm) guaranteed that both SAXS and WAXS patterns could be obtained simultaneously with one high energy area detector (Thales Pixium RF4343, CsI scintillator on amorphous Si substrate, 2880 × 2881 matrix of 148 µm × 148 µm pixels covering the active area of about 420 mm × 420 mm). The sample was mounted upright in the air. Scattering patterns were collected repeatedly in transmission mode from fixed locations within the sample slice.
C. SAXS Data Evaluation Mean Crystal Thickness
To determine the mean crystal thickness, the 2D SAXS patterns shown in Fig.1 were collected and analyzed. The scattering intensity was integrated with respect to the azimuthal angle to obtain the 1D functionI(q), where q
denotes the scattering vector given in Eq.1 [8], [9]. For high values ofq, I(q) obeys Porod’s law given by I(q)Pq4, where P is the Porod constant. The general expression for
Pis given by [10]
0 2
) (q dq I q V S P
(7) whereV is the total volume of the crystals, andS is their total surface area. Thus, without any assumption for the shape model of the crystals, “mean crystal thickness” T given by
S V
T 4 / [11]-[13] is used.
0
2 ( )
4
dq q I q P T
(8) The results obtained from the four locations within the slice samples are listed in Tab. III. It is apparent that the mean crystal thickness varies as the function of position.
Orientation of Particles
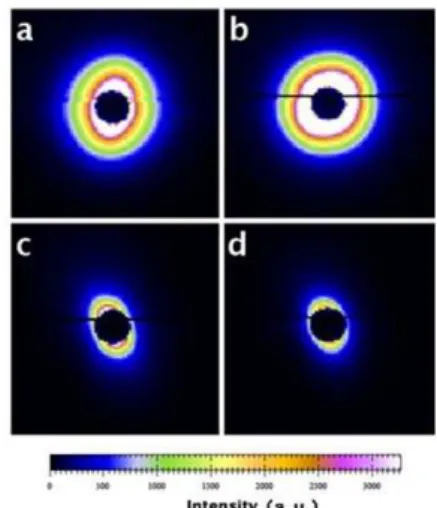
Fig.15 (a)~(d) [14] illustrates the sensitivity of the SAXS pattern to the degree of particle alignment. SAXS pattern for dentin in Fig.1 (a) shows no obvious alignment. As the location of the gauge volume moves from dentin to enamel, the shape of the SAXS pattern changes from circle to ellipse. This indicates that the alignment becomes more apparent, i.e. the particle distribution within the enamel acquires a distinct preferred orientation. Note that the black horizontal line seen in Fig.15 is an artefact of the measurement that could not be removed completely, but was found to have no influence on the alignment analysis.
Fig.15. 2D SAXS patterns: figures (a)-(d) correspond to sample position 1 to 4 respectively.
In order to quantify the degree of particle orientation, was defined as the “degree of orientation”, where the value ranges from 0 to 1, with 0corresponds to no predominant orientation, while 1 corresponds to all crystals being perfectly aligned [11], [15]. The 1D azimuthal variation curve of radially integrated intensity was obtained using Fit2D program [16]. The final values of were indicated in Table III. The variation of reflects that most of the mineral particles are randomly orientated within dentin. However, upon approaching enamel, stronger preferred orientation emerges.
Table III Results of SAXS data evaluation from various positions
T (nm) 0
Position 1 5.22 80° 0.16
Position 2 4.24 65° 0.21
Position 3 2.46 115° 0.53
Position 4 2.95 105° 0.48
D. WAXS Data Evaluation
Crystallographic Parameters
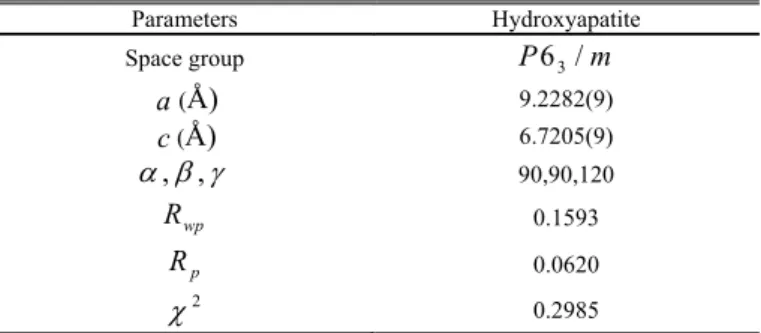
The inorganic phase in dental tissue is hydroxyapatite 2
6 4
10(PO ) OH
Rietveld refinement software package [20]. The WAXS diffraction pattern of integrated intensity vs. scattering angle 2 from position 4 is shown in Fig.16. It is apparent that the good quality of diffraction profile fitting for hydroxyapatite could be achieved between the observed (marked with “×”) and the fitter data (continuous curve), since the bottom curve represents the difference plot. The final parameters and errors (described by 2,
wp
R and Rp ) obtained from the WAXS pattern refinement are listed in Table IV .
Fig.16. Typical diffraction pattern of hydroxyapatite from GSAS
Crystallographic texture
Fig.17 shows the Debye-Scherrer rings obtained from different positions within the sample. Each ring corresponds to a certain set of lattice planes described by the (hkl) Miller indices. Crystallographic texture manifests itself through the absence of some rings, or through some rings showing a strong variation in intensity with the azimuthal angle. From Fig.17 (b)~(d), it is clear that the “002” Debye ring (circular arcs) indicates an apparent preferred orientation along the “002” reflection. Meanwhile, much less variation in intensity around the ring is observed at Fig.17 (a) (dentin). The intensity of the “002” ring becomes stronger with the position moving from dentin to enamel. This reveals that the hard dental tissue predominately shows texture within the enamel.
Fig.17. Illustration of SAXS/WAXS patterns. Figures (a)-(d) correspond to the positions 1-4, respectively. The incomplete “002” ring is indicated.
By comparison between the values variation of in Tab. III and strength of texturing in “002” ring, a match is observed between SAXS and WAXS patterns data analysis, despite them relating to two different length scales. It is apparent from Fig.17 (c), (d) that the preferred orientation of the crystal lattice (WAXS texture) is correlated with the orientation of the nano-grains of hydroxyapatite (SAXS degree of orientation). This confirms that nano-crystals of hydroxyapatite possess a habit (exterior shape) that is crystallographically motivated, i.e. the particle shape is correlated with the lattice orientation within particles. It can be concluded that the present study reveals hard dental tissue
to be a multi-scale, hierarchically structured material optimized for its mechanical function.
Table IV Refined structural parameters for position 4 Parameters Hydroxyapatite
Space group P63/m
a(Å) 9.2282(9)
c(Å) 6.7205(9)
, , 90,90,120
wp
R 0.1593
p
R 0.0620
2
0.2985
E. Conclusion
High energy X-ray scattering techniques offer valuable additions to lower energy X-ray analysis methods. From the quantitative analysis of both SAXS and WAXS patterns, multi-scale characterization of the hierarchical structure of dental tissue could be obtained, the arrangement and size variation of crystallites was obtained from SAXS data interpretation, while crystallographic texture and lattice unit cell information was extracted from the patterns acquired by WAXS. It is hoped that the results would provide knowledge of the structure-function relationships governing the human dental tissue, and allow better bio-mimetic materials to be designed selected.
III. LOCAL ORIENTATION ANALYSIS OF ABALONE NACRE BY MICRO-BEAM LAUE DIFFRACTION
A. Introduction
Nacre, or mother-of-pearl, is a typical biomineralisation product that has provided the motivation for numerous studies into the details of its micro- and nano-structure because of its remarkable mechanical properties [21]. However, the formation (growth) mechanisms are not completely understood. The nacreous layer is composed of about 95% inorganic tablet-shaped single crystals of thin aragonite (a mineral form of CaCO3) by weight with a
thickness of 0.25-0.4µm and edge lengths of 5-10µm (aspect ratio <0.1) [22]. All these flat tablets are oriented with the c-axis aligned almost normal to their interface i.e. the tablets are arranged like brick-mortar architecture [23]. Such characteristic microstructure gives nacre a higher toughness compared to the geological aragonite CaCO3 [24].
Recent studies have demonstrated that the c-axis of different nacre tablets are not all perfectly parallel to each other between subsequent layers (by traversing a cross-section) [21]. The orientation inhomogeneity may demonstrate that nature makes ingenious use of small crystal misorientations in order to optimize the mechanical performance in terms of the strength and toughness of these composite structures. These intricate interrelationships have long fascinated scientists, but have not yet been well explained [25]. Therefore, understanding the micro-/nano-scopic origin of the macroscopic properties achieved by nature’s ingenious designs is of great importance.
orientation. The principle is akin to the classical Laue diffraction in which a single crystal sample is illuminated with a polychromatic beam. The strong demand for structural characterization of objects with ever decreasing sizes has driven forward the development of micro-beam Laue diffraction method, and made BM32 at ESRF an attractive beamline for research on hard tissue microstructure of biomaterials.
In the current study, presence of small tablet misorientation on nacreous surface of green abalone seashell was investigated by micro-beam Laue diffraction experiment. We hope the investigation of misorientation may help understand the remarkable toughening effect achieved by the characteristic “roman brick wall” micro-structure and ultimately allow better biomimetic materials to be made.
B. Materials and methods
Sample preparation
Fresh Australia abalones (approximately size of 50mm in length, 30mm in width and shell thickness about 600 m) were purchased from market and the fresh shucked shells were stored in tap water at room temperature. Flat and defect-free surface is required for Laue diffraction experiment, thus the shells had to be finely polished. Firstly, the abalone shell was cut into fragments of desired size. Fragments were embedded in the epoxy resin (Fig. 18), followed by a series of grinding processes with 1200#, 2400#, and 4000# sand papers and then were polished by 0.3 m and 0.05 m alumina powder with fine polishing cloth. Calcite layer was polished away with nacre layer left. Finally, the polished sample was cleaned by ultrasound. Fig. 18 clearly shows the microstructure of nacre layer perpendicular to the plane of tablets. After being blow-dried, samples were stored in sample box under ambient condition.
Fig. 18. Topographical image of nacre layer of abalone shell
Experimental set-up and measurement
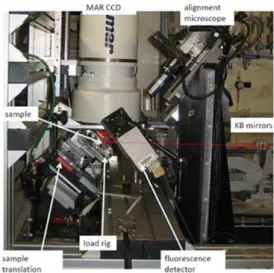
Micro-beam Laue diffraction set-up (beam diameter <1 µm) is well-established on bending magnet beamline BM32 (ESRF), routinely with the spectral range 7-30 keV. The sample is mounted on the stage at 40o angle with the incoming beam. MAR CCD detector with distortion correction, guaranteeing low pixel positioning errors, is used to record the Laue diffraction patterns. The detector is placed vertically above the sample, making 90o angle with respect to the incident beam (Fig. 19).
Fig. 19. Micro-beam Laue diffraction set-up on BM32 (ESRF)
A Ge sample was assumed to be strain-free and used for calibration. LaueTools [27] refinement of Ge patterns was used to determine the sample to detector distance (Distance) and detector centre position (xcent and ycent). Micro-beam Laue diffraction measurements were carried out on a green abalone shell. The use of incident X-ray beam of size 1.3 µm ×1.6 µm was sufficient to guarantee that the spot size was smaller than the dimension of one tablet in the nacre layer. A map of Laue diffraction measurements was collected, with the spacing between each measurement point of 13×31 spots was 1 µm both in horizontal and vertical directions.
C. Data Evaluation
The fundamental theory behind the interpretation of Laue diffraction patterns is briefly introduced as follows. The vector r in reciprocal space crystal coordinates can be converted to reciprocal Cartesian xyz coordinates, i.e.
r
c B
3 1 2
3 3 2
2 3 3
2 1
/ 1 0
0
) cos( ) sin( )
sin( 0
) cos( )
cos(
a b
b
b b
b
B
wherei(i=1,2,3) is the length of a unit cell lattice vector '
i
in real space and i(i=1,2,3) correspondingly is the length of the reciprocal space lattice vector '
i
of the unit cell. jis the angle between vectors of '
j and '
k
(i,j,k=1,2,3, i≠j≠k) in real space, while jis the angle between vectors of '
j and '
k
(i,j,k=1,2,3, i≠j≠k) in the corresponding reciprocal space. Vector c can then be transformed into Cartesian laboratory coordinate system lab using an orientation matrix U, such that lab Uc. For a given reflection Miller indices (hkl), the reflection normal from index of the reflection corresponding to lattice planes can be expressed in the laboratory frame as:
nhkl [UB]Ghkl (9) wherenhkl is the normalized version of the scattering vector q , G (h,k,l)'
Laue diffraction data interpretation can be complex and time consuming. LaueTools software [27], a novel open-source package developed by the BM32 team at ESRF (European Synchrotron Radiation Facility, Grenoble, France) offers automated analysis of micro-beam Laue diffraction data analysis, based on the comparatively straightforward indexation and progressive refinement process. In this paper, the use of LaueTools software will be reported to calculate micro-beam Laue diffraction patterns. It must be noted that firstly, correct calibration parameters need to be established for successful indexation and lattice orientation and strain analysis. The next step consists of building a list of pairs of experimental and simulated diffraction spots located close together, and refining sample orientation and lattice cell parameters to find the smallest pixel residues between all pairs. Repeated matching and refinement is carried on until as many Laue spots as possible have been indexed, and the rotation matrix and lattice parameters can be identified. The output in LaueTools is in terms of [UB] matrix in the laboratory frame. By performing this orientation analysis for each point in a one- or two-dimensional scan, the relative (mis)orientation between different points within the sample can be studied, and visualized. The results were plotted using MATLAB 3-D vectarrow script to visualize the orientation distribution for each scanned point.
D. Results and discussions
(a) (b)
Fig.20. Map of c-axis orientation of aragonite tablets.
The interpretation of the Laue patterns from the nacreous layer shows that the overall alignment of the c-axis of aragonite tablet is such that the [001] direction is almost coincident with the surface normal, as expected. However, not only the shell itself is curved, but even within a small region of nacreaous surface small misorientation exists compared to pure [001]. This is illustrated in Fig. 20 (a) and (b), which may reflect how the adjustment of crystal orientation occurs. The direction of pure [001] direction is along the z-axis in Fig. 20 (a), and each 3D vector represents the direction of c-axis in nacreous layer for each scanned point. Four distinct arrow colours were ascribed based on the tablets (grains) distribution in Fig.20 (a), and used to distinguish between adjacent regions. The length of the projection arrow (Fig. 20 (b)) indicates the vector deviation from z-axis, i.e. if it stays along z-axis perfectly, the projection should be a point. The longer the line is, the bigger the misorientation will be for each position. Meanwhile, the
direction of the short line in x-y plane also indicates the direction of the rotation of tablet plane around x-axis or y-axis.
Fig.21 shows a representation of the aragonite tablet orientation distribution obtained according from the micro-beam Laue diffraction patterns variation. The partition between the regions in Fig.21 (a) is marked with five different colours used to distinguish between adjacent regions. By comparing between Fig.21 (a) and Fig.20 (b), it is found that, in most cases, within each region (tablet), the distribution of misorientation seems to be approximately uniform but different between regions (tablets). The nacre growth mechanism may partially explain why the tablets have the uniform c-axis orientation but random in a- and b- axis, since the tablets nucleate first, and “expand” until they reach each other [28]. The misorientation in the nucleus will result in the misorientation of each tablet, but orientation will remain almost uniform within each individual tablet. Meanwhile, it is interesting to note that in some tablets variation of misorientation may exist. It seems to display a certain ordered nature, which may have influence on the mechanical properties or strengthening mechanisms.
(a)
Fig.21. Aragonite tablets distribution by micro-beam Laue diffraction patterns. (a) tablets distribution of 13×31 scanned points. (b)-(e) four distict
Laue diffraction patterns
E. Conclusion
In summary, the results from this study give initial insight into the small misorientation present in the naturally grown impact-resistant structures, such as a green abalone shell. Further investigation is needed of the relationship between crystal (mis)orientation and tablet morphology and strength. This information is essential for improving our understanding of the intricate link between crystallography and mechanical properties of these fascinating systems.
ACKNOWLEDGMENT
The valuable support of Prof. Gabriel Landini (School of Dentistry, University of Birmingham) during human dental tissue specimen collection and preparation is gratefully acknowledged.
AMK wishes to acknowledge EPSRC support through grants EP/H003215/1 and EP/I020691/1, and the use of facilities at the Research Complex at Harwell.
REFERENCES
[1] S. J. Marshall, M. Balooch and T. Breuning, “Human dentin and the dentin-resin adhesive interface”, Acta Mater, vol. 46(7), pp. 2529-2539, 1998.
[2] Blackwell, Bonnie, “Why teeth fossilize better than bone”, Dinosaur mailing list.
[3] L. H. He and M. V. Swain, “Enamel-A functionally graded natural coating”, J. Dent, vol. 37, pp. 596-603, 2009.
[4] A. R. Ten Cate, “Oral histology: development, structure, and function”, 5th ed.
[5] J. E. Daniels, D. Pontoni, R. P. Hoo and V. Honkima¨ki, “Simultaneous small- and wide-angle scattering at high X-ray energies”, J. Synchrotron Radiat, vol. 17, pp. 473-478, 2010.
[6] D. R. Haeffner, J. D. Almer and U. Lienert “The use of high energy X-rays from the Advanced Photon Source to study stresses in materials”, Mater. Sci. Eng., A, vol. 399 (1/2), pp. 120-127, 2005. [7] K. D. Liss, A. Bartels, A. Schreyer and H. Clemens, “High energy
X-rays: A tool for advanced bulk Investigations in materials science and physics”, Texture Microstruct., vol. 35 (3/4), pp. 219-252, 2003. [8] P. Fratzl, S. Schreiber and A. Boyde, “Characterization of bone
mineral crystals in horse radius by small-Angle X-Ray Scattering”,
Calcified Tissue Int., vol. 58(5). Pp. 341-346, 1996.
[9] P. Fratzl, M. Groschner, G. Vogl, H. Plenk Jr., J. Eschberger, N. Fratzl-Zelman, K. Koller and K. klaushofer, “Mineral Crystals in Calcified Tissues: A Comparative Study by SAXS”, J. Bone Miner. Res., vol. 7(3), pp. 329-334, 1992.
[10] P. Fratzl, N. Fratzl-Zelman, K. Klaushofer, G. Vogl and K. Koller, “Nucleation and growth of mineral crystals in bone studied by small-angle X-ray scattering”, Calcified Tissue Int., vol. 48, pp. 407-413, 1991.
[11] S. Rinnerthaler, P. Roschger, H. F. Jakob, A. Nader, K. Klaushofer and P. Fratzl, “Scanning Small Angle X-ray Scattering Analysis of Human Bone Sections”, Calcified Tissue Int., vol. 64(5), pp. 422-429, 1999. [12] P. Fratzl, “Statistical Model of the Habit and Arrangement of Mineral
Crystals in the Collagen of Bone”, J. Stat. Phys., vol. 77(1-2), pp. 125-143, 1994.
[13] A. Märten, P. Fratzl, O. Paris and P. Zaslansky, “On the mineral in collagen of human crown dentine”, Biomaterials, vol. 31(20), pp. 5479-5490, 2010.
[14] Sui T., Landini G., and Korsunsky A.M., “Investigation of the structure of human dental tissue at multiple length scales using high energy synchrotron X‐ray SAXS⁄WAXS”, Current Themes in Engineering Science 2010, AIP Conf. Proc. 1394, pp. 113-124; doi:http://dx.doi.org/10.1063/1.3649941, (2011).
[15] W. Tesch, N. Eidelman, P. Roschger, F. Goldenberg, K. Klaushofer and P. Fratzl, “Graded Microstructure and Mechanical Properties of Human Crown Dentin”, Calcified Tissue Int., vol. 69(3), pp. 147-157, 2001.
[16] A. P. Hammersley, “FIT2D: An Introduction and Overview”, ESRF Internal Report, ESRF97HA02T, 1997.
[17] R. A. Young and P. E. Mackie, “Crystallography of human tooth enamel: Initial structure refinement”, Mater. Res. Bull., vol. 15(1), pp. 17-29, 1980.
[18] R. M. Wilson, J. C. Elliott and S. E. P. Dowker, “Rietveld refinement of the crystallographic structure of human dental enamel apatites”, Am. Miner., vol. 84(9), pp. 1406-1414, 1999.
[19] R. M. Wilson, J. C. Elliott, S. E. P. Dowker and R. I. Smith, “Rietveld structure refinement of precipitated carbonate apatite using neutron diffraction data”, Biomaterials, vol. 25(11), pp. 2205-2213, 2004. [20] A. C. Larson and R. B. Von Dreele, General Structure Analysis System
(GSAS), Los Alamos National Laboratory Report LAUR, pp. 86-748, 2004.
[21] P.U.P.A. Gilbert, R. A. Metzler, D. Zhou, A. Scholl, etc. “Gradual Ordering in Red Abalone Nacre”, J. Am. Chem. Soc., vol. 130(51), pp. 17519-17527, 2008.
[22] C.M. Zaremba, A.M. Belcher, M. Fritz, Y.L. Li, S. Mann, P.K. Hansma, D.E. Morse, J.S. Speck, G.D. Stucky. “Critical Transitions in the Biofabrication of Abalone Shells and Flat Pearls”, Chem. Mater.,
vol. 8, pp. 679-690, 1996.
[23] L. Xie, X.X. Wang, J. Li. “The SEM and TEM study on the laminated structure of individual aragonitic nacre tablet in freshwater bivalve H. cumingii Lea shell”, J. Struct Bio., vol. 169, pp. 89-94, 2010. [24] J.D. Currey, “Mechanical properties of mother of pearl in tension”,
Proc. R. Soc. B, vol. 196, pp. 443–463, 1977.
[25] P. U. P. A. Gilbert, A. Young, S. N. “Coppersmith. Measurement of c-axis angular orientation in calcite (CaCO3) nanocrystals using X-ray absorption spectroscopy”, Proc. Natl. Acad. Sci., vol. 108(28), pp. 11350-11355, 2011.
[26] J.S. Chung, G.E. Ice. “Automated indexing for texture and strain measurement with broad-bandpass x-ray microbeams”, J. Appl. Phys., vol. 86(9), pp. 5249-5255, 1999.
[27] http://sourceforge.net/projects/lauetools/
[28] S.N. Coppersmith, P. U. P. A. Gilbert, R. A. Metzler. “Theoretical characterization of a model of aragonite crystal orientation in red abalone nacre”, J. Phys. A: Math. Theor., vol. 42, pp. 125101-125116, 2009.